psuhoffman
-
Posts
26,456 -
Joined
-
Last visited
Content Type
Profiles
Blogs
Forums
American Weather
Media Demo
Store
Gallery
Everything posted by psuhoffman
-
1) that will be easy. I’ll work on that either tonight or tomorrow. The hard part was compiling the data set and examining the pattern for each one. You can’t just look at the numerical indexes. Often an important feature is hidden. A Hudson Ridge often wont show up. Some west based NAO blocks don’t really show up well if the eastern NAO domain near Iceland isn’t impacted or there is a trough near the Azores. An east based epo ridge can sometimes show as neutral if there is an Aleutian low encroaching on the western epo domain. There could also have been blocking days before the event that by the time of the snow relaxed and the NAO flipped positive. Only looking at the day of the storm you would miss it. Now that I have that data sorting it in different ways is easy. 2. I can easily do that but the day of a snow will obviously show a correlation to cold since it has to be below avg to snow. During the storm it’s very likely near or below freezing. A better study would be to look at temps the day before and after. That would be harder. I would have to go back and look it up. I could give you the dataset and you could do it. But even then you will clearly see a correlation to cold. What you might not see is a high correlation to arctic cold. A lot of the events had temps near freezing. A lot were mixed events where 1.3 QPF lead to 6 or 8” of snow with a high of 34. That was a pretty common thing in the set. Pure snow warning events were rare. But that’s not shocking. The all snow zone on a lot of storms is relatively narrow. And most storms in the mid latitudes ride the boundary between warm/cold. We aren’t far enough north to often get a storm that’s riding the arctic boundary or a storm that’s late in its cycle and no longer pressing WAA north. You have to either have elevation or more latitude to get a lot of those.
-
This....but I’d favor “head out west and hit the powder”
-
That’s somewhat closer to the analogs of PNA only snows. There were only 6 in 70 years so still not a great snow look but it’s the first time I saw a realistically workable look on the ensembles.
-
January 1960 1964 and 2000 also had similar pacific patterns early and went on to an epic period. But all features blocking. As did 87 and 96. So again we can recover from this but the path is clear.
-
With a strong +NAM I didn’t see many that showed significant improvement. Part of that is because with a strong TPV over the pole it’s difficukt for that pac ridge to press into western north Am like we need. The strong NAM state naturally resists that. The years where that pac ridge migrated east also tended to have a - NAM along with it. Anything can happen but by far our best way out of this mess later in winter is through a flip in the NAM state.
-
This is the key imo. Looking at all the analogs to a strong central pac ridge in January, most had that feature persist at least to some degree into Feb and March. The only years that went on to a snowier outcome had significant NAO help to mitigate its impact. Absent that...the comp years that the NAO remained positive were pretty awful here. Some had better outcomes NYC north. Hopefully we see signs of a reversal of the NAM by mid January.
-
Thanks for your thoughts. Love when you pop in.
-
The IOD was keeping the convection centered in phase 2. That’s not ideal but not that hostile either. Kind of a wash. I’m not an mjo expert so I didn’t add much but the whole last month while people were rooting on the IOD demise to release the mjo once the IO standing wave weakened I was thinking “but are we sure once released it’s not going to just rush back into warm phases like last year”. The sst profile in the mjo regions except for the IOD was a little too similar for my comfort level.
-
Climo beats op runs at range. The pattern never really supported a snowstorm. Epo ridge is too far west without NAO support. Of the 88 snowstorms I looked at none were remotely like the pattern shown next week. And that was before it degraded further the last 24 hours.
-
Ummm. Ironically the people wanting the IOD to release its grip on the mjo got their wish. And the minute it did the mjo rushed right to the warm phases just like last year. Be careful what you wish for! And even assuming the wave progresses thats still 2 weeks away from getting to cold phases at day 15 and the last attempt at that feat died. I guess you just have to laugh. This is like a horror show in every way right now.
-
There were a couple random runs. It’s better to take ensembles over several days to avoid the one day blips. But over the course of days they have pretty much been warning us this was coming for a long time.
-
If that upper low pass on the gfs is correct we would likely have at the least some bands of snow showers in the area. But that’s a big if.
-
I can’t wait.
-
At the risk of more wrath I’ll say this...history suggests when an an extremely anomalous ridge develops there in January it persists in the means a long time. Most times through the rest of winter. It makes sense. To get a ridge of that magnitude takes strong forcing and it’s unlikeky the base state causing it breaks down completely that fast. Just like extremely anomalous blocking periods in the AO/NAO portent a seasonal repeat/recycle a ridge there is the same. What’s worse is the extreme positive AO in early Jan also portends persistence. Here is what has me spooked. This was last year once the pac pattern settled in early January. What prevented a dumpster fire winter was that we got a couple snows early January during a transition period before that locked in (seems we have the same chance this year except I’m not bullish on the setup. Last year we had a better HL pattern. But after that we had some HL help. There was persistent ridging over the top from the eastern epo to west NAO domain. It was never the full on epic blocking the models showed from long range but it was enough to suppress the SE ridge some. But for a ridge west of the pac coast to work history suggests the NAO blocking needs to be equally anomalous to the pac ridge. The stronger the pac ridge the more blocking we need. Right now that ridge looks the same as last year. I kind of expected that. But the problem is I actually expected more NAO help than last year. We are closer to solar min, favorable QBO projections, and a favorable North Pac and Atlantic SST argued for a -NAO year. But reality is starting to show that to be less likely each passing day. If we get last years pac with less NAO help it won’t be pretty. The analogs to that pac pattern with a +NAO are a horror show of our worst winters. To be blunt what I’m seeing is the absolute worst look I would want to see for our winter prospects. I know me saying this makes me public enemy number one...and I’ll let this post serve as my final word/warning on this. I’ve laid out my rationale and evidence. Nothing more to say. The obligatory silver lining is guidance could still be wrong. The NAO could still flip. It’s rare but not impossible. And even if our worst fears come to be there will be periods of waxing and waning of that ridge where a brief window opens and we could get lucky and score a fluke. And lastly several of the bad analogs did turn snowy in March. Seems with shorter wavelengths late that ridge is less hostile to our snow chances. So even if we head into late winter in bad shape we could at least get one fluke snowstorm at the end. 1960 was the most extreme example of that...however signs of blocking were showing up way before late winter that year.
-
I will do some more profiles tomorrow... others feel free to ask questions or add information to this thread. Goodnight
-
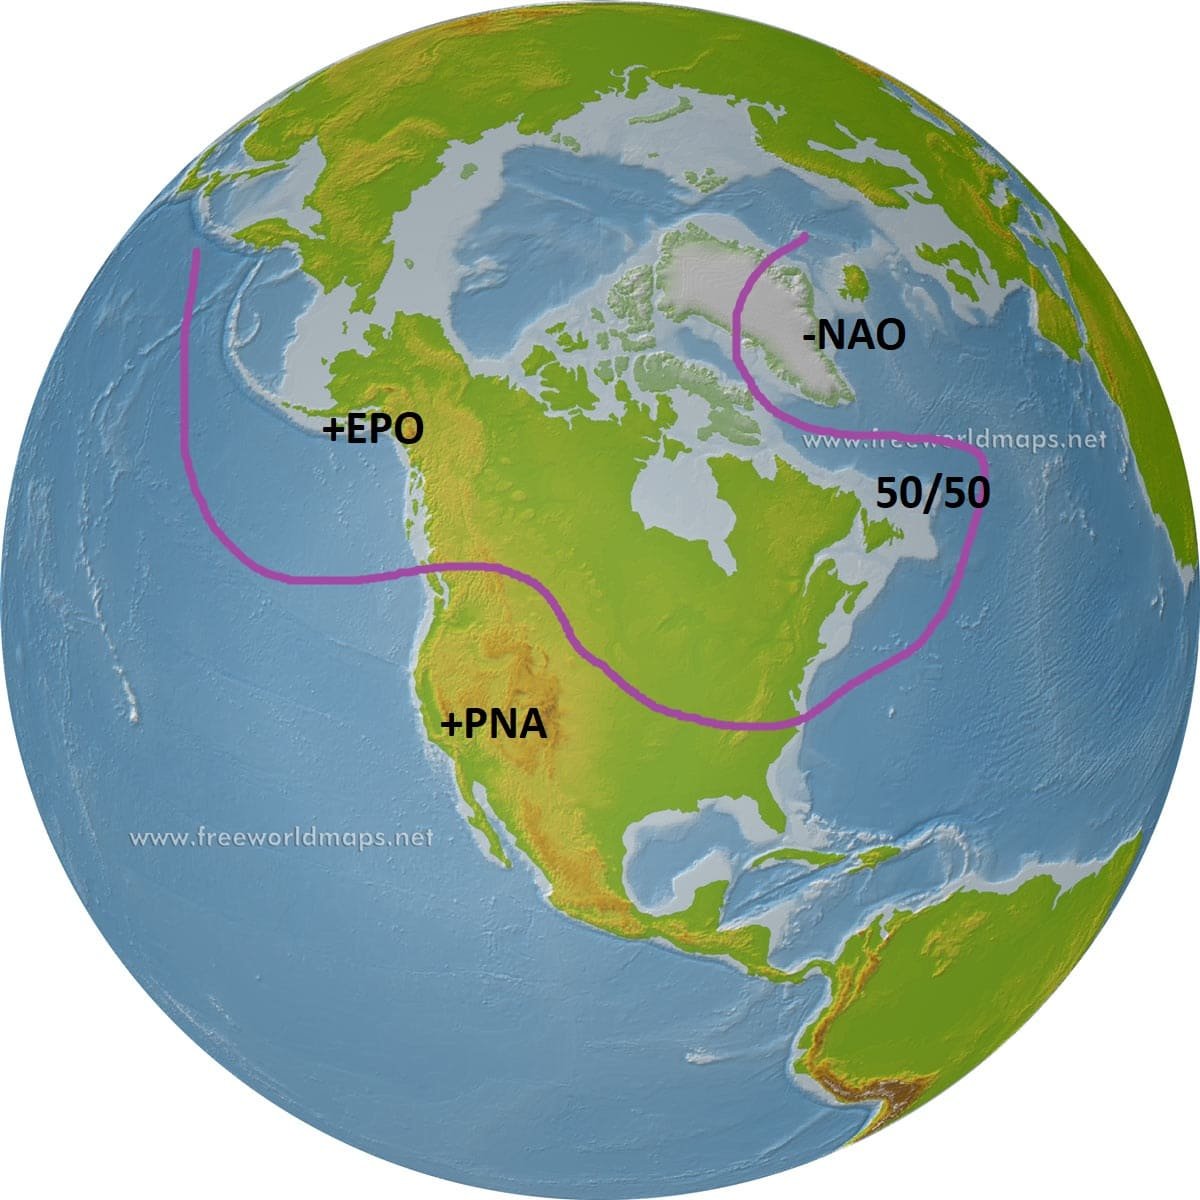
The Money Look HECS Storms This is the common look for our big ones. Almost all of our 20" plus events fit this mold. The only exception is PDII. That storm was pure lucky timing with a cold airmass and a 50/50 low. But all our other HECS storms fit this pattern. Obviously the NAO block with 50/50 low is the prominent feature. The PNA ridge also helps to get a system to dig into the east and cut off. THe EPO is actually typically positive during these events. It is hard to have extreme blocking on both sides.
-
Scand Ridge w/50/50 Pattern 10 storms Another singular factor that showed up in many storms that seemed not to fit the profile of our typical snow events (10 storms) was a Scandinavian ridge that is encroaching into the eastern NAO domain. That feature when combined with a 50/50 low can work out even in an otherwise flawed pattern.
-
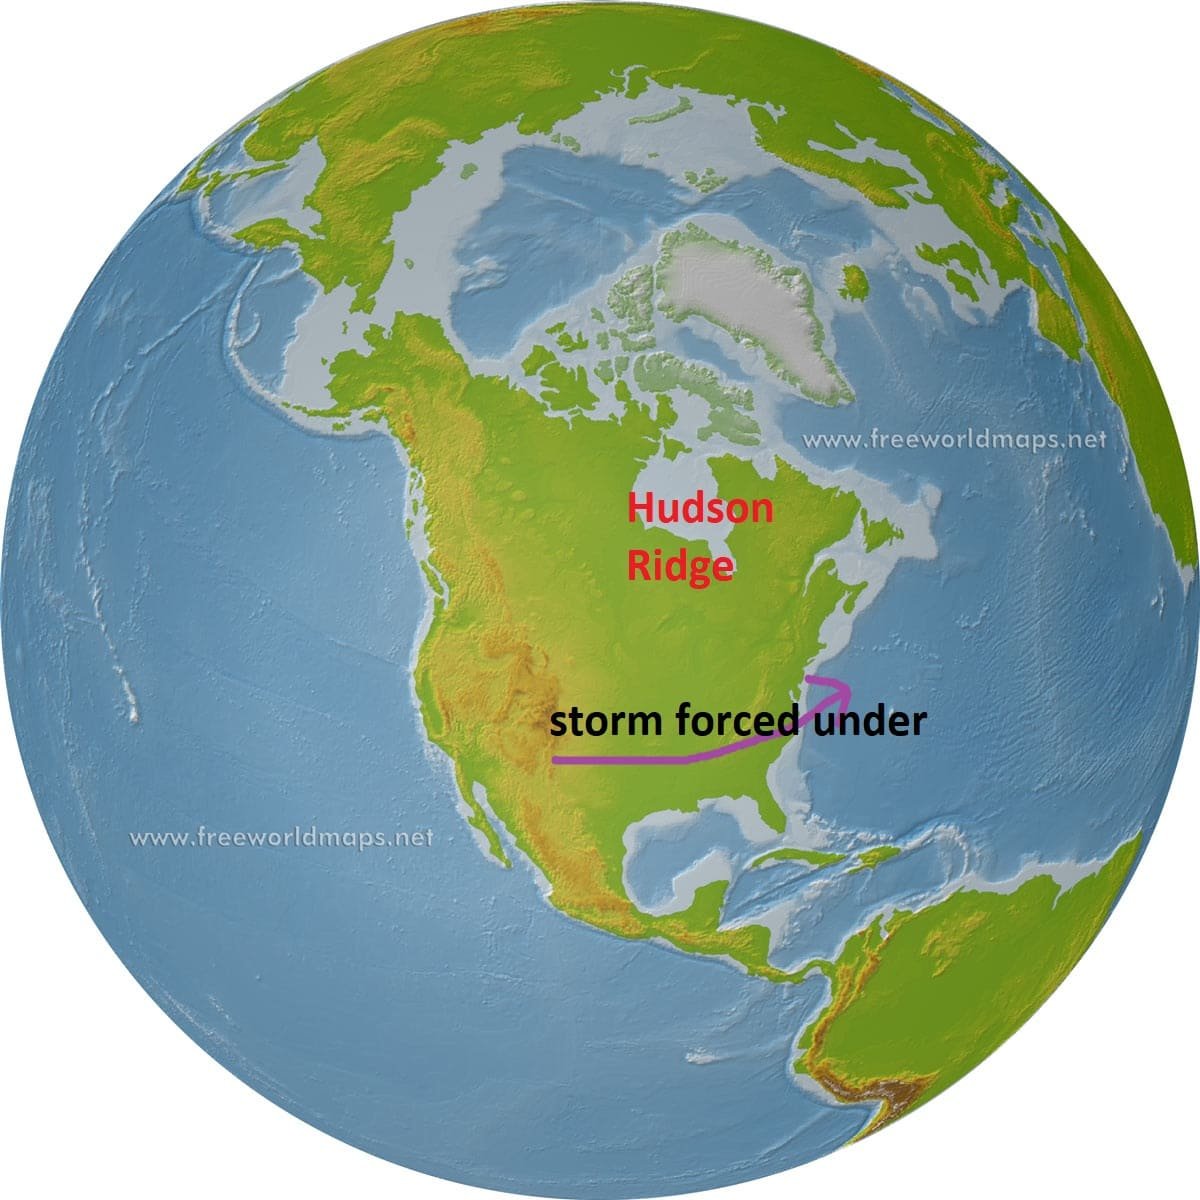
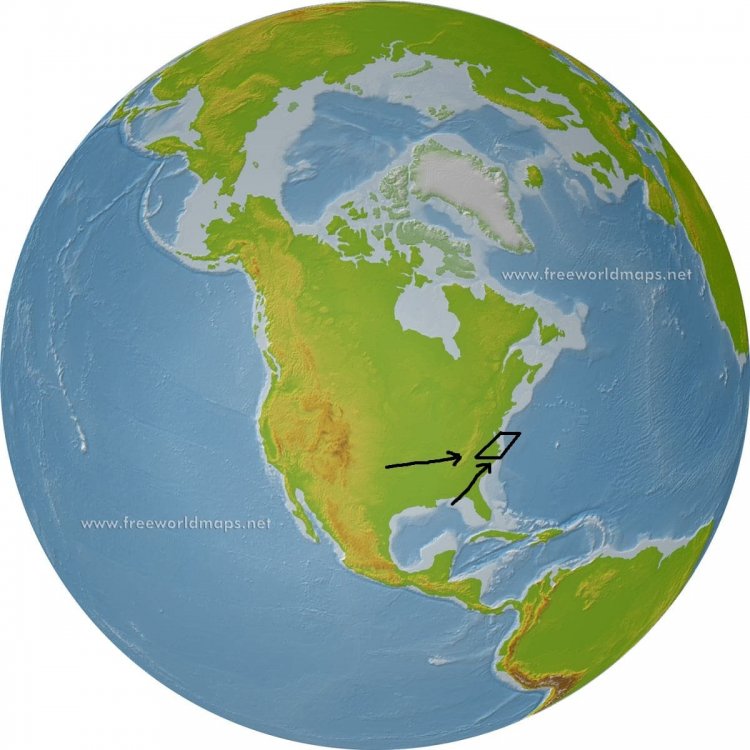
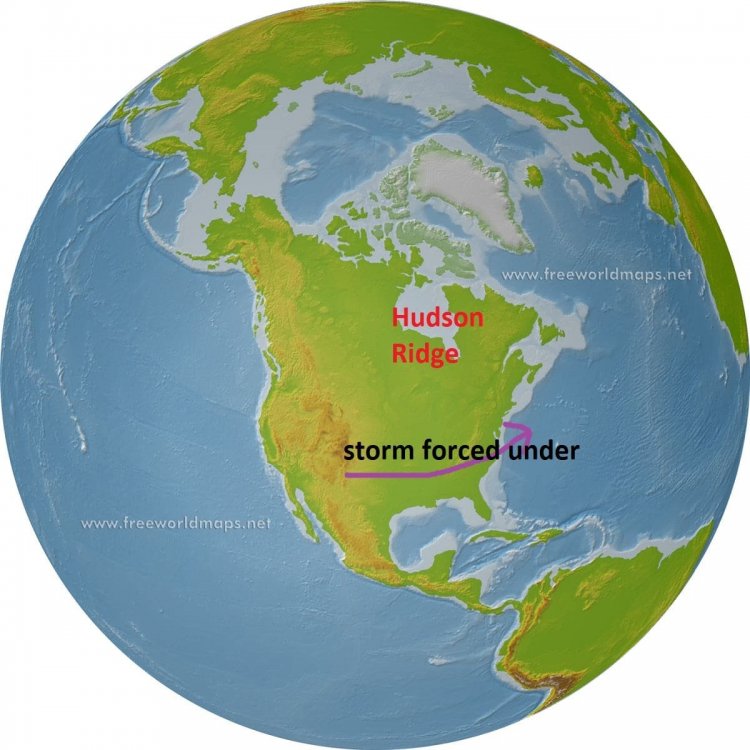
Hudson Bay Ridge 16 Storms This was the single biggest factor able to equalize a crap pattern. A lot of our "fluke" snows in otherwise bad patterns came because of this feature. Basically a ridge near Hudson Bay is perfectly located to force a storm under us even without much else right. Actually if other features are lined up right a hudson ridge would probably suppress a storm way to our south. We would want the block much further north normally. But in an otherwise crap pattern that feature has saved us often. THis is the composite of those events. Seeing a ridge centered near Hudson Bay can indicate we have a shot...even if the pattern is otherwise crap
-
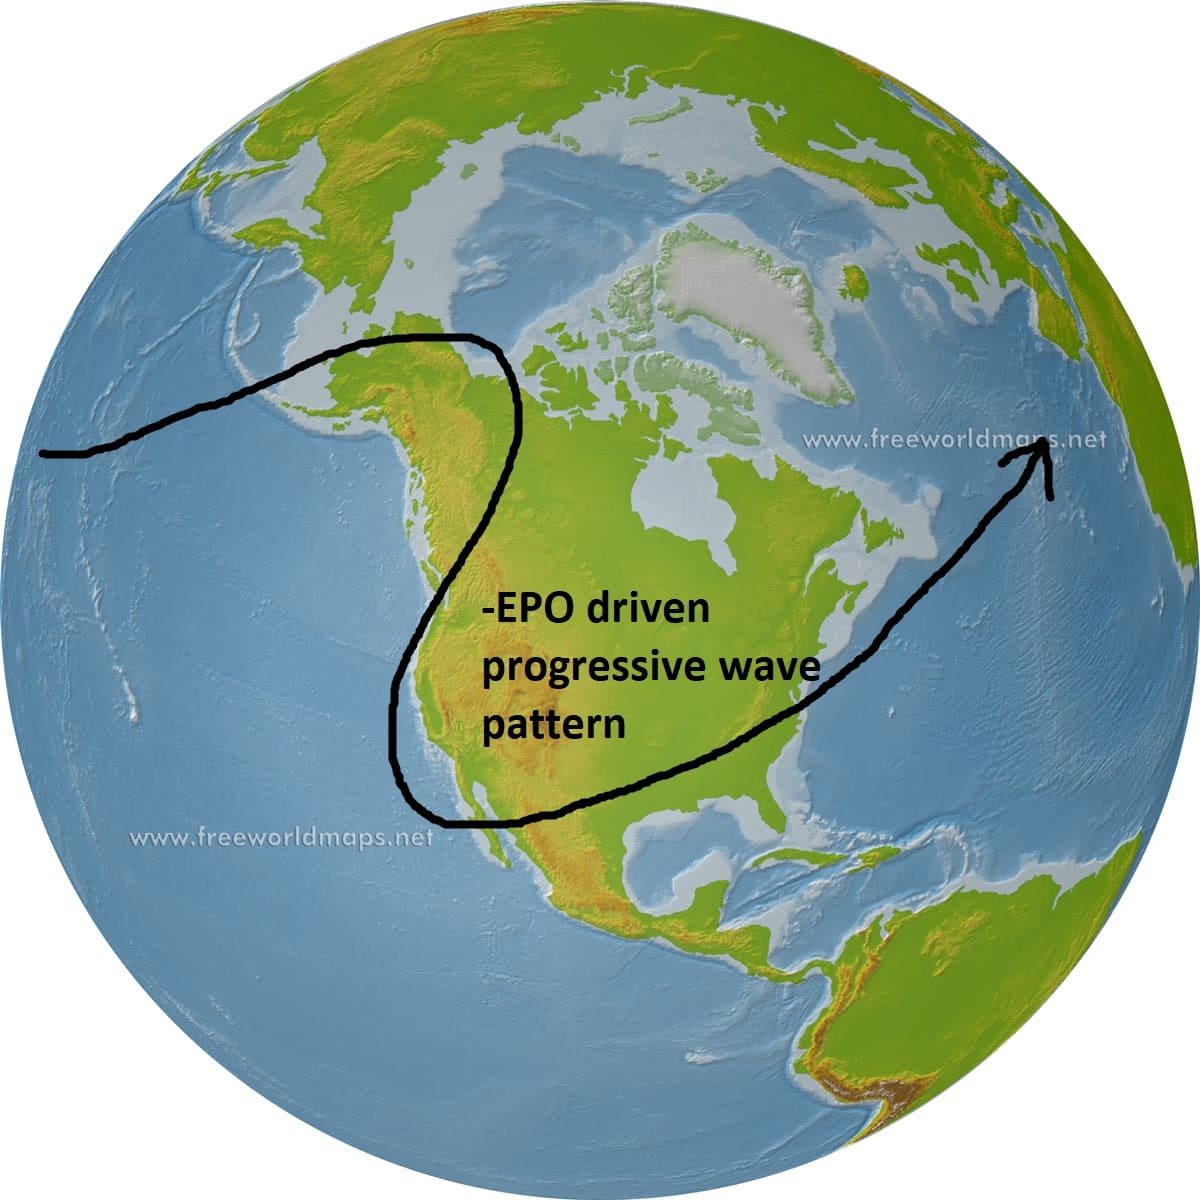
EPO Ridge Snowfalls I will start with the EPO dominant storms since we have been talking a lot about the EPO lately. This explains an EPO ridge some The EPO ridge shown there is a central (or even west based) EPO. Those don't do us much good without some HL blocking. The ridge shown there would likely lead to the storm track in red on the map. IF...we had some HL blocking to suppress the flow and hold high pressure in then the track in purple is more likely. Without any HL blocking...the EPO actually is almost equally able to bully the pattern into a snowy one as much as the NAO...9 events to 10 with only those factors in favor...but it has to be a specific type of EPO ridge. Below is the loading pattern for each of the 9 EPO driven snowfall events absent atlantic help You can see we need the ridge to be centered into northwest Canada NOT out over the PAC. That configuration can create a pattern favorable for progressive waves that get under us. We actually want the PNA negative for this to work. A full latitude ridge with no atlantic help just is cold and dry. The western trough with an EPO ridge over the top leads to a pattern like this... If the EPO ridge is a west based EPO then we need at least SOME atlantic blocking help. These all feature a -PNA also because a western EPO ridge almost always leads to a -PNA. There were no examples of a west based EPO ridge without any blocking help. Since we are starting a central PAC ridge in the face right now on guidance I will include those analogs. The ridge north of Hawaii is really a WPO ridge more than a EPO although the two overlap some but a ridge centered there can only work with extreme NAO blocking. There were no examples of a snowstorm with a ridge there without NAO help. This is the composite from those snow events.

-
Snowfall Study 5"+ events at BWI since 1948 88 Events studied For my snowfall study I looked at every warning event (5"+) at BWI going back to 1948 (that is when the upper air data is available). I know some of those events happened over a longer period than 12 hours and might not technically be a warning event but I thought 5" for the whole event was good enough. I used BWI because I feel like it is a bit more indicative for the urban corridor than DCA. If you live on a slab of concrete on an island in the Potomac south of DC...I apologize to you...and I feel bad for you, but oh well. I also included 3 events that fell just shy (they were all 4.8 or 4.9" at BWI but were significant events for a large portion of our area. That might be cheating but its my study and I can do what I want. Perhaps one of these events didn't hit your exact location the same...but when a storm misses by 200 miles its the pattern...when it misses by 20 miles its bad luck. So the patterns that caused these storms show potential, even if a particular event wasn't as good at your house as BWI. I then looked at the upper level patterns. For each storm it took a bit of analysis because sometimes I had to go back over the week leading up to determine what the predominant pattern or feature that lead to the storm was. Sometimes the key to a storm is something that happened the week before, and if you just look at the day of the storm you can't tell why the pattern was right for a snowstorm at all. So some of this is a bit subjective...the index might have shows something different on the day of the event...but if you look at the week leading up to it the pattern was in a different state. Also some h5 features key to a snowfall here can be invisible on the indexes. A Hudson Bay ridge might now show up. An extremely west based NAO Block can be muted by a trough in the eastern NAO domain or a trough near the Azores. An east based epo can be hidden by a trough in the western epo domain. I wanted to identify what features at h5 really indicate snow potential. So with that out of the way... There were 88 warning level events going back to 1948 Looking at each index on its own The NAO was the most important single index for predicting snow 58 of the storms featured a -NAO 3 were neutral 27 were positive The AO was second most predictive 54 featured a -AO 9 neutral 26 positive The EPO was evenly split 42 -EPO 4 neutral 42 positive The PNA surprisingly had more events in the negative phase (however most of our really HUGE snowstorms did features a +PNA ridge) 44 negative PNA 5 neutral 39 positive This was the breakdown for the index combinations and snowstorms for each combo the order for the chart is EPO/PNA/AO/NAO - - - - 16 + + - - 13 - + - - 11 + - - - 10 - - + + 9 + + + + 6 - + + + 3 Some take aways from the chart... the most common snowfall combo is a pattern driven by a -EPO ridge in conjunction with atlantic blocking. The next most common is a +PNA ridge with atlantic blocking The 3rd most common is a combo EPO/PNA ridge with atlantic blocking. So....atlantic blocking with ANY pacific help from either the PNA, EPO, or both...accounts for 40 of the 88 storms. After that we are left with storms when only ONE factor was working in favor of it. For those.... 10 were purely a function of High Lat blocking overcoming a crap pacific 9 were purely from an EPO ridge with no PNA or High Latitude Help (All of them were an east based EPO ridge) 6 were purely from a favorable PNA ridge and no other help Only 3 came from a combo EPO/PNA ridge with no blocking. So for everyone that throws around 1993....that was one of only 3 storms that hit with that look. A huge EPO/PNA ridge with no blocking is just cold/dry and progressive. Usually a quick cold shot then a warm up. One last note... by far the single biggest factor if we had to work with only one thing to get snow...is the Hudson Bay Ridge. We had 16 storms where the only really positive feature working in our favor was a Hudson Bay Ridge. Most of those storms don't show up on the chart because that feature often falls in between the typical index domains and in a lot of those storms all the other factors looked like crap. Apparently a Hudson Block is a local enough phenomenon to overcome pattern issues in a lot of other areas. It was by far the biggest way we got a snowstorm in an otherwise crap pattern. Also there were no cases with a -AO as the ONLY factor working in favor. That is not because the AO isnt important its just really hard to have a -AO without there being an EPO or NAO ridge because there is some overlap of those domains. It's also hard not to have EPO or NAO help...since the TPV being located near one usually opens the door to ridging near the other. And if we did have lower heights all across both domains the AO would likely be very positive. I will show some of the common composites to these patterns in following posts
-
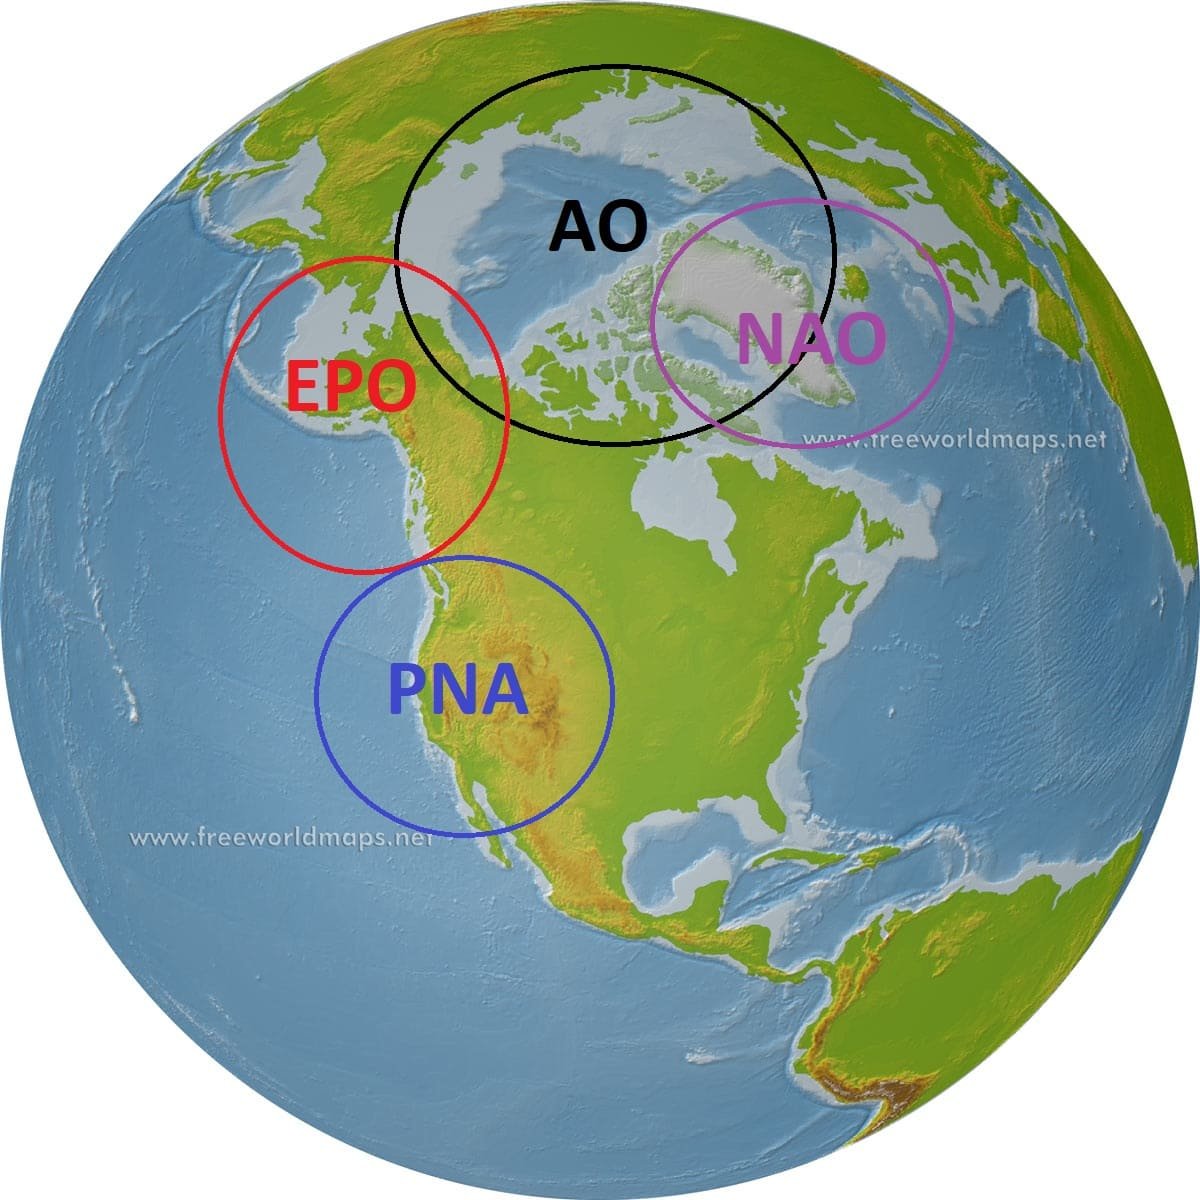
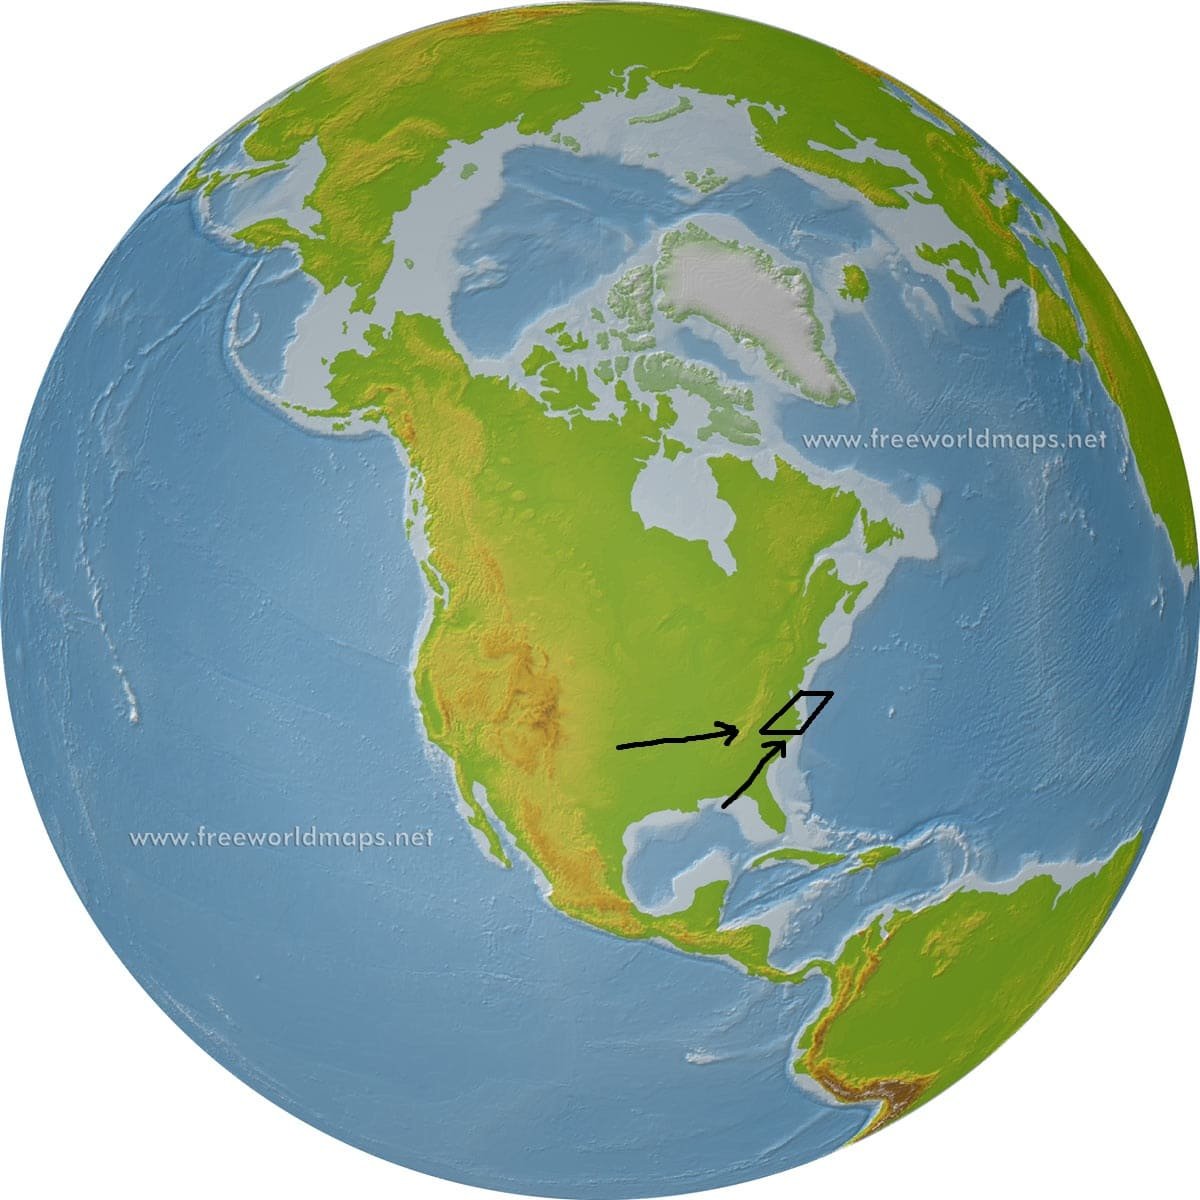
I have been seeing some of the same questions posted wrt patterns lately and been getting some PMs about it so I thought I would post some stuff I have been working on for a while wrt snow climo and patterns. Others can add to this also. I did a study of all warning level snowfall events at BWI going back to 1948 and I will post the results below but first I thought I would give some info. One disclaimer: most of this research and information is focused on warning criteria snowfalls. We can fluke our way to a minor advisory level event in almost any pattern during mid winter. It really muddies things if we include a lot of 1-3" type events. But there are clear patterns if we exclude minor events and only look at what patterns are right for 5"+ events. I am not dismissing minor snowfalls but its really hard to identify patterns for a 1-2" snowfall. Some common pattern driver indexes we reference The colder phase of these indexes are -EPO (ridge), +PNA (Ridge), -AO (weaker TPV over the pole), -NAO (ridging). But colder doesn't always equal snow. There is no one pattern for snow. The trick is getting the jet right so that we get a storm into our "box". The most common tracks to get a significant storm into that box are shown. But there are a variety of pattern combinations to get the jet wavelengths right. Changing one factor can change what we need from another. But the key is getting the jet aligned for the track of storms to end up just to out south or southeast. For example...most of us know about the idea -NAO pattern... But...a -EPO pattern can work too or a Hudson Bay Ridge I will go into specific patterns and what percentage of our warning criteria snowfalls came from those patterns in the next few posts


- 70 replies
-
- 20
-

-

-
My problem was obviously making my analysis before the eggnog not after.
-
On the other hand...if we assume we will not get any help from the NAO...this is the composite of all snowstorms since 1948 that featured an EPO ridge without NAO/AO help. Notice the location of the EPO ridge. It is VERY possible to get a snowstorm from the EPO alone...its actually only slightly below the NAO in terms of if we had to work with only one factor...HOWEVER that EPO ridge must be east based in NW Canada not out over the Pacific. So if we assume the AO/NAO do not improve we would need that ridge to end up significantly further east than projected currently.
-
If we get a dominant central Pac ridge pattern...there have been 10 January/February warning level snowfall events in our area with that regime, but every one had a pretty significant NAO block. This is the loading pattern a couple days before those 10 events. The point is for that ridge alignment to work would require an equally anomalous NAO block.
-
Most of us were on Eastern then. And I remember discussing the chances for snow late/Jan into Feb from well in advance. Yes there was a mild period but even then there were markers. The high latitudes remained conducive. And extreme blocking tends to recycle. I haven’t punted anything yet but I stand by what I said. If....We get to mid January and that pac pattern locks in with a raging positive AO were in big trouble. That look has NEVER ended well and it can be very persistent and hard to break out of. That look has accounted for some of our very worst winters like 2002 and 2012. Im not rooting for that. I want snow. But it’s hard to ignore what’s showing up in all guidance. Me saying that look sucks won’t change anything. Hopefully it never comes to that. There are ways out. Maybe the guidance is misplacing the ridge and it ends up creeping into NW Canada over the top. That’s an ok look. Or the NAO could flip suddenly. But we are flirting with what is the absolute worst look we could get for winter prospects on guidance right now imo. That’s based on all past seasons with a similar pattern. If me pointing that out bothers you...well sorry but not sorry .