

Stormchaserchuck1
-
Posts
2,004 -
Joined
-
Last visited
Content Type
Profiles
Blogs
Forums
American Weather
Media Demo
Store
Gallery
Posts posted by Stormchaserchuck1
-
-
Yeah, Natural Gas is really low right now, which means that the average NG trader is going for a warmer Winter at this point for the Great Lakes, NE-US, Europe, and Russia. (Down 10% today!)

Especially compared to Oil and Gasoline..
I did find that the correlation isn't very big until you pass the Summer-hot season. Maybe they think it will be a cooler Summer? I doubt it..
-
@40/70 Benchmark
The CPC came with +0.75 NAO for DJFM March, which was outside of my +0.54 SD range for NAO forecast, based on May-September N. Atlantic SSTs. But if you look at the actual maps, the SLP between Iceland and Azores (where the NAO is calculated) is a slightly negative or neutral NAO index reading for the Winter, which fits my forecast, which was near 0.0 in prediction. -
On 4/10/2024 at 6:43 PM, Stormchaserchuck1 said:
Signs of a +EPO pattern around Apr 23-24. Above average temperature pattern if that verifies. It could occur +days
Not much of a +EPO warm pattern in verification
First signs of a La Nina-dominated -PNA pattern in the Pacific throughout the run in the medium/long range on today's 18z GEFS
-
First sign of a La Nina -PNA pattern on todays 18z GEFS
-
 1
1
-
-
To be honest, money dominates and things like weather can be manipulated to fit peoples wallet. I've been heavily relying on Natural Gas futures.. which are currently at a record low near 1.6.. dim prospects for cold and snow next Winter.
-
80dbz on that cell SW of York, PA.
-
81F in Fallston. Hearing loud rumbles, was thinking it was some military testing or something, but it turns out there are strong thunderstorms to my north.
-
1
-
-
Signs of a +EPO pattern around Apr 23-24. Above average temperature pattern if that verifies. It could occur +days
-
ENSO subusurface had backed away from the deep cold for a few days, now it's going back. -6c pool on the most recent TAO/Triton maps. Here is the progression over time. SSTs will likely catch up with the subsurface cold in the coming months.
-
1
-
-
16 hours ago, weatherwiz said:
Isn't the Hurrell NAO method a bit better overall than the CPC's method?
I don't know that they are the ones that developed the NAO originally, but it wasn't the CPC. NAO was defined in the 1950s/60s, I think, as sea-level pressure differences between ~the Azores islands and Iceland regions.
-
 1
1
-
-
Another thing to note is, since October, the Hadley Cell has been expanded north, all around the globe.
.gif.beafddba360b88108a80cad70155603b.gif)
In the Summer, those mid-latitude cells lift north. The past doesn't necessarily predict the future, but lack of deep troughs digging, coupled with normal La Nina pattern could potentially create a more favorable pattern for US hits.
All this while SLP has been below normal:
Earth's precipitable water has been record highest, a whole 120% #2 analog 2015-16, for the Sept-Apr period (records go back to 1948).
-
4
-
-
That is interesting. We had a 4-contour Greenland block, but nothing rivaling the strength of even what we have seen the past few Winters. There seems be a major disconnect between CPC's NAO numbers and what is occurring in the NAO area, measured by sea-level pressure between Iceland and the Azore islands. This Winter came up with something like a +0.7 NAO for DJFM, but if you look at sea-level pressure and 500mb, it should have been measured negative.
Either way, hopefully this is some sign that we will see more persistent -NAO's in coming cold seasons, as we had seen 41/46 +NAO Winter months, going back to 2013. and 16/16 of the NAO's >1.11 in the monthly's during that time were all positive. 16-0 since 2013. I think the larger reasoning is issues with CPC's measurements, but maybe the overall signal is turning around..
-
1
-
1
-
-
This storm/rain for the last 3 days is actually from a Stratosphere warming that occurred in March. It "downwelled" to a -NAO, and as that -NAO block lifted out, we got this storm underneath of it.
-
It's actually not very far away from snow, 48F here.
-
14 minutes ago, Eskimo Joe said:
Looks like a wake low spun through Baltimore through NE MD:
Check out the temp spike (Red Line), Wind gusts (blue lines), and pressure drop (black line), along with a brief spike in solar radiation from the clearing behind the low...probably from some brief subsidence.
A tree fell here.
-
Wow what a wind storm!
-
11 hours ago, so_whats_happening said:
I was just about to post this quite the increase in negative anomalies (or decrease, however you choose to look at it) in just 5 days. This also seems farther west then past events have shown which end up around 120-140 W currently this is sitting just east of the dateline.
-PNA pattern starting to set in. https://ibb.co/DVGmNdf
I've researched this, the PNA is more sensitive to ENSO central-subsurface than any other ENSO measurement, including surface SSTs and the MEI, at 0-time.
-
2
-
-
Really cold in the subsurface now. For comparison, this may rival the strongest subsurface anomalies we saw in this past El Nino.
.png.7cb2446f96216449c7b327a0d4a2c454.png)
-
1
-
-
All time Hurricane tracks
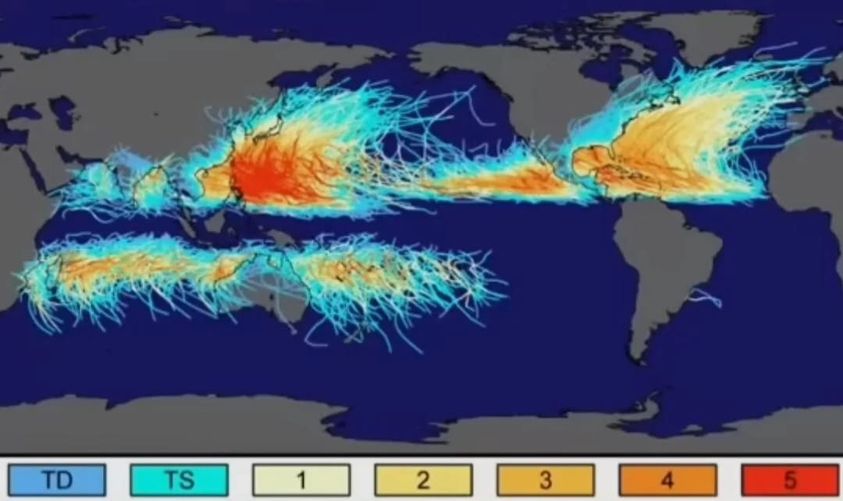
East coast, US has been lowest relative to long term average, and vs Atlantic activity lately (since 2000).
-
The central-subsurface is cooling rapidly.
-
We had an expanded Hadley Cell/N. America SE ridge since late January:
.gif.d717ac698f2c4a10884aaf50a88bae50.gif)
I've theorized that ENSO subsurface conditions have a stronger correlation to the N. Hemisphere pattern than the surface does at 0-time (not perfect, but more often than not, historically.. ). We had cold water move below the central-ENSO region during mid to late January...
I made list of analogs matching this US Temp pattern, since the AMO went positive and PDO went negative ~1995. These transitioned from an east-based El Nino look in April, to a stronger La Nina by the following December.. (13 analogs):
.png.f2b9851f2ed5ac441f82de5da35bda79.png)
-
1
-
-
Big US SE ridge pattern, extending up into Canada Jan 23 - March 14:
.gif.b61cb13a19bce3b451784df9e63a5dec.gif)
Hadley Cell extends north in the Pacific and Atlantic Oceans in April (analogs rolled forward)..
A correlation to following Atlantic Hurricane season has been strong since 2012:
Positive analogs: 2023, 2020, 2017, 2012, Average Storms for Positive analog seasons: 21.8 NS, 9.8 Hurricanes, 4.5 Major Hurricanes
Negative analogs: 2015, 2014, Average Storms for Negative analog seasons: 9.5 NS, 5.0 Hurricanes, 2.0 Major Hurricanes
-
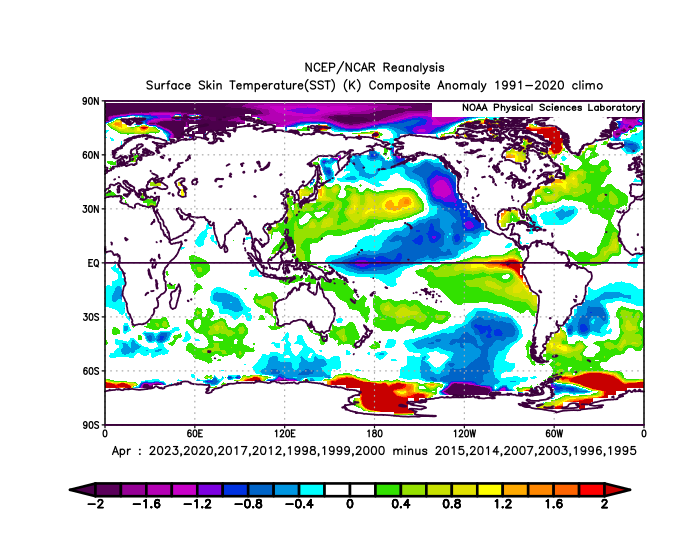
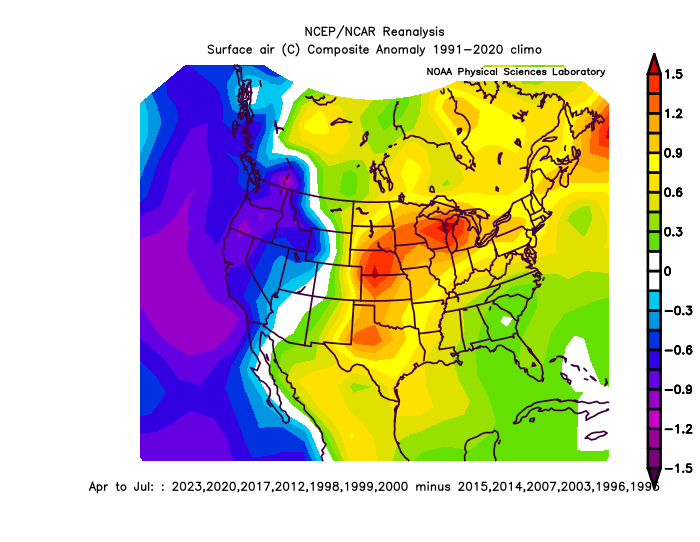
We may be headed for an above average Spring.. I know that's not saying much, but..since the AMO went positive/PDO went negative ~1995 here are our top analogs to this composite since Jan 23rd:
.gif.7d71dee02bf8c54442db05f0a41d3c57.gif)
Positive analogs: 2023, 2020, 2017, 2012, 2000, 1999, 1998
Negative analogs: 2015, 2014, 2007, 2003, 1996, 1995
^13 years since 1995...
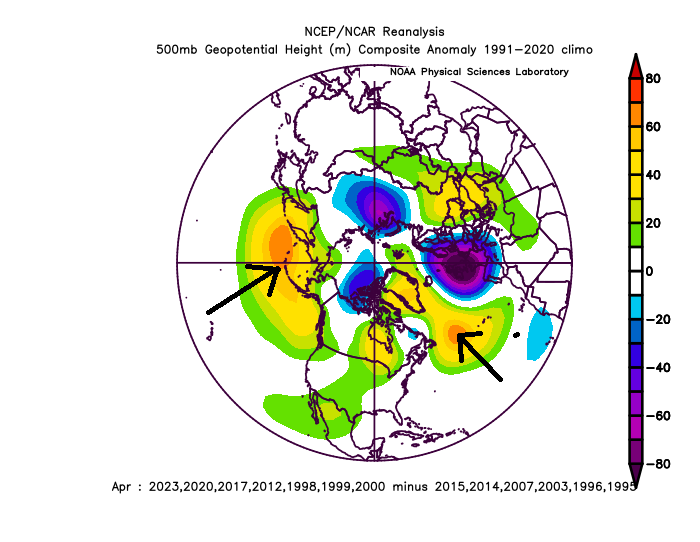
Roll-forward to April:
.png.c97359afe5cc34086ff2acc2ec224086.png)
April through July:
-
1
-
-
CPC is now giving >80% chance of La Nina for peak Hurricane season
.png.51769e7a48fd48fc580c068456fef8f0.png)
Climate models are keying in on possibly a transition to Strong La Nina later this year
.thumb.gif.615c5b49c917d9211804cc5eb39f95c1.gif)
The SE Atlantic Ocean is still very warm, as several countries in Africa have recently broken temperature records.
-
1
-
1
-
.gif.21bd0f0c018d85603835453c01933f32.gif)
April Discobs 2024
in Mid Atlantic
Posted
Suppose to get up to 87F now on Monday.. no +NAO, +EPO any of that.. We've been free of "warm patterns" in the upper latitudes for a little while, and temps are still somewhat overperforming.