

TheClimateChanger
-
Posts
4,550 -
Joined
-
Last visited
Content Type
Profiles
Blogs
Forums
American Weather
Media Demo
Store
Gallery
Everything posted by TheClimateChanger
-
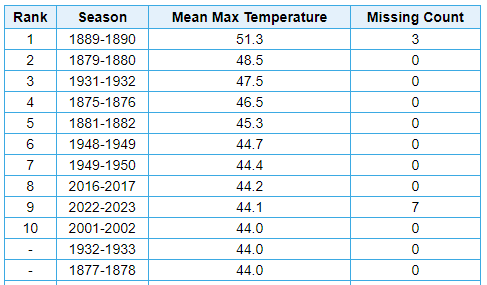
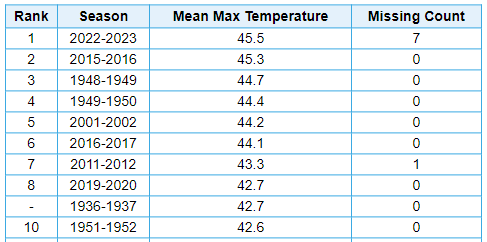
With 7 days left in meteorological winter, the mean maximum temperature has been 44.1F, which places it as 9th warmest in the threaded Pittsburgh climate record. Of the 8 years ahead of this one, the top 5 were at the city office. The 1889-90 figure is insane, probably still the warmest winter in Pittsburgh history but on steroids due to location, siting and equipment changes. Numbers 6 & 7 were recorded at AGC. And Number 8 was recorded at PIT. We should surpass 2016-2017, given the forecast, making this the warmest winter since records began at PIT. In regards to the two years on the list which were observed at AGC (1948-49 & 1949-50), it's worth noting this winter has been about a degree warmer than those winters at AGC. So while those years show up as slightly warmer than this year in the threaded record, it's actually been somewhat warmer this year. That's obviously the case for the earlier city records as well but there are no modern observations there to compare.
-
Looks like a dissipating smoke plume near the Pennsylvania Turnpike not far from the state line. Not sure if there was a brushfire.
-
Elkins, West Virginia is the craziest to me. Elkins averages nearly twice our annual snowfall and has nearly 5” fewer and it’s already bad enough here.
-
New England Met Winter 2022-2023 Banter
TheClimateChanger replied to HoarfrostHubb's topic in New England
The initial derailment was late on the 3rd, which also sparked an intense chemical fire which burned to varying degrees over the next couple days. -
Saw this posted in the New England forum, and I just thought it’s classic Pittsburgh. Major winter storm in 2014 up and down the eastern seaboard and we appear to be under an Air Quality Advisory
-
New England Met Winter 2022-2023 Banter
TheClimateChanger replied to HoarfrostHubb's topic in New England
The “controlled burn” of the 500 tons of vinyl chloride which produced the apocalyptic toxic waste plume was on the 6th, but you think it would be gone either way. -
Winter 2022/23 Banter Hangout
TheClimateChanger replied to Chicago Storm's topic in Lakes/Ohio Valley
Erie, PA is down 158.1" over the last 4 years, or an average of about 40" per winter. 2019-20: 67.6" (-36.7") 2020-21: 64.3" (-40.0") 2021-22: 61.4" (-42.9") 2022-23: 41.0" (-38.5") -
Winter 2022/23 Banter Hangout
TheClimateChanger replied to Chicago Storm's topic in Lakes/Ohio Valley
Probably just smoothing, looks underdone in Cleveland. Cleveland 2019-20: 33.8" (-30") 2020-21: 51.9" (-11.9") 2021-22: 53" (-10.8") 2022-23: 17.5" (-26.5") Cumulative departure: -79.2" Toledo 2019-20: 25.6" (-11.8") 2020-21: 40.2" (+2.8") 2021-22: 30.8" (-6.6") 2022-23: 9.5" (-17.2") Cumulative departure: -32.8" -
For the period 2/1 to 2/16, this was the 2nd driest on record, the 2nd least snowy, and 3rd warmest for average high temperature. Due to the change from downtown to the airport, average low temperature was only 30th warmest and dominated by records from the old city office. The cooler lows make this only the 13th warmest period by mean temperature. Precipitation 1 1934-02-16 0.11 0 2 2023-02-16 0.15 0 3 1941-02-16 0.19 0 4 1904-02-16 0.29 0 5 1906-02-16 0.32 0 6 1978-02-16 0.35 0 7 1969-02-16 0.38 0 - 1954-02-16 0.38 0 9 1902-02-16 0.39 0 10 1878-02-16 0.40 0 Snowfall 1 1909-02-16 0.1 0 2 2023-02-16 0.2 0 - 1918-02-16 0.2 0 4 1938-02-16 0.3 0 - 1921-02-16 0.3 0 6 1959-02-16 0.6 0 - 1949-02-16 0.6 0 - 1884-02-16 0.6 0 9 1946-02-16 0.7 0 - 1927-02-16 0.7 0 - 1887-02-16 0.7 0 Average High Temperature 1 1884-02-16 52.4 0 2 1990-02-16 50.9 0 3 2023-02-16 49.1 0 4 1887-02-16 48.9 0 5 1927-02-16 48.3 0 - 1925-02-16 48.3 0 7 1876-02-16 48.1 0 8 1938-02-16 47.9 0 - 1890-02-16 47.9 0 10 1999-02-16 47.1 0 - 1882-02-16 47.1 0
-
This is the cumulative departure for the last 4 winters (2019-20, 2020-21, 2021-22, and 2022-23 to date).
-
https://twitter.com/NWSWPC/status/1625965869732954129?s=20
-
Ever since that gigantic toxic waste plume passed through western Pennsylvania, every storm system just seems to fizzle out overhead. Not sure if there's some sort of program of cloud seeding upstream to cut down on the acid rain until it dissipates more?
-
I feel like, as we enter into a new climate regime, it's going to be difficult not to see our snowfall decline precipitously. Pittsburgh is just too far south and low elevation to see much snow in a warmer climate. I think most places at similar latitude and altitude see less in the way of snowfall already, and many of our bigger storms are already nailbiters here. So I would expect more of the precipitation from those events to fall as rain.
-
Zone area forecast for Allegheny has less than an inch tonight and 2-4 inches tomorrow.
-
That's like February 1998. I was shocked to learn there was a storm early that month that dumped 18.5 inches at Cincinnati - at least at the airport in northern Kentucky, and 20-24" from Louisville to Lexington and even into southern West Virginia. Beckley had two 26" storms within two weeks - one in later January and then one in early February.
-
Finished with about 2.5-3 inches back home. Not much in Pittsburgh, but it looks like most places picked up around 1" or more.
-
Snowing here again, might actually end up with two inches or so before all is said and done. Not a lot, but it is a picturesque snowfall hanging to every tree branch and elevated surface. And sadly the largest storm of the season so far.
-
Southern Beaver County.
-
About an inch and a half here, of which about 1” fell in last hour
-
Very heavy snowfall now, rapidly accumulating on all surfaces.
-
Snowing at a decent clip here. Visibility not too bad, but big, fat flakes are falling. Ground is coated.
-
Probably the warmest January on record locally, but obviously somewhat inflated. Cincinnati's 19th century and early 20th century observations are also inflated - while that area is somewhat lower in elevation generally being downstream on the Ohio River, the move from downtown to the fringe suburbs was accompanied by a similar elevation jump as in Pittsburgh with the move to the two airports. The weather bureau continued to take records downtown until, I believe, 1971, and from 1952-1971, the downtown station averaged 2.6 degrees warmer than Pittsburgh International Airport. And AGC averages about 0.6F warmer than PIT over the past couple of decades, although the last couple years it's been somewhat greater than that. The 19th century records seem to have other biases, probably from the rooftop siting. Could be 3-5 degrees warmer than modern records, which would suggest that month may have been more like 39.5-41.5 if measured at PIT using modern equipment. Probably still good for #1. September 1881 is another month that's obviously "juiced up". Almost certainly was the warmest September, but the measurement biases elevate it so much that even with global warming, I doubt we'll see that "official" figure beaten. Certainly not in our lifetimes.
-
Honestly, it probably should be higher than 1 in 4, given the map projection. Wheeling and Morgantown are both roughly 1 in 3 chances [32 and 35 percent]. The GEFS always goes bonkers with the urban heat island effect in Pittsburgh for some reason.
-
Not sure. The last blizzard warning issued by PBZ was during Hurricane Sandy for the ridge tops.
-
Looks like 12 was the official high. These arctic air masses are always difficult to gauge as they tend to pay no mind to the typical diurnal temperature regime. Too bad we couldn’t string at least one good radiational cooling night (clear skies, light winds) to see what we could have bottomed out at it.


