vortex95
-
Posts
728 -
Joined
-
Last visited
Content Type
Profiles
Blogs
Forums
American Weather
Media Demo
Store
Gallery
Everything posted by vortex95
-
Heaven help us when the next hurricane make a direct hit on SNE. Even a weak hurricane like Belle from Aug 1976 would be really bad. Look at what Irene did in 2011 and that was only a 50 kt TS. And any of the hurricanes that hit from 1938 to 1960? We'd be talking 50-75% of the population of MA/RI/CT alone w/o power, that would be 6.5 to 9.8M in a relatively small area, by far the biggest outage for the region. Sandy had about 8M w/o power, but that was stretched from BOS to DCA, big difference! Since it has been since 1991 for the last direct hurricane strike, the trees have not been "taxed" hard by big wind for a long time while they are in full leaf, esp. inland sections, so that is going to make it that much worse when we do get one. Sure, going a record 34 years w/o a direct strike has its positives, but there is a flip side as well.
-
I did discuss the social aspect of thing in my first or two posts on Blizzard of 78 comparisons. And you bring up the social aspects of things made me think more. These days it is TMI to the extreme, and so often, people do know not *what* to think concerning the forecast, esp. when it comes to stormy wx. Oh, *we* know on this forum what is what, but we are a small minority. The avg person has a tough time w/ wx these days, and I don't blame them! They have no idea who to trust, or even where to starts to try to get the best wx info. And w/ the hype out of control, ppl get frustrated and start to tune it out. Once again, i don't blame them at all. They are so sick of every wx event treated as if the end of world is nigh, who wouldn't get fed up??? This is why I think now, the social sciences concerning wx are now the most important. Our forecasts have come such a long way and are so good now, that's not the problem anymore. The problem lies w/ presentation and communicating that info, and having "too many cooks in the kitchen" -- armchair wx ppl on social media thinking they are the "da bomb", among other things, all vying for attention and trying to monetize their content! Not sure how to address these social issues, and it is a very complex problem. But just understanding why things they way they are is a good start!
-
It's a weird hybrid. The sfc low formed over the Carolinas but not really a secondary b/c the primary low, if you want to call it one, is quite weak and just has been sitting in place over the ern Great Lakes. It isn't a clipper type low associated w/ a strong polar jet trough that is steadily moving ESE that phases in w/ a southern stream s/w trough. There is no real polar jet, but not really something you could call a STJ either! Just one big solid jet across the center of the CONUS, in the mean anyway if you avg the wavelengths. Doesn't matter in the end though. Get the blockbusters any way you can!
-
Oh yes, when I got my first FWD car in 1998, it made a world of difference driving in snow, never mind the anti-lock brakes. You had to work at it to actually fish-tail or wipe out in an open parking out testing things out!
-
I knew I left something out!
-
Part 2 of my Blizzard of 78 comparison "rant"! So for the meteorological aspects of this storm compared to the Blizzard of '78?, it really does not hold a candle to it IMHO. Yes, I know the intensity of the low pressure itself will be stronger than than 78 and the pressure difference from the low S of New England and the high pressure center over western Ontario is significantly larger now than 78, but that is just one aspect, and you can't treat one factor in a vacuum or use single aspect, and say, "it's going to be worse for sensible weather!" That's not how it works in the atmosphere as many other factors come into play. The upcoming storm will not stall for 24 hr like the Blizzard of '78 did. The pattern is progressive and not blocked. Also, when the Blizzard of '78 stalled and rapidly deepened, it was in an absolutely ] ideal location for southern New England to get the worst of it. In many storms, there is a "sweet spot," so to speak, where the low rapidly intensifies and one area, usually N of the sfc low, gets the max sensible wx impacts, whether than be the most intense precip rates or or highest winds. For this storm, the RI will take place tonight not far off the Delmarva, well S of the region, by the time the low gets close enough for its biggest impacts to the region, that rapid intensification period is done. Oh, don't get me wrong, it is still a very powerful storm, but we are not in the absolute "sweet spot" like we had in the Blizzard of '78. Yes, I know I sound like I am splitting hairs here, but these details count. For instance, it may be the difference between getting "only" 3"/hr snowfall rates instead of 5"/hr. I know looking from a broad view that may seem insignificant, but snowfall rates do count for impact, esp. for airport operations and road crews. The overall pattern over NAMR now is nothing like it was leading up and during the Blizzard of '78. This is the biggest difference overall. For 78, the evolution was about as ideal and extreme as you could get, with a very deep trough amplifying in the eastern U.S. to form a very large, cut-off low pressure at 500 that stalled. At the same time, an enormous ridge built up in the western U.S. and Canada, actually forming a cut-off high pressure at 500 in Canada, which is quite rare, in fact, the only case I know of for a big East Coast storm. It was about as textbook classic as you could get! This NAMR pattern in Feb 78 was along the lines of what happened for the Blizzard of '93. Not exactly the same pattern for the 1993 storm (the "triple phaser!"), but still extraordinary, and the result both times were record storms. The pattern now? You look at it yesterday and the day before, and it looks nothing that unusual, and actually it was pointed out to me two days ago, "would you think looking at the 500 over the Lower 48, a blockbuster blizzard would occur on the East Coast a few days later???" So kind of non-standard or lacking classic setup, but the wx has virtually endless combinations and can spit out some odd events that don't fit the textbook classic what you learn in college! This is what keeps forecasting a challenge and enjoyable, always learning! And how about the other big thing w/ the Blizzard of '78?, the coastal flooding, and not just one big storm tide, 4 in a row, and many locations had their highest storm tide on record, which was not exceeded in some locations until 2018. Not going to see that w/ this storm. There should be some significant coastal flooding, but since the storm is moving along, and the actual size of the storm is not as quite large to set up a big wind fetch which really builds the storm tides, I don't see how you can compare much to 78. Another item? There was a frigid arctic air mass in place in the NEUS prior to the Blizzard of '78. We don't have that this time. This does make a difference often for total precip. Having a frigid air mass at low-levels makes for great overrunning. Recall the big storm last month? That had a frigid air mass in place, yet | rather weak sfc low development, but it didn't matter for blockbuster snow amounts. Now this time, we have an intense surface low, so that in itself will result in a lot of precip. But compared to 78, which had an intense surface low *and* a frigid air mass in place for it to run into, that made for some exceptional snowfall amounts. Regarding snowfall, no model is forecasting 3 ft or more snow for any location. Max amounts in the Blizzard of '78 reached 50" in RI and eastern MA. 3 feet was widespread. So the Blizzard of '26 is not forecast to have snowfall amounts *this* high, so one needs to be careful when bringing up our "big one" for comparison since it can and does cause confusion, worry, and stress, among other things! I would say that this blizzard will be a lot like the Blizzard of '13, which was a solid biggie/classic in all respects. That *should* be enough for CoastalWx, and Weatherwiz for that matter! LOL. Weatherwiz though w/ his uber level of excitement (exceeding CoastalWx I think now) will not be happy w/ anything less that 0SM TSGS+ SNOINCR 6 at his home!
-
If I repeated what has already been said, I apologize. I have not read every posts on this thread. Let CoastalWx-type weenie-ism do that!
-
Have to get this off my chest! There is a lot of talk going around comparing this to the Blizzard of '78 or "will be like" the Blizzard of '78. To deflate the senseless click-bait hype and assuage fears, it will not be anything like the Blizzard of '78 when looking at the entire picture, and the details count here as well! Both from a meteorological and non-meteorological standpoint, this imminent storm will not reach the legendary status of 1978. I can say that w/ high confidence. Why?, b/c when you know history and circumstances, not only for storms, but also how society has changed, the picture becomes clear. In this post, I will talk about the more obvious and straightforward, the non-meteorological parts/factors Preparations leading up to a storm are *everything*, or at least a lot more that many think, as to lessening overall impact. As I have said before, a disaster is typically only as bad as the preparations, or lack of, before it. This does not mean very high impact still does not occur, but so much "bad" is averted or mitigated. The forecasts for the Blizzard of '78 were not that good overall, so many from the individual to local/state agencies were not prepared. This almost never happens anymore for storms, certainly not for the really big and high-end ones, and the science of forecasting and modelling have improved immensely over time. And the way we get information has also dramatically changed, so it is very hard *not* to know what is going on w/ the weather now. Yes, it has gone the other way w/ *too* much hype for every single event, no matter how small or typical, and that has its own share of issues, but we are hardly ever "caught by surprise," at least for big winter storms. So something like the Blizzard of '78 Rt 128 disaster w/ 1000s of ppl stuck and cars stranded resulting in the highway closed for a week, simply cannot happen now. Ppl know to stay off the roads and businesses closed down for the storm, so the road crews can do their job. So from what I said above, physically that made the Blizzard of '78 much worse, and also psychologically was huge b/c witnessing the region paralyzed like that is an unsettling thought, to say the least! Another aspect, snow removal has evolved over the decades, and we are much better at it. From better chemicals to put down on the road to the actual snow removal equipment itself to how it is all coordinated. We learned a lot from the Blizzard of '78 and many other blockbuster snowstorms since then, and that's a good thing! There are a lot more private contractors plowing now than 50 years ago, and things like those little Bobcat front-end loaders are ubiquitous now. Didn't see those much in the region through the 1980s for snow removal. Snow removal has become big business! And the general population knows ahead of time what is coming, so the shock and awe factor is much less. Ppl change their plans, stock up on supplies, and think of various contingencies, like if power goes out. This smooths out the impact of the storm psychologically, and again, that is a good thing!
-
No trees left in GHG after this!?
-
-
I bet CoastalWx had to go to the emergency room so he could get "calmed down!"
-
I don't think CoastalWx could handle that!!! LOL. Too much PT at once!
-
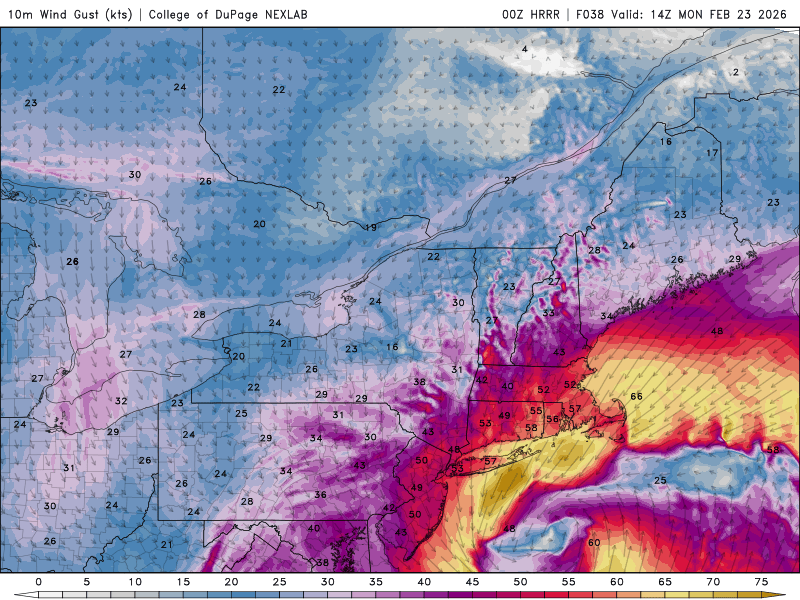
I don't think I have ever seen the HRRR this nuts w/ winds gusts this high over such a large area. Huge area of 65 kt + gusts. And you look how far NW the sfc freezing line gets (makes it to Weymouth), Some serious damage from wet paste S of BOS. I envision CoastalWx losing power or internet for an extended period. What will he do? Can't go the library b/c it will be closed! He'll have to drive around w/ his PC running in his car to find a WiFi hotspot! What about 5G? One thing I have found during big snowstorms, cell networks get extra taxed and way slow at times. And cell towers need power as well. Time to pull out a Telebit 56k modem for dial-up?!
-
Burlington the next town over from Woburn, so makes sense that total.
-
40" was common in eastern MA and RI, just did not have the degree of spotter/co-op observers back them. A fairly reliable measurement from someone I know got about 44" total in an open field in Woburn MA. Given the how the area between 128-495 NW of BOS tends to have a local precip max in many nor'easters, this is not unreasonable.
-
20" or more in single snowstorm in the Pioneer Valley is big, considering they get precip shadowed a lot!
-
-
I recall that well. OKX NWS explicitly forecast 24-36" for NYC, an all-time record snowfall. Even close to the event, there was not good agreement for that kind of snow for NYC, yet they bought the ECMWF completely (surprise, surprise), and it was massive fail. Yes, up to a foot fell in NYC, but the psychological impact alone of forecasting 24-36" for NYC is immense, and you simply do not do that unless you have a damn good reason to do so. And was forecasting a more modest 12-24" so hard? That still is a blockbuster for NYC and same preparations would be made. If it ends up more, so what? You end up looking better in the end.
-
The UA pattern is nothing even close to Feb 1978 for this event. The 500 evolution for for the Blizzard of 78 was extraordinary, unlike any other in the KU cases. You not only had a large cut-off low stall S of New England, but actually had a cut-off high at 500 form over western Canada at the same time. No other E Coast snowstorm case has this kind of evolution. And the Blizzard of 78 was a solid Miller B w/ a strong clipper system diving SE from the Great Lakes, and a secondary that formed N of the Bahamas. This one is a hybrid A-B it seems w/ a complex 500 pattern. No polar jet at all involved here. Much more progressive pattern for this upcoming storm. After the Blizzard of 78, that was it for the month for any sig precip in New England. Pattern become blocked.
-
Given the big winds forecast for this upcoming storm, some points of reference for winds for the region's biggest non-tropical storms, at least in recent decades. This is not all-inclusive, just what I recall off-hand. One note on the data, standard wind measurements are typically taken w/ the anemometer 10 m (33 ft) above the ground. That's how it is at airports for official NWS/FAA observations. However, at many other wx stations, such as NWS/NOS/privately-run marine sites or personal wx stations, the heights can vary a lot. Obviously, the higher the anemometer elevation from ground level, the higher the winds. The highest recorded gust I know of in the last 50 years at an official NWS/FAA site is 108 mph at the Blue Hill Observatory (MQE) on 3/29/1984. A gust of 97 mph was recorded on Martha's Vineyard in this storm. Truro MA gusted to 113 mph on 10/21/2021. 110 mph gust at Scituate MA 2/6/1978. Highest gust recorded at an NWS/FAA location for this storm was 93 mph at Chatham MA (CHH). Block Island gusted to 105 mph on 12/5/2005. A gust to 101 mph occurred at Wellfleet MA from this same storm. A gust to 97 mph at Falmouth MA (FMH) occurred on 4/19/1997. Seabrook NH gusted to 94 mph 2/25/2010. On this same day, Isles of Shoals (IOSN3) gusted to 91 mph. For BOS, the highest gust recorded for any type of storm since 1954 is 81 mph on 3/13/1993. BOS gusted to 79 mph on 2/6/1978 and 78 mph on 12/11/1992. PWM highest gust on record (since 1940) was set on 2/25/2010 w/ 78 mph, but it may have been higher since there was a power failure. Going back to the late 19th century, the greatest non-hurricane storm w/ the highest winds was "The Great Appalachian Storm" Nov 24-26, 1950. This was an inside runner for New England, so extraordinarily strong southerly winds occurred. What was most remarkable was the gust to 110 mph at Concord NH. Hartford CT had sustained winds of 70 mph w/ a peak gust of 100 mph. Such high wind values are exceptional for inland locations that are not elevated!
-
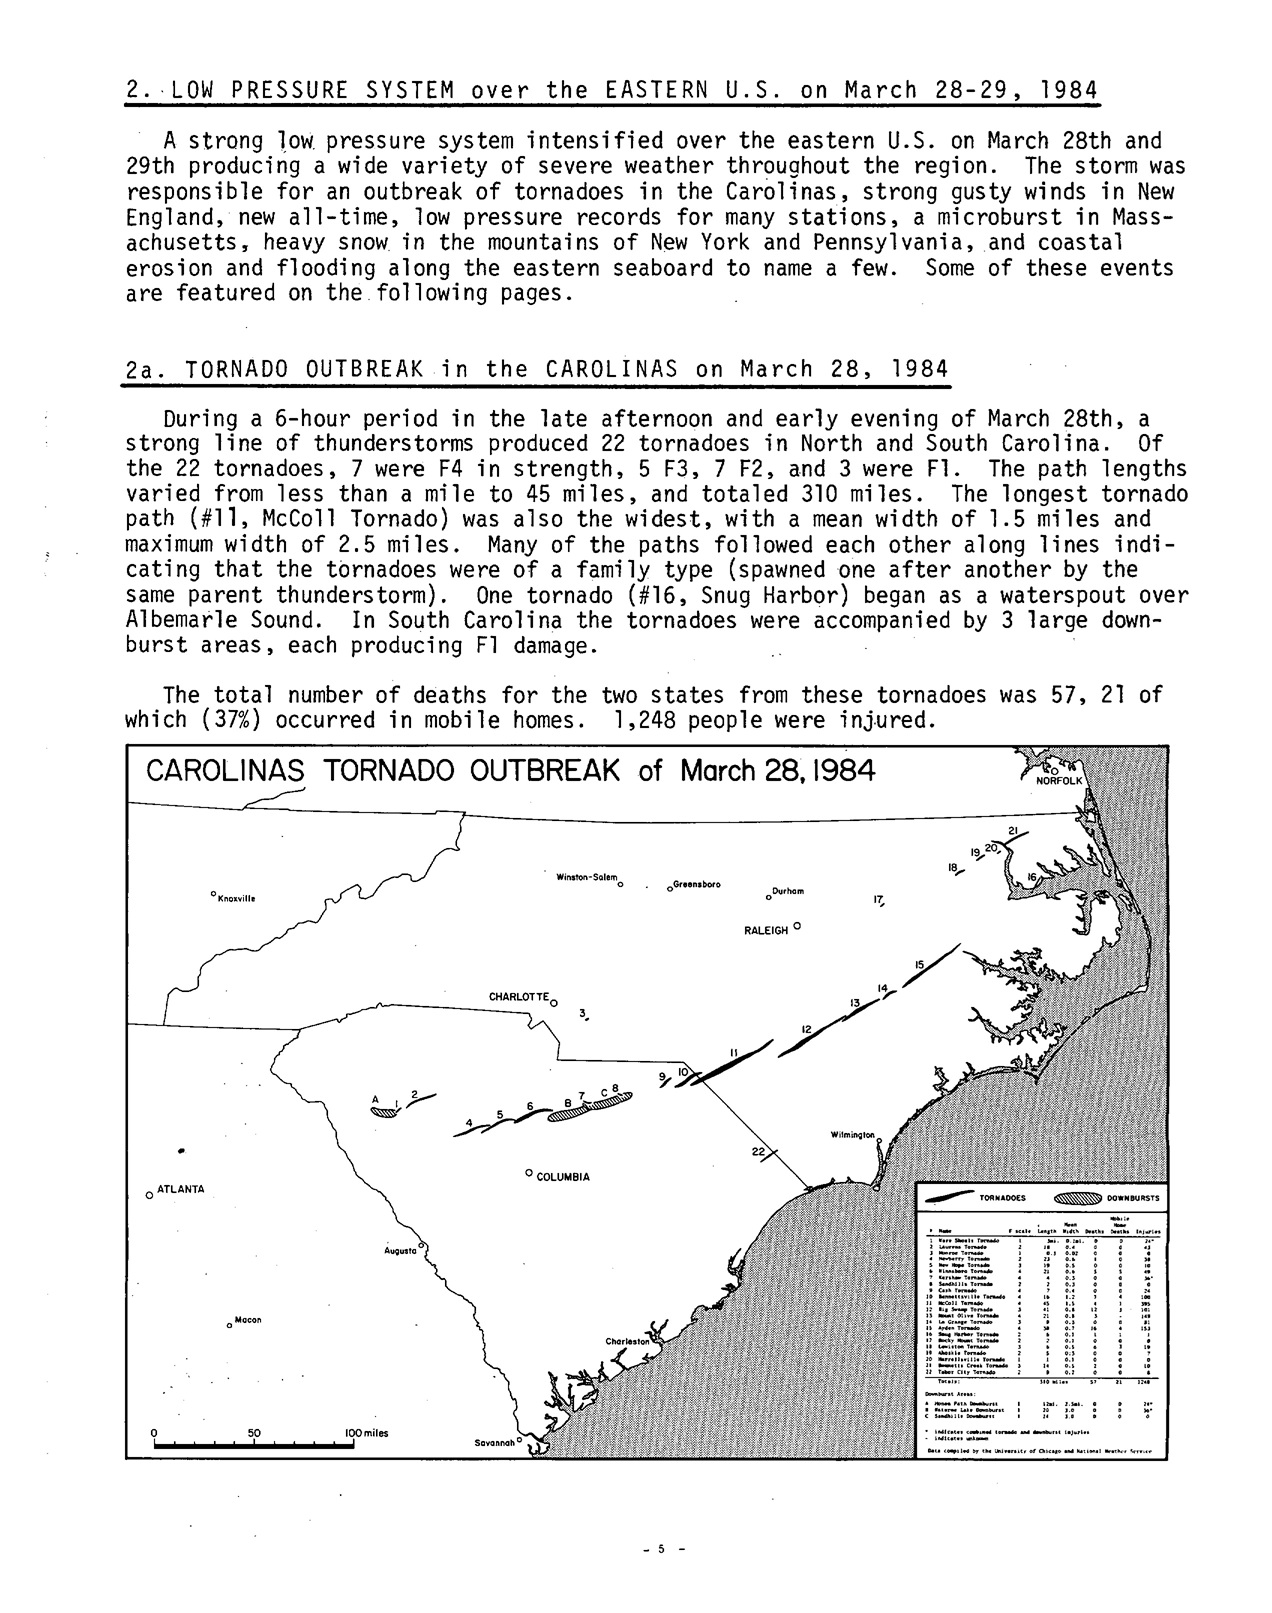
That was 3/27-29/1984. That storm across much of the South and East Coast was in a class by itself. 963 mb E of the Delmarva and G108mph at Blue Hill. Paste blizzard here w/ massive tree damage and power outages. Carolina tor outbreak its worst on record. One tor was 2.5 mi wide. A single supercell product 7 F4 tors, the record for most F4s from a single storm.
-
Bliz of 05 CoastalWx MAN stuff! LOL.
-
And how about this? Look at the DY2 SPC tstm outlook. How often do you see such a large area of general tstms outlooked on the COLD side coastal storm, never mind a full-fledged blizzard???? I can't recall such a large general tstm area for a KU! But if anyone knows something similar, please post!
-
One thing to keep in mind overall though. There have been a number of coastal storms since the Bliz of 78 w/ high-low pressure differences greater, and they were *not* anything like the Bliz of 78 for total snowfall or max wind gusts, so pressure difference alone does not tell the entire story. Still though, this will be a high-end event and I would not be surprised to see gusts 80-90 mph on the coast from the Delmarva to BOS.
-
Excellent observation. I did not even notice the strength of the high in this case. So that's 82 mb difference. Bliz of 78 was 64 mb. So for winds, this is of grave concern IMHO.