
Henry's Weather
-
Posts
1,479 -
Joined
-
Last visited
Content Type
Profiles
Blogs
Forums
American Weather
Media Demo
Store
Gallery
Posts posted by Henry's Weather
-
-
Check out this fetch... I mean, this looks quite good for significant weather.
-
1 minute ago, Typhoon Tip said:
Guys... the NAM has a consummate NW placement, and amplitude bias, at any range beyond 48 hours.
While taking this into consideration of course
-
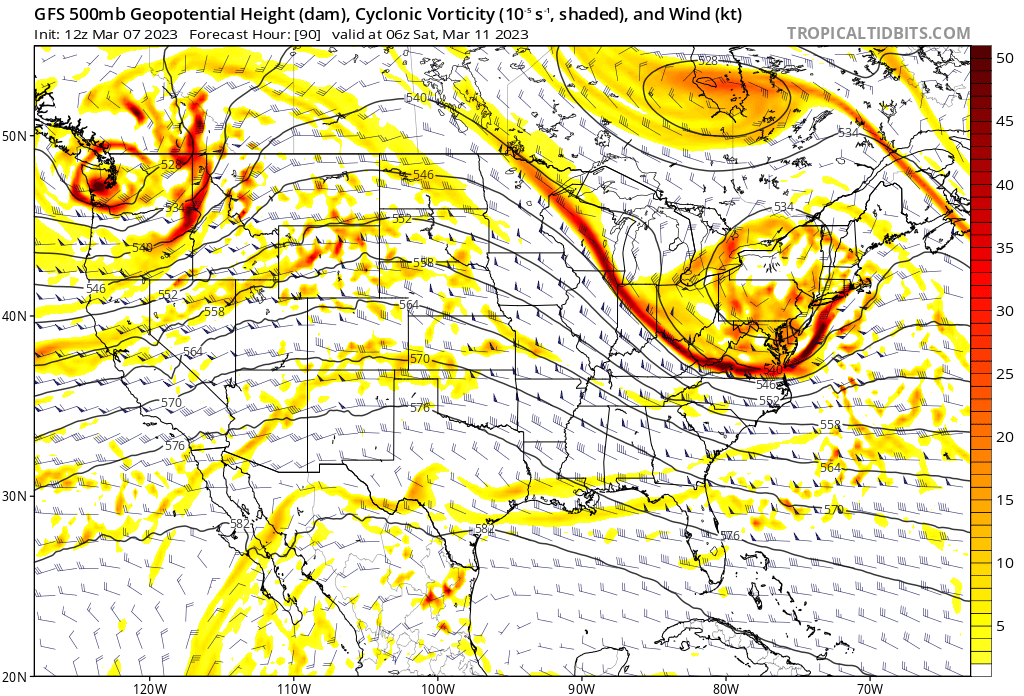
Notice the difference in presence of polar lobe. Could make a large sensible WX difference


-
18z NAM has a far healthier H5 shortwave and downstream heights structure (peeling upward) than 12z GFS does, whose paltry QPF printout still leaves me quite stumped.
-
Just now, Typhoon Tip said:
QPF means Quantitative Precipitation Forecast ...
So, for in the case of that chart, probably there's heavy rain and/or snow associated with that look
I understood what QPF meant... i was curious about whether you meant anomalous for the type of look (less than one would expect due to thermal prof.), or anomalous in general (compared to climo instantaneous norms). More specifically, my question was about the apparent descrepancy between favorable upper-level charts and unfavorable low-level ones
-
-
18z NAM (I know...) looks like it could be pretty potent. Stronger SW and PV lobe seems further north.
-
1 minute ago, Typhoon Tip said:
I'm not Will and I realize you are not asking me ... but, we don't know anything about the thermal profile in that cinema there, for one.
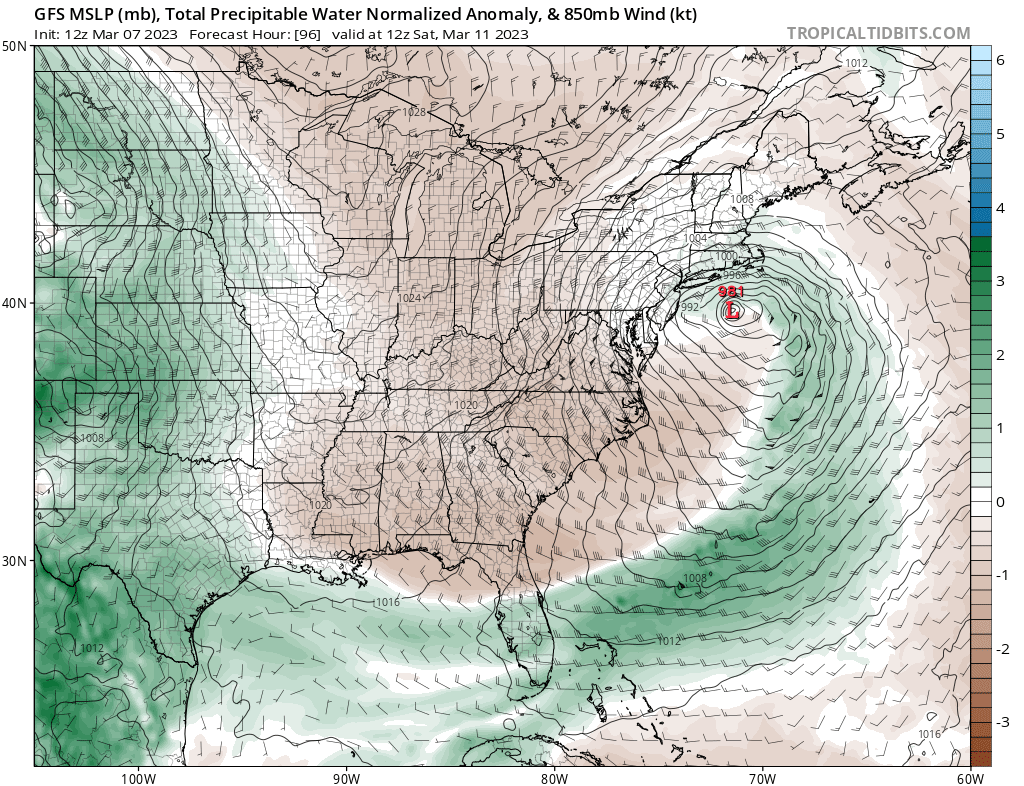
But yeah...otherwise, you have a nice easterly anomaly over the top of a closed 700 mb circulation envelope. SO, barring warmth wrapping around and the CCB not displaced NW or weirdness...
It is at minimum a QPF anomaly regardless of what is actually falling.
What do you mean by QPF anomaly?
-
5 minutes ago, Henry's Weather said:
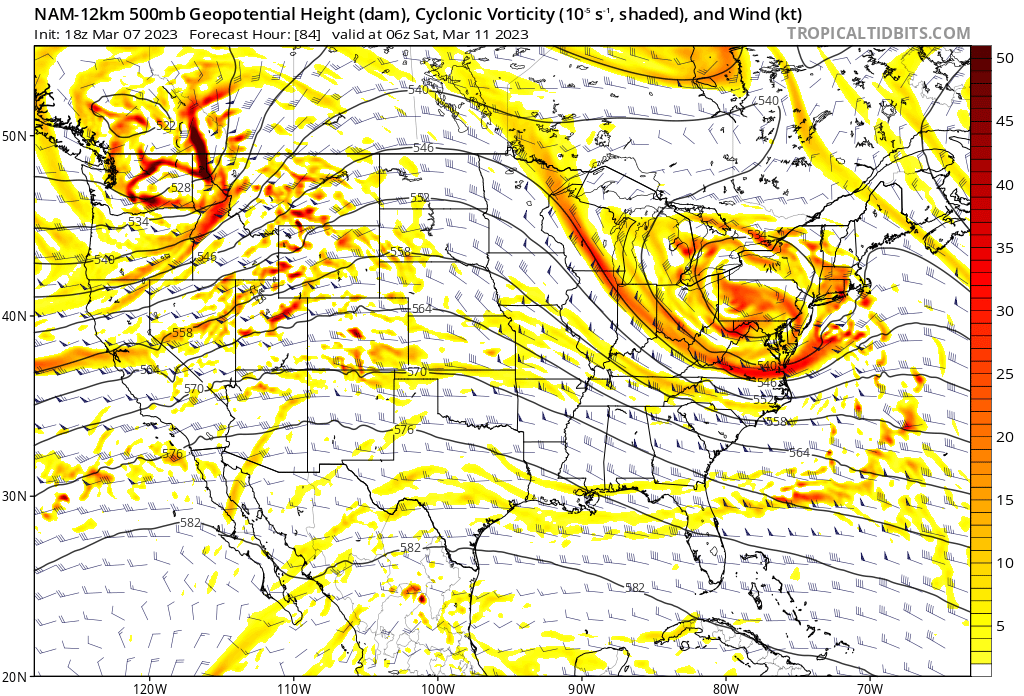
Not to break the flow of the debate here, but does someone mind explaining to me how this progression is not verbatim snowstorm across SNE?
@ORH_wxman in particular, I'm curious about your opinion
-
In other words, if we were only forecastint based off of H5, H7, and H85, would we call this a near miss?
-
Not to break the flow of the debate here, but does someone mind explaining to me how this progression is not verbatim snowstorm across SNE?
-
"The perfect storm at day 7 hasn't been reproduced in the past few hours! How could this happen? Who could see this coming?"
Might be falling on deaf ears, but its same same. Damn. Playbook. Every time. I guess people like the ups and downs? Or they truly just can't see or understand that most modeled snowstorms don't come true.
If it happens, cool. **It looks like a conducive synoptic-scale pattern for a chance of snow.** Maybe this is like telling people to not be heartbroken over sports since they don't matter.
-
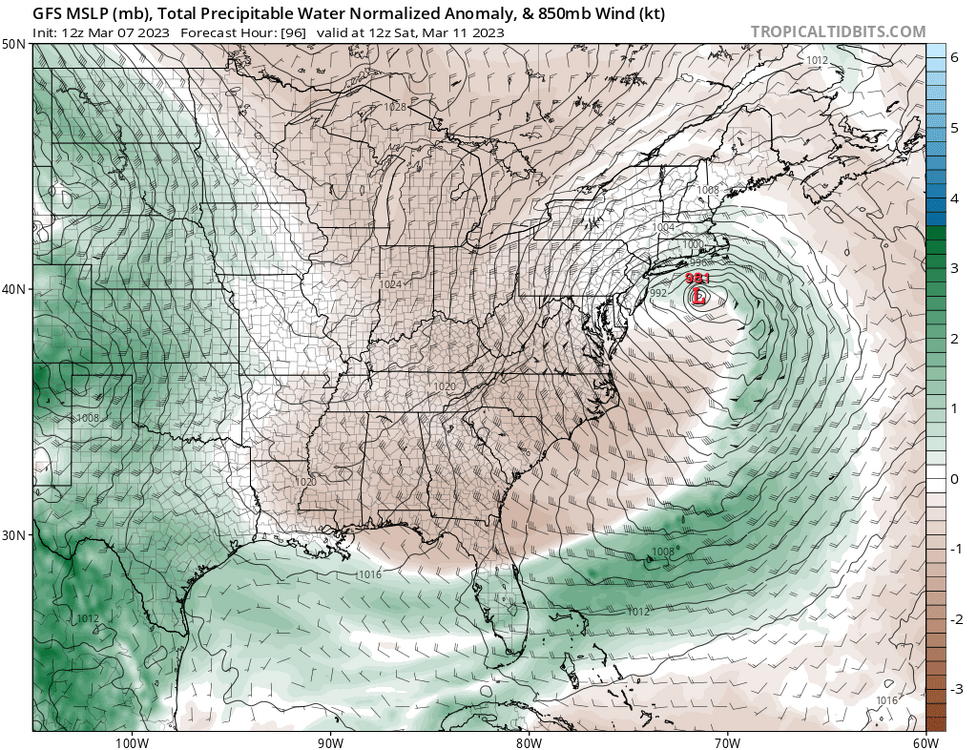
Sub 990 on the benchmark, pretty good
-
 2
2
-
-
Imagine if 0z hadn't been a HECS. I'll take it!

-
2
-
-
2 minutes ago, Typhoon Tip said:
I've often thought that would be a neat study...yeah. H. Archembault's papers/thesis work in the mid 1990s is the closest to that, but it doesn't go as deep, not parsing out the PNA's spacial and temporal magnitudes wrt to what storm events were observed - that kind of minute scale.
Like a study that says, say, ' therefore 90% of 8" snowfalls took place between a +.7 and +.9 standard deviation +PNA' as an example?
that would be interesting. Then, if you make that a three-way between the NAO and EPO ... the intersections would also be interesting. In general, though... most people with a-priori in the field know that at a baser level, changing index modes are correlative. I guess in a purer practical sense, does it really offer much more to have some series of algorithms that says 8" correlates in this x-y-z nexus of teleconnector convergence? Most of which is intuitive.
My main research interest would be deltaSD case studies. "In the 5 day period surrounding a +-1 flux in PNA or NAO, how often does significant east coast cyclogenesis occur?" Or something like that
-
2 minutes ago, tavwtby said:
that hurts...see what I did there
That superbowl was made crap by that final call... unfortunate
-
1
-
 1
1
-
-
52 minutes ago, Typhoon Tip said:
Hugely agree there ( bold)...As I was just expressing to OceanStWx ( Eric? I think it is -), I feel the primary sensitivity more relates to that handling. there is a change in the larger scaled wave exertion arriving from the d(PNA).
when have the models ever been extraordinarily clever when it comes to handling a mode shift.
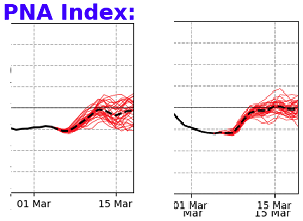 ....this is yesterday(left) vs last night's(right) PNA ...it is showing both d(PNA) and +d(trend)
This event really is an Archembault, ( after that research related to statistical correlations with indexes and higher scaling precipitation events over eastern N/A) recovery ordeal. That is a total 1 standard deviation rise over a short span of time, with a mass-field that is HUGE - sufficiently large in both respects, a major player is an entirely acceptable assumption. Adding in the west <-- fading black through central Canada, supplies a wave spacing negative geopotential anomaly argument right near WV give or take... so this all just timing perfectly, that a west eject trough would pass through that constructive interference region over eastern mid latitudes.
That's what these telecons illustrate, without the actual advent showing up ( very well ...I'm not sure what the immediate recent runs look like - but given the din in here, the UKMET and may be ? ) ... just yet.
This is a really great find. It's best to train our minds on the boundary parameters that "create the box" where an event can take place, rather than focus on the ultimate final product of all the various parts interacting in high resolution.
Ie: at day 7, tracking ensemble telleconnector flux is the most prudent deployment of our attention if we wish to keep expectations in check, while also tracking meaningful ensemble trends. We can get away from the flashy colors and towards the overarching mechanism.
I'm sure someone can use the magnitude of telleconnector flux for the three principle domains to find "magnitude" analogs, even if they aren't necessarily perfect structural analogs.
-
1 minute ago, weathafella said:
That excludes the next 24 hours. Qpf and snow map below…
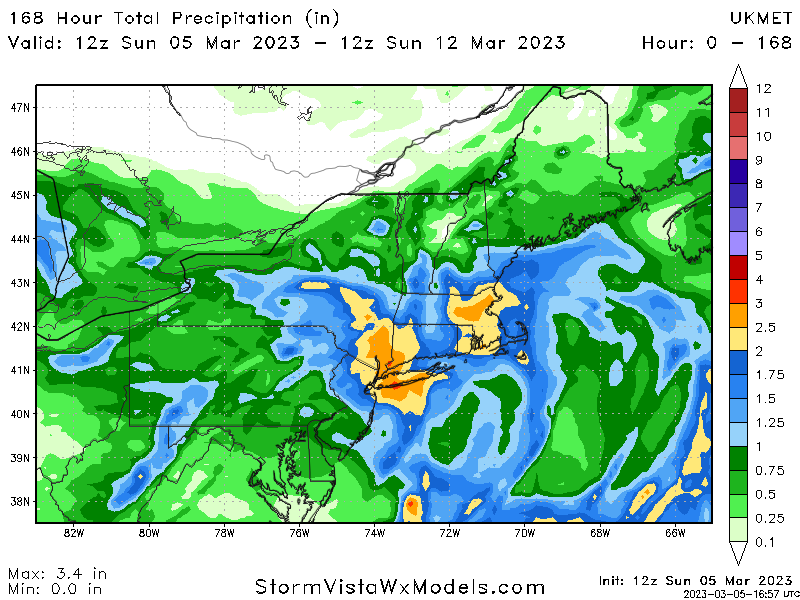
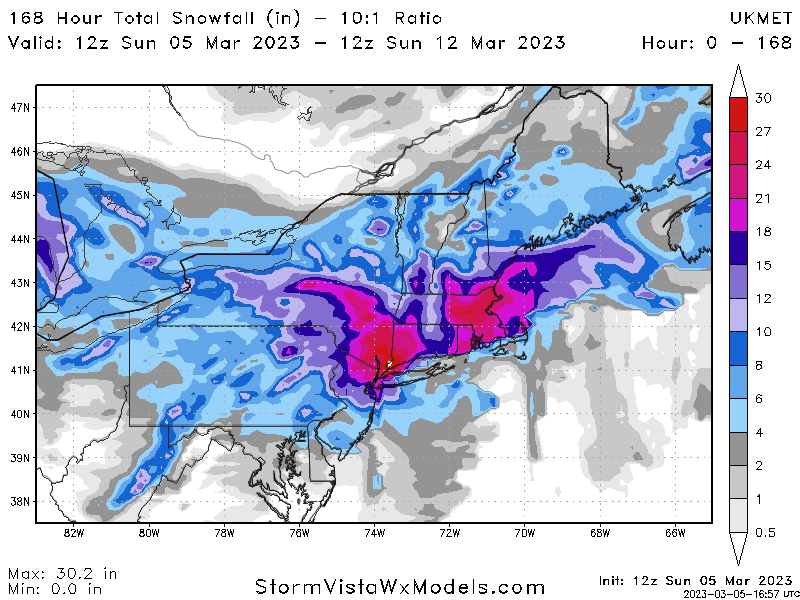
Wow
-
1
-
-
We should go in to the 12z euro watch party knowing that most likely, the verbatim output will not be as sexy as 0z. We should focus on ensembles this far out, and not live and die by vicissitudes.
Signed,
Someone who can lose serious sleep over storms modeled a week in advance (see March 2017)
-
9 minutes ago, The 4 Seasons said:
Scenario 3:
Model locks onto storm at D7. Stays the same or slightly better for a while then. Rug pull.
Here's a zoomed in view of the EPS. Some really psychotic members in there. 49 south of LI?

Scenario 3 stills falls into scenario 2
")
-
Remember folks, there are only 2 ways for this to pan out.
Scenario 1:
Model locks onto it at 7 days. Starts to look worse. Gets better. Have storm.
Scenario 2:
Model locks onto storm at D7. Starts to look worse. Don't have storm.
-
7
-
-
5 minutes ago, 40/70 Benchmark said:
Dipole is a great way to describe it. Not sure if that's standars practice
-
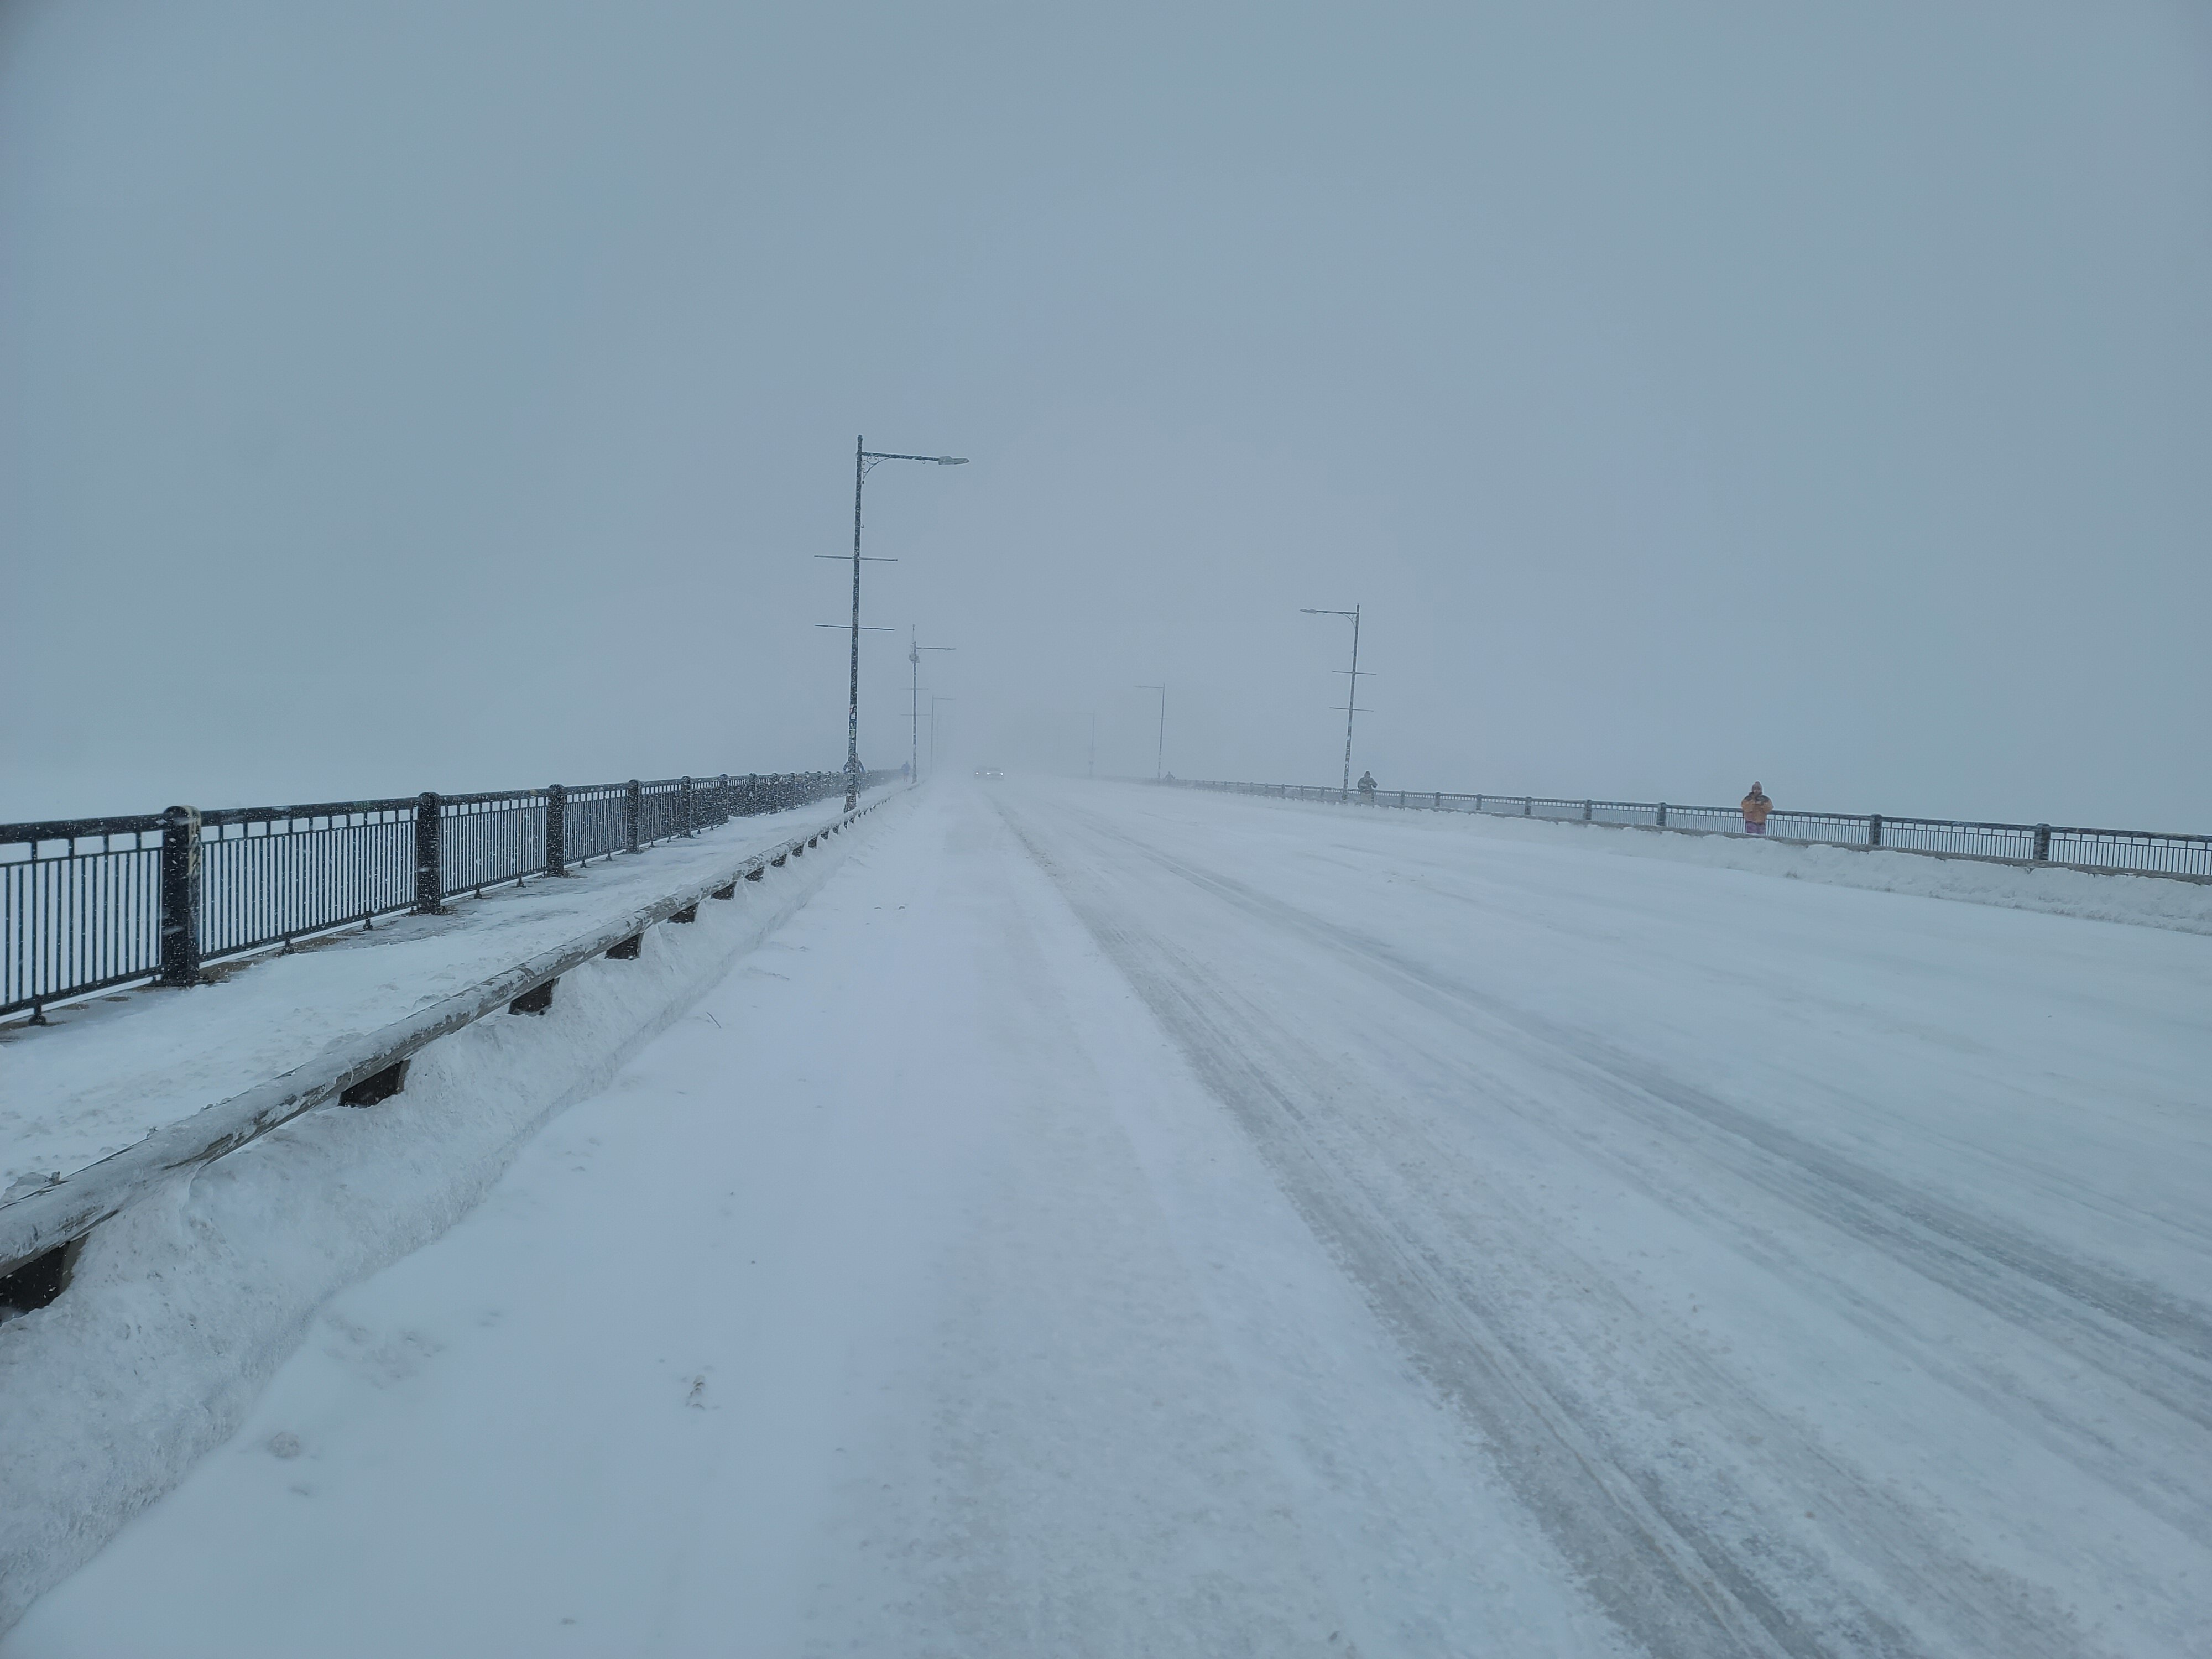
Zr in Hyde Park
-
Thumping here in Hyde Park


Impressive signal is just beginning emerge in actual guidance, Mar 10 -15th...
in New England
Posted
Look at the dance between polar and mid-level lobes