MAG5035
-
Posts
6,078 -
Joined
-
Last visited
Content Type
Profiles
Blogs
Forums
American Weather
Media Demo
Store
Gallery
Everything posted by MAG5035
-
Central PA 2020 Fall - The Hope begins
MAG5035 replied to paweather's topic in Upstate New York/Pennsylvania
I pulled my window AC's for the winter a couple weeks ago when we were getting morning frost on the daily. Kinda regretting that yesterday and today lol. Also, how about the 12z GFS ftw with the wintry Halloween in the central counties? It even snows in Bradford with the Tuesday wave of precip. Probably pressing cold too much, but everything's been showing a major battleground temp-wise. The -NAO period we had didn't stick for long, and we're working a -PNA (ridge axis off the Pac coast).. thus the eastern ridging and not much press southeastward of what is some pretty wintry stuff in the north-central... soon to be diving even deeper in the central US. Models seem to differ a good bit in pattern progression later next week, so that will be something to watch. Winter's not too far off. -
Central PA 2020 Fall - The Hope begins
MAG5035 replied to paweather's topic in Upstate New York/Pennsylvania
Looks like meso obs around here were 29° for a low this morning in town. Probably some mid 20s in the cold valley spots outside of town. Saw Bradford got to 21°. -
Central PA 2020 Fall - The Hope begins
MAG5035 replied to paweather's topic in Upstate New York/Pennsylvania
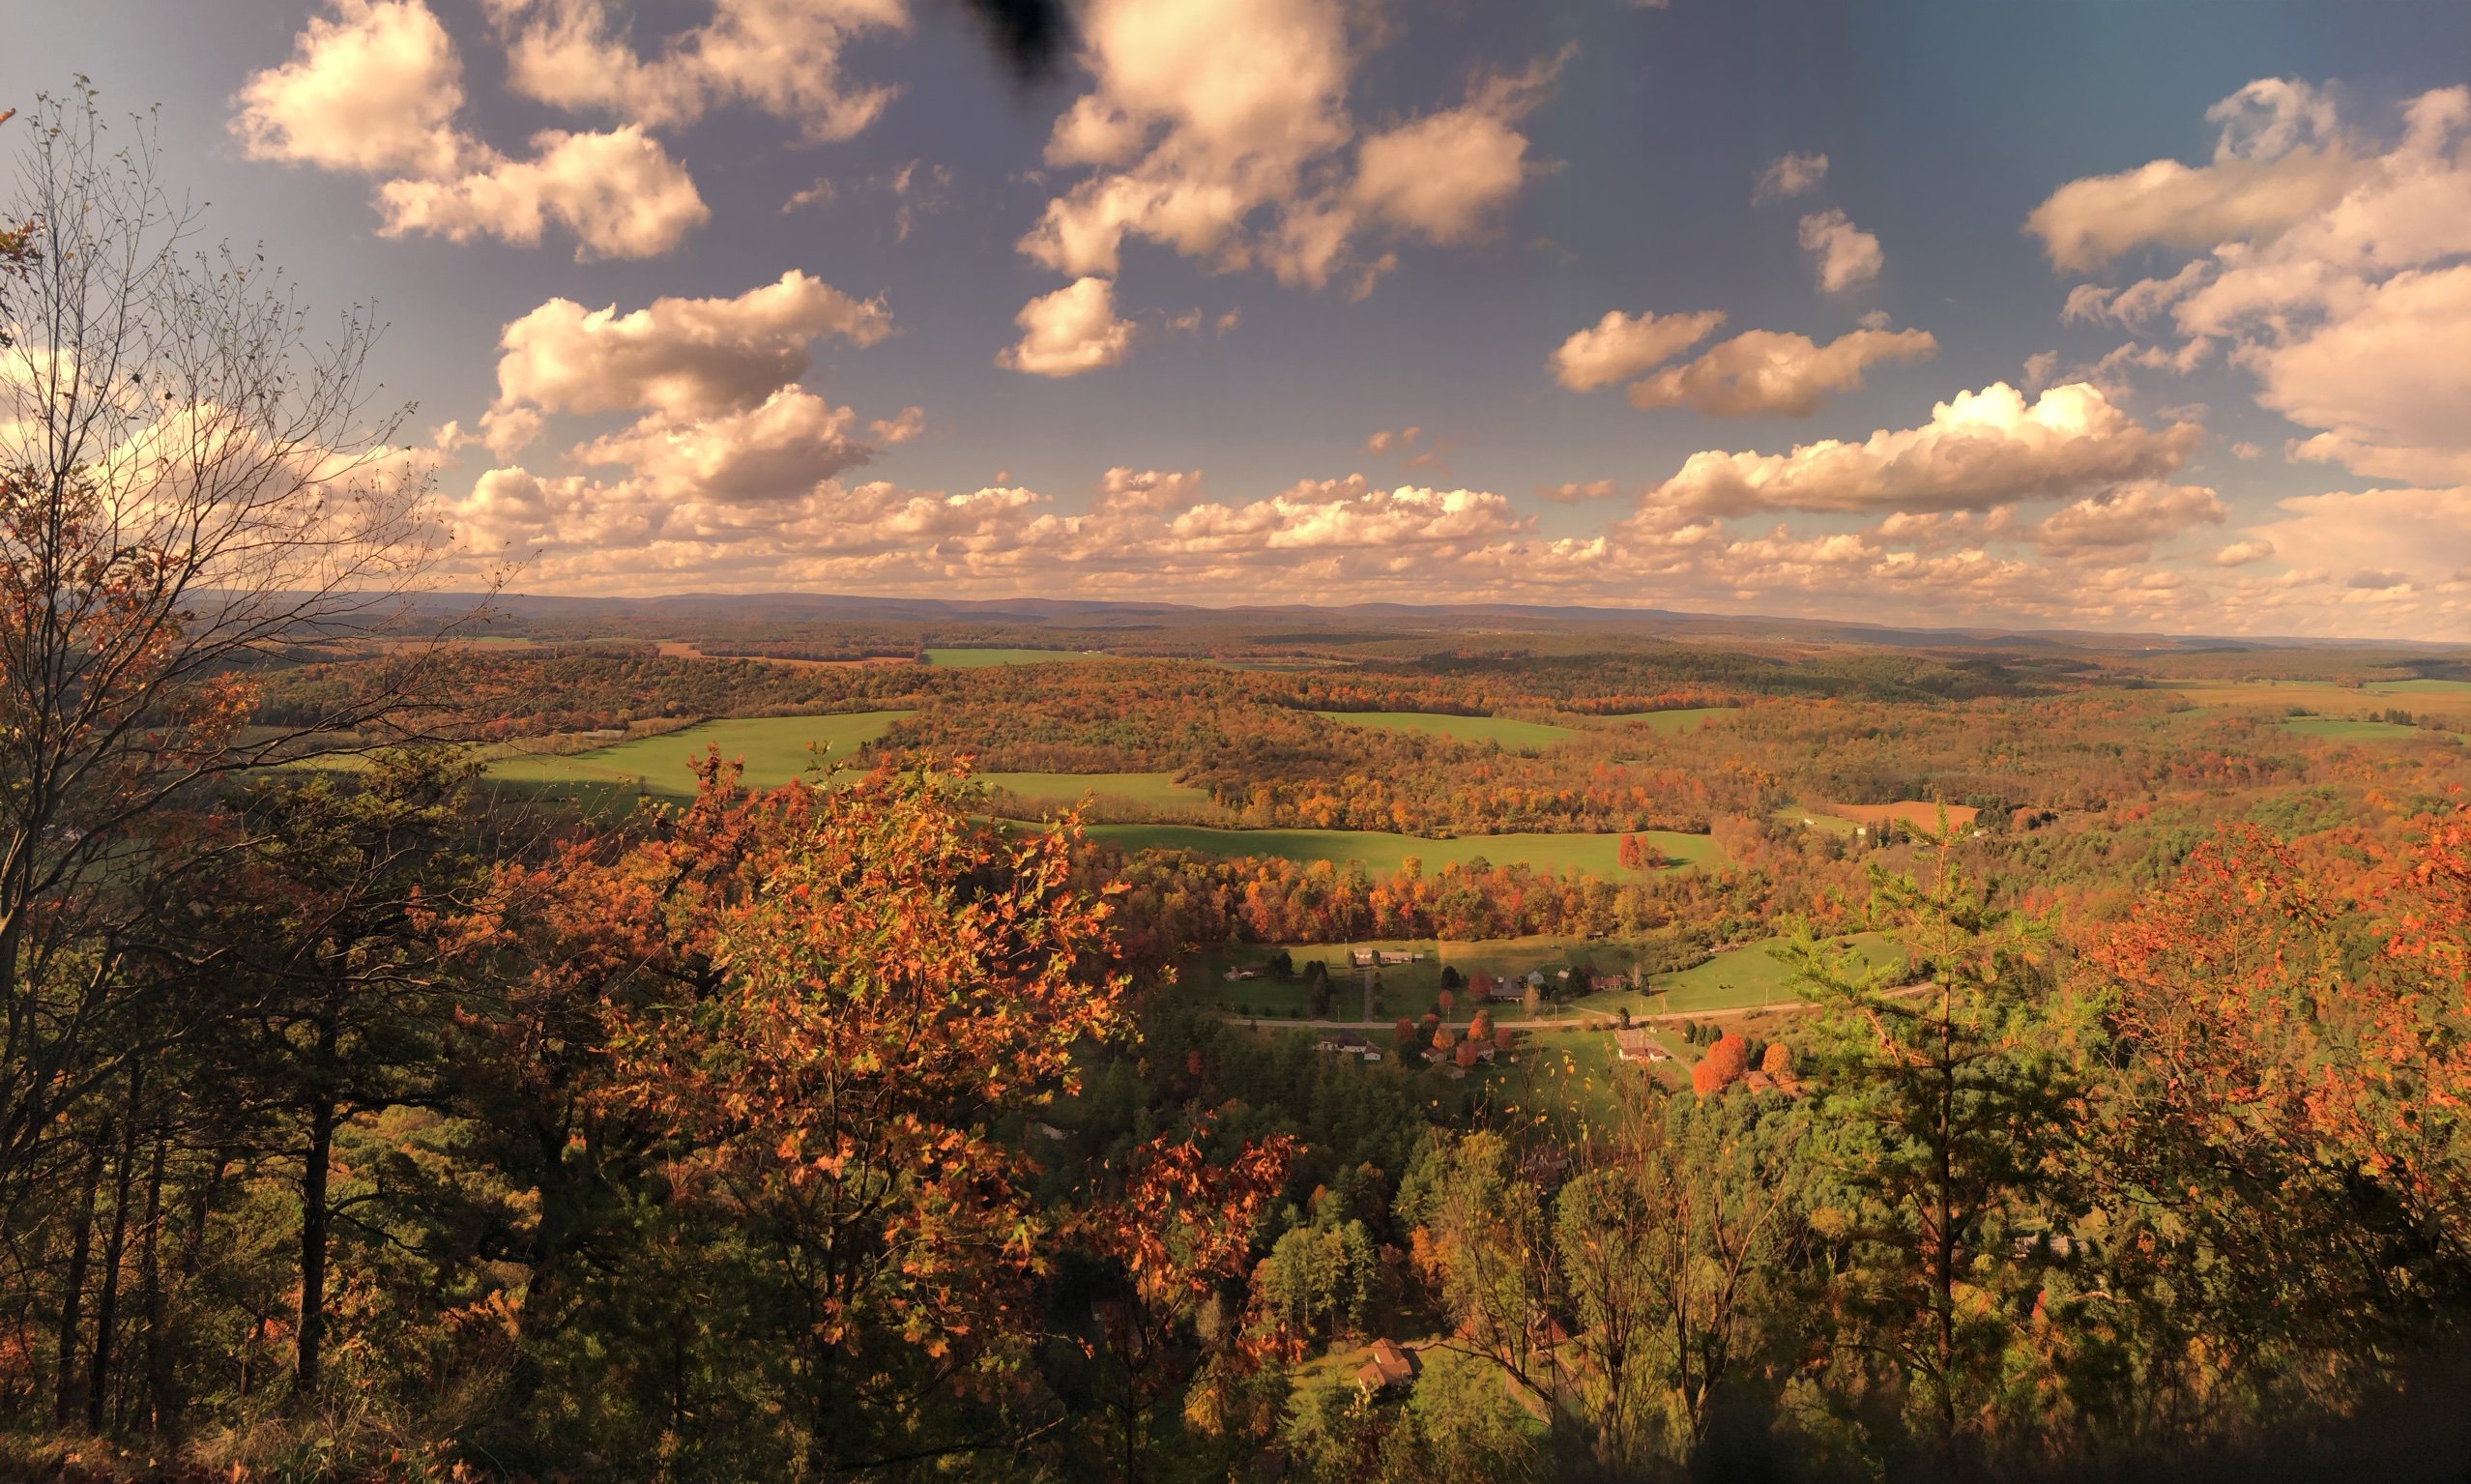
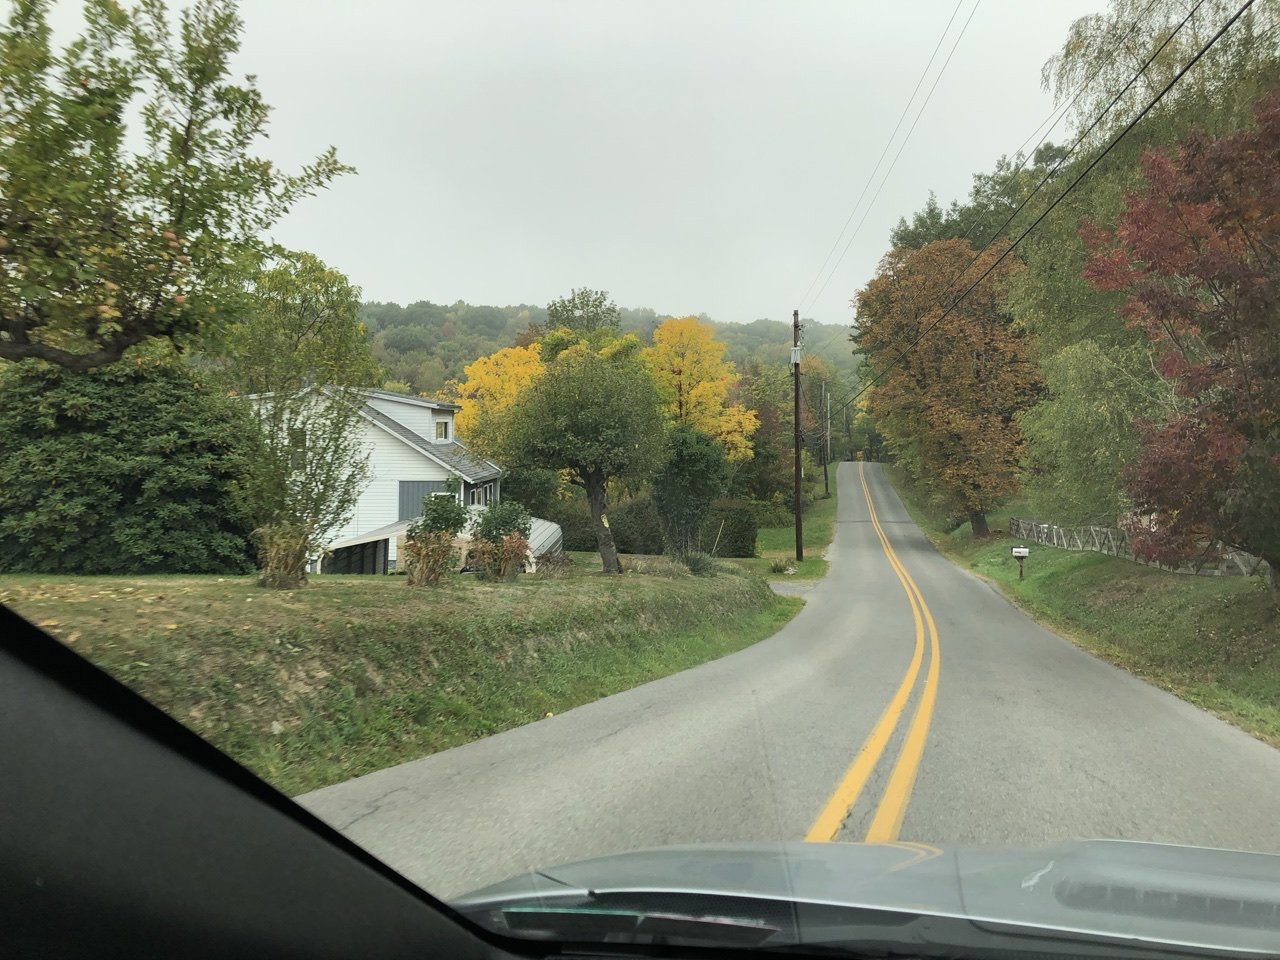
The sun managed to come out in the mid- late afternoon around here. Looking a bit past peak now but still some good color on the foliage.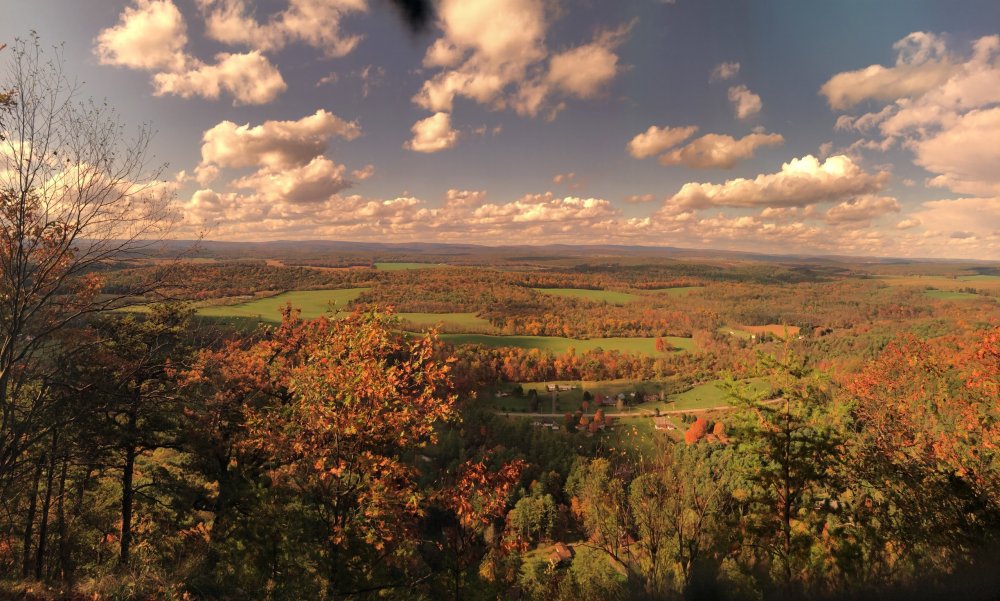
-
Central PA 2020 Fall - The Hope begins
MAG5035 replied to paweather's topic in Upstate New York/Pennsylvania
Settled into a pretty decent steady rain here as precip has finally blossomed. Short/near term guidance doesn't seem to be seeing the heavy band in the Laurels and steady precip in the adjacent counties (AOO-UNV corridor) very well. Probably some pretty heavy rain under that area in Somerset County aided with the S/SE flow upsloping into the ridges and some of this enhancement may work into the ridge and valley region overnight I-80 south into the Sus Valley. Still doesn't look like the LSV sees the widespread 2"+ type deal that seemed like a certainty but should still generally see 0.5-1.0" with some higher amounts in spots. Unfortunately for our north-central, the heavier rain doesn't look interested in making much press above I-80... with some lighter rainfall instead. Once to the US 6 corridor in the central, there might be little if any rain. -
Central PA 2020 Fall - The Hope begins
MAG5035 replied to paweather's topic in Upstate New York/Pennsylvania
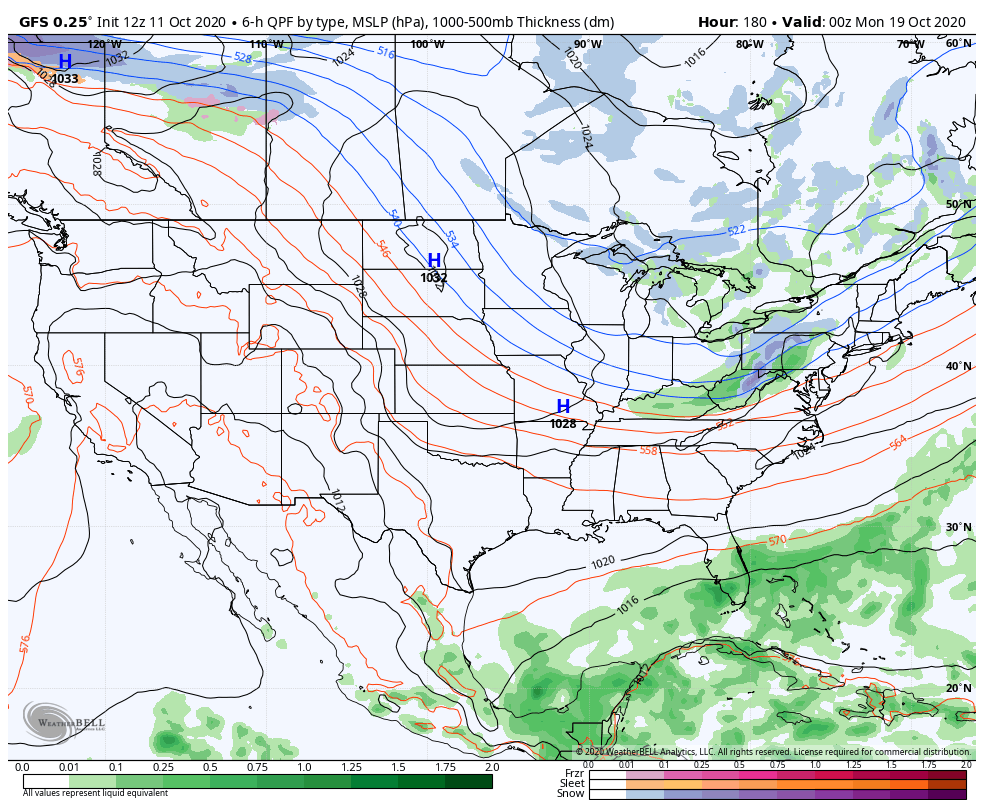
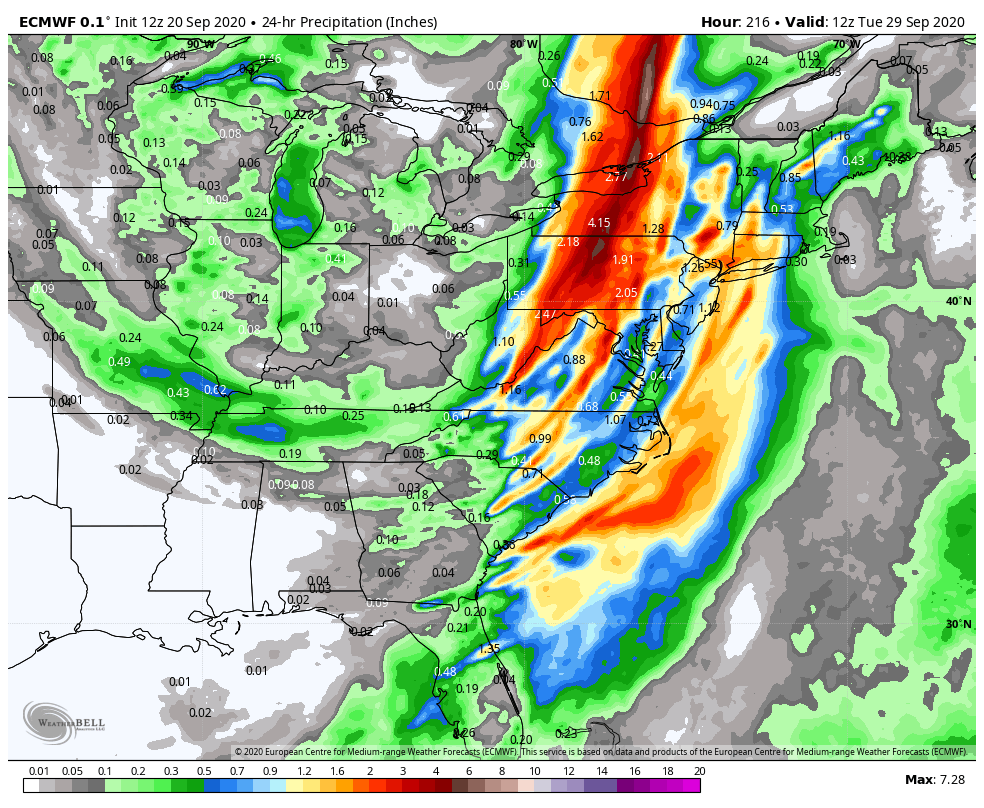
The Sus Valley and most of the southern tier look okay for this event but that north central portion of PA in the D2 drought area aren't looking all that great for getting the type of rainfall that is really needed there after pretty much the whole area had looked pretty good for a region wide 1-2" rainfall a few days ago. 12z GFS/Euro darn near take PIttburgh and SWPA out of the whole thing and really reduces the central (JST/AOO/UNV). Given radar trends of the initial rainfall edging toward the mason-dixon line, I'd say that's a bit extreme as Pitt and central region should get into that eventually this eve. Really don't know what to think of the globals really pushing southeast with this. They could be lowballing some considering what should be high PWATs/very efficient rainfall via tropical connection (Delta remnants) and a nice Atlantic easterly fetch via a 1030ish high setting up to our north. I think everyone in the region will see rain, it's just a matter of how much and how far into central PA some of the more soaking rain gets. Having discussed the event at hand, I'd like to throw out some thoughts about the pattern we're about to get into and some winter thoughts/concerns. The NAO/AO is heading solidly negative in the D6-10 and possibly staying there for a time. The mid into late month period def looks to favor below average, with today's GFS looking more like mid-late November on D6-10. A pattern like that has been at a premium the last few years, so seeing it emerge in mid-October is fairly encouraging for possibly seeing this regime show up once we get into the winter. When I posted in August some really early thoughts on the upcoming winter, my concern was not so much whether or not the cold will be around but moisture and that thinking hasn't changed. We're seeing the continuation of an overall dry regime getting deep into the fall now, with this current event being of a tropical origin and not a typical mid-latitude cyclone. ENSO is looking like it's going to be a player as we have a pretty solid La Nina going, with last weeks number at -1.1ºC in Nino 3.4. Typical Nina pattern favors a northern branch storm track over Pac NW with limited southern stream influence (dry California coast). With the base setup like that, downstream blocking via the NAO becomes more important than usual to anchor an eastern trough and to capitalize on more limited opportunities for phasing a coastal. Generally, I expect our winter events to be northern branch heavy this season.. but if we have a good pattern alignment we can put together some solid events (4-6" type) and clippers which pretty much didn't exist in our region last winter. I don't usually put together an outlook but I'll throw out that I think snowfall will be in the 75-100% of average range, with the Laurels perhaps having the best opportunity for an average season with what I see is a better season than the last few for LES/upslope in that region. Now this could be worse if we get into a Nina type setup that drives a lot of eastern ridging (dominant MJO 4-5-6, for example), but either way this season will likely be a lot better compared to pretty much a rock bottom winter last year. There's also the 95-96 option on the table if we do lock in an extended -NAO/-AO during the front half of the winter. Think winter's still far off? This was the GFS hr 180 today.
-
Central PA 2020 Fall - The Hope begins
MAG5035 replied to paweather's topic in Upstate New York/Pennsylvania
I managed to watch about 10-15 minutes of it.. couldn't hang. -
Central PA 2020 Fall - The Hope begins
MAG5035 replied to paweather's topic in Upstate New York/Pennsylvania
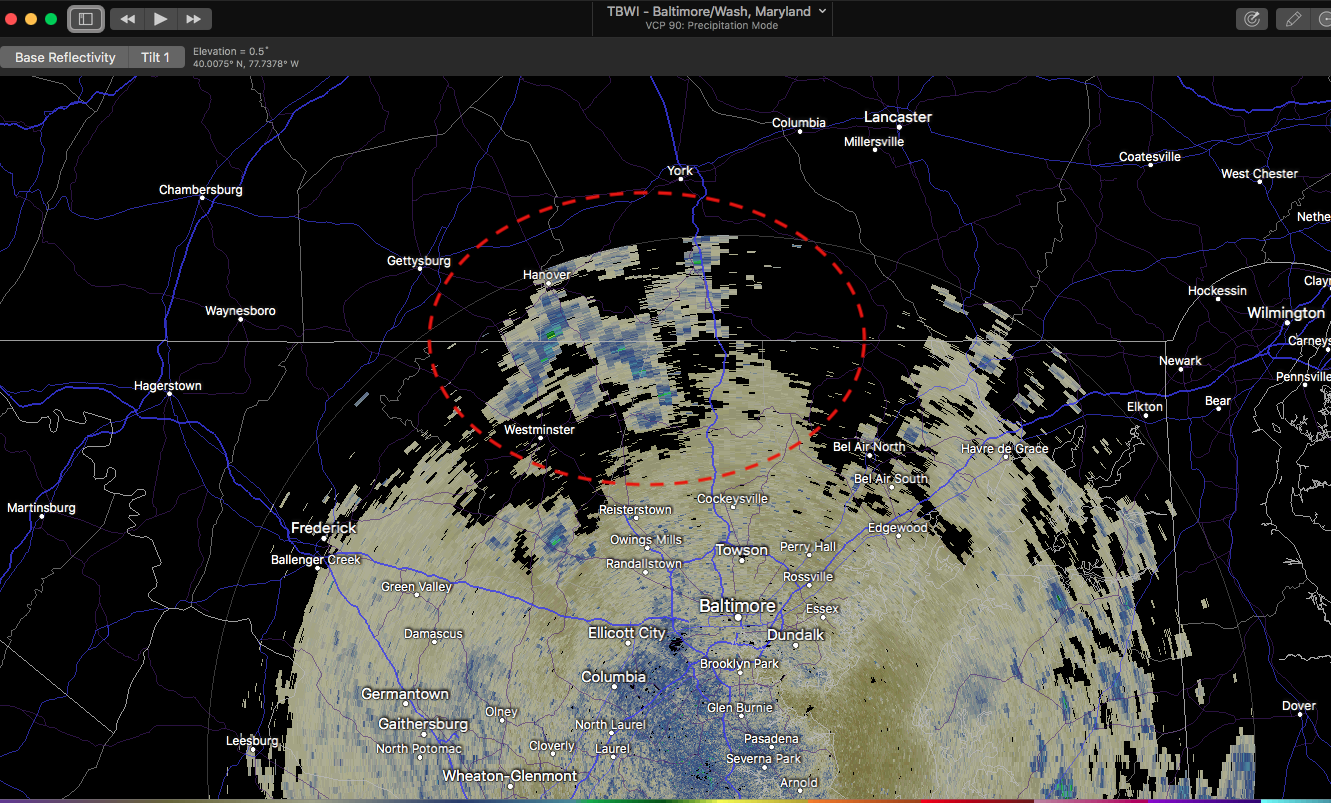
It should advance into the Sus Valley later on this evening and into the overnight hours, and it does appear there's also some stuff developing from the south starting to come up into York/Lancaster counties on TBWI radar. -
Central PA 2020 Fall - The Hope begins
MAG5035 replied to paweather's topic in Upstate New York/Pennsylvania
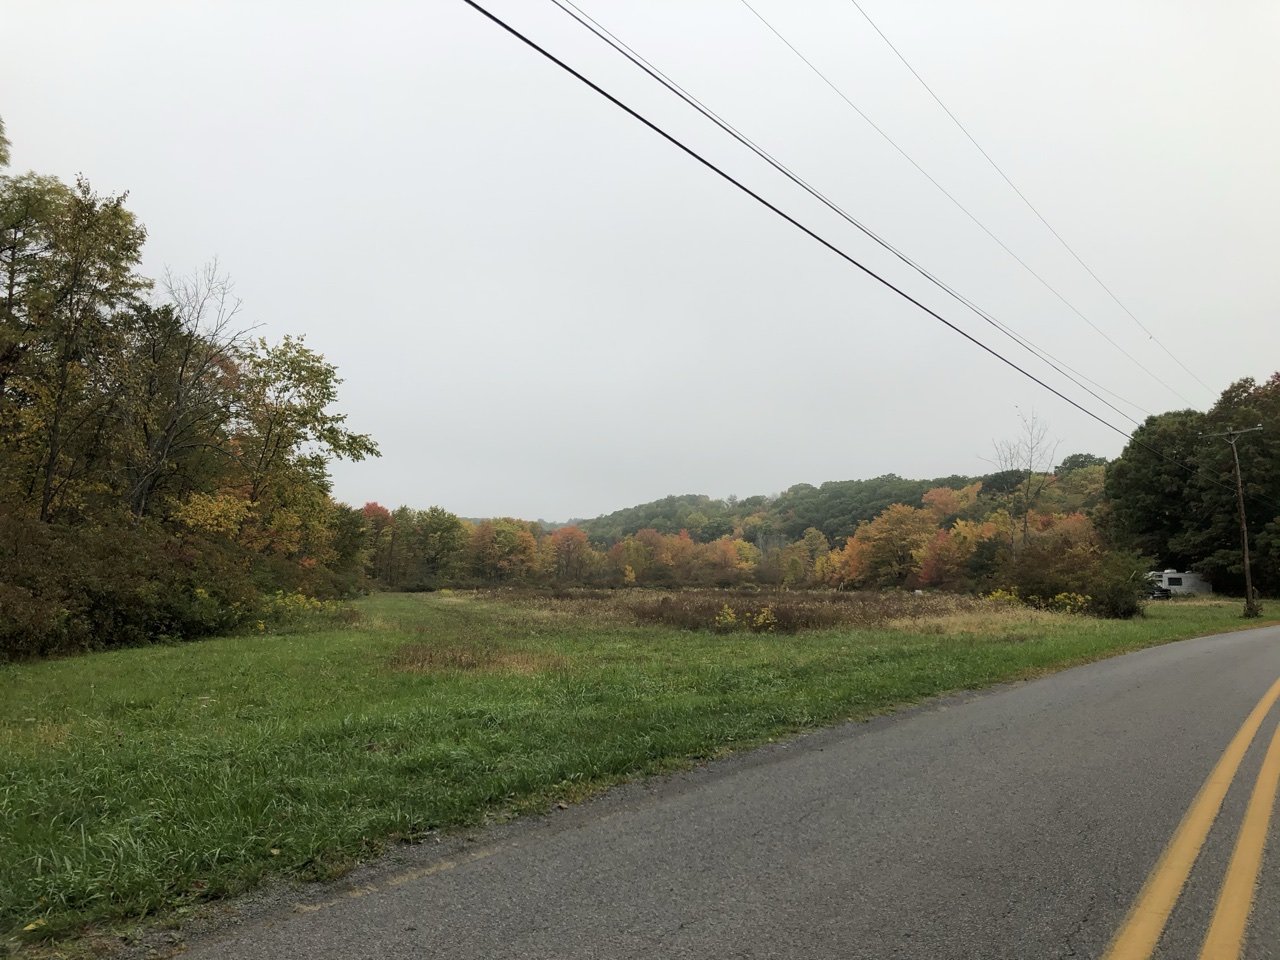
Been a classic mid-fall rainstorm day today around here, with periods of rain of varying intensity and cool temps in the low-mid 50s. -
Central PA 2020 Fall - The Hope begins
MAG5035 replied to paweather's topic in Upstate New York/Pennsylvania
A bit of a sluggish start to things early this morning but a nice rainfall now ongoing. It's actually been quite heavy at times the last hour. Overall, this should hopefully help the worst parts of central PA in terms of the D2 drought bullseye that has popped up in the last couple weeks. Finally, Historic CCX has returned just in time for this rain today. Same can't be said for LWX radar which could be out through October 16th now. Good thing such an extended outage didn't happen in the dead of winter for the Mid-Atlantic gang with a big snow event coming in or during a more active time of the year for severe weather.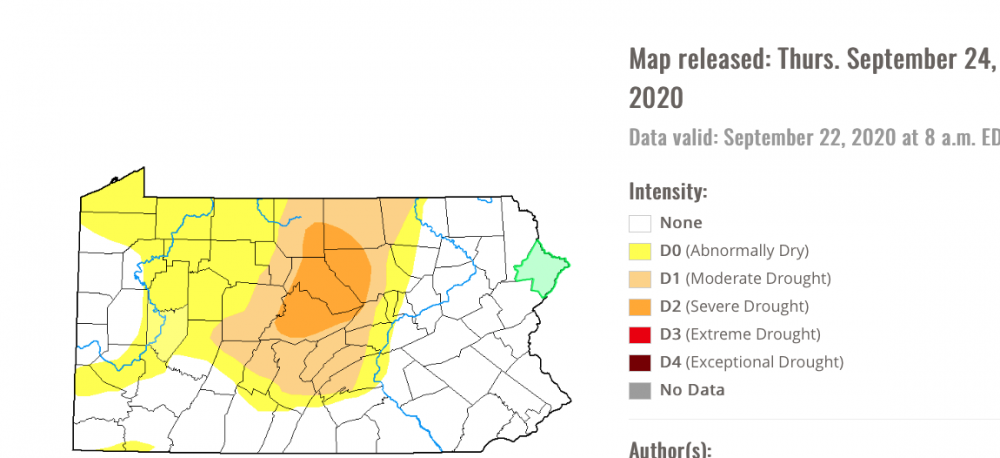
-
Central PA 2020 Fall - The Hope begins
MAG5035 replied to paweather's topic in Upstate New York/Pennsylvania
Looks like a light shower fell here at some point this afternoon. Basically the first rainfall of any amount here since September 13th. -
Central PA 2020 Fall - The Hope begins
MAG5035 replied to paweather's topic in Upstate New York/Pennsylvania
Likely the influence of the remnants of Beta and the southerly/southeasterly flow that has persisted. You can see the low level swirl on satellite just off the coast this afternoon and the clouds hanging tough in eastern PA. https://weather.cod.edu/satrad/?parms=subregional-Mid_Atlantic-truecolor-96-1-100-1&checked=map-glm_flash&colorbar=undefined The only radar that can even see anything in any of the Sus Valley is TBWI, which is a short range radar. CTP mentioned yesterday about waiting on parts for CCX that should arrive very soon. They must be on backorder cuz CCX is still out lol. And LWX radar is having some kind of a more significant issue. Tamaqua probably has better coverage from BGM's radar than the whole LSV attm. The showers your observing are low topped stuff that DIX (Mount Holly) and DOV (Dover) would never see. Although looking at Dover's radar shows the same kind of moist southerly/southeasterly regime in that area that the LSV has been dealing with. TBWI (edge of the radar range is just catching the showers)
-
Central PA 2020 Fall - The Hope begins
MAG5035 replied to paweather's topic in Upstate New York/Pennsylvania
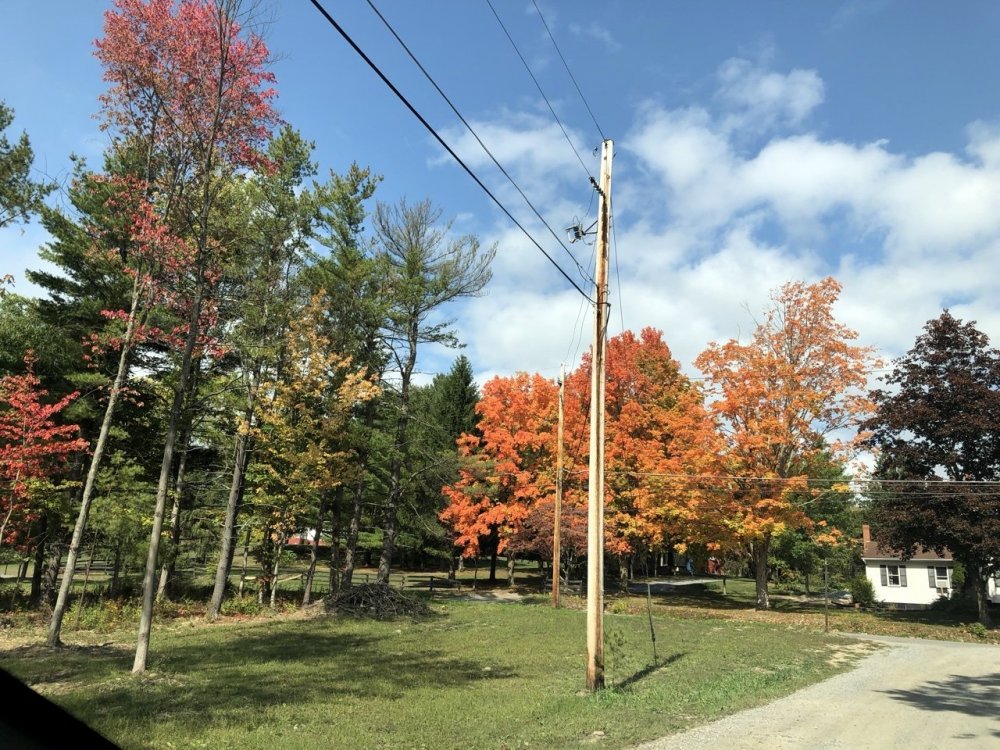
The early foliage has exploded this week around here. Probably the best color I’ve seen the last couple years or so.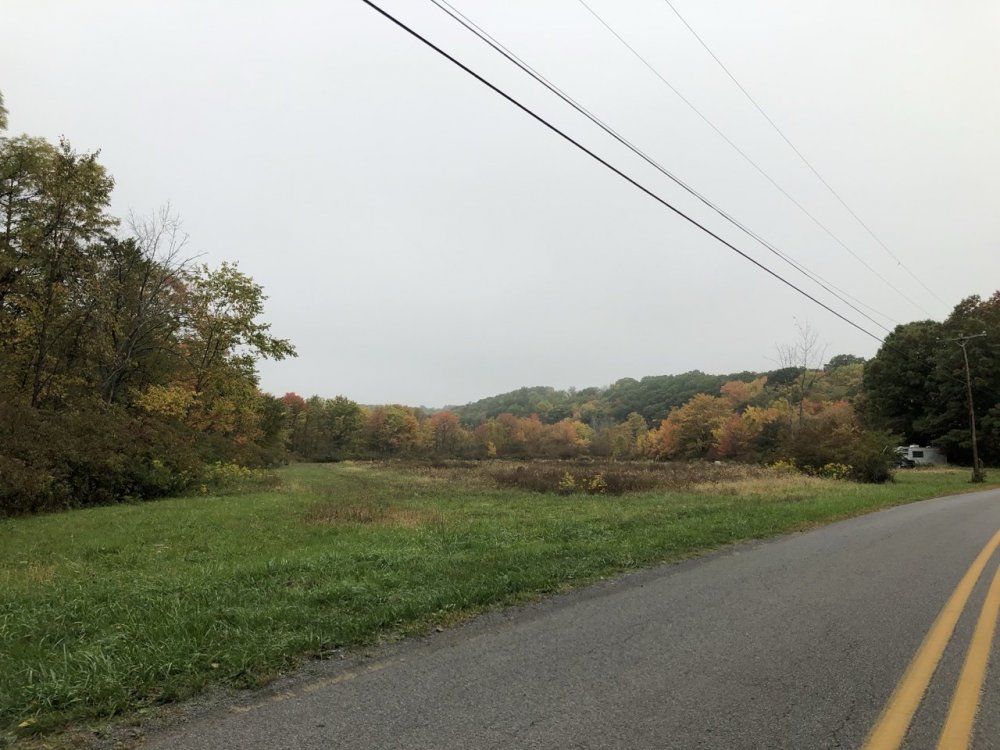

-
Central PA 2020 Fall - The Hope begins
MAG5035 replied to paweather's topic in Upstate New York/Pennsylvania
Tracking the rain in the lower Sus Valley is a bit difficult due to the fact that both CCX (State College) AND LWX (Sterling, VA) radars have both been offline. Haven't seen anything about CCX in their discussions but the notes on RadarScope said it was having something installed Thursday that was supposed to only have had the radar down for 12 hrs.. so don't know what's up there. LWX radar had some kind of significant failure and it was noted on their website that its down til further notice with crews assessing the 26th (today). Good thing nothing major is going on, lol. In the meantime looks like best radar to use in the Sus Valley is either Mount Holly (KDIX) or BWI's terminal doppler radar (TBWI). -
Central PA 2020 Fall - The Hope begins
MAG5035 replied to paweather's topic in Upstate New York/Pennsylvania
I remember it as a more front ended winter back this way, starting with that mid November storm that was even bigger than the 2018 storm. There was a couple impressive cold shots in early Feb and early March but it was Nov-Jan when we got just absolutely rocked by snow. And honestly being 9-10 years old that winter I remember the snow and the '96 blizzard to a degree but the one thing that I remember vividly in that winter was the flood. How it literally took away 90% of that gigantic snowpack in just a night with warm temps and torrential rain and caused all that mess and by lunchtime it was teens/20s snowing and everything froze back up while everything was still flooded. But yea, after the flood there wasn't really any noteworthy storms...at least here. I might have been suppressed out of some stuff in February before it warmed up second half of that month. At any rate looking at the KPSU obs.. a whopping 77.4" of the observed 97.7" at the Walker Building Nov-March came prior to the Jan '96 flood. By month it was Nov - 23.4", Dec- 17.1". Jan - 41", Feb - 5.1" and March - 11.1". Thats nuts, even November on it's own pretty much about doubled up on last winter's total at KUNV (12.9") lol. -
Central PA 2020 Fall - The Hope begins
MAG5035 replied to paweather's topic in Upstate New York/Pennsylvania
They're still showing a general chance of precip near the beginning of next week but not the big phase up yesterday's 12z runs had from both ops. GFS still seemed fairly rainy near Monday on 12 and 18z runs. I do think some kind of precip event will come out of that as we appear to be heading for a pretty sizable shift in the pattern next week. What the GFS/Euro are both really showing today with solid ensemble support is a big time eastern trough/western ridge in the D8-10 timeframe. We'd definitely be starting October pretty chilly if that were to come to fruition. -
Central PA 2020 Fall - The Hope begins
MAG5035 replied to paweather's topic in Upstate New York/Pennsylvania
Don't forget our barn burner of a winter last year, CTP just put the tallies of that one on their website that other day. Look at the huge difference between even some of the north central totals vs the northern border counties (US 6 corridor). Also, I dunno where that 11" was measured in the Altoona area but maybe I'm slant sticking haha.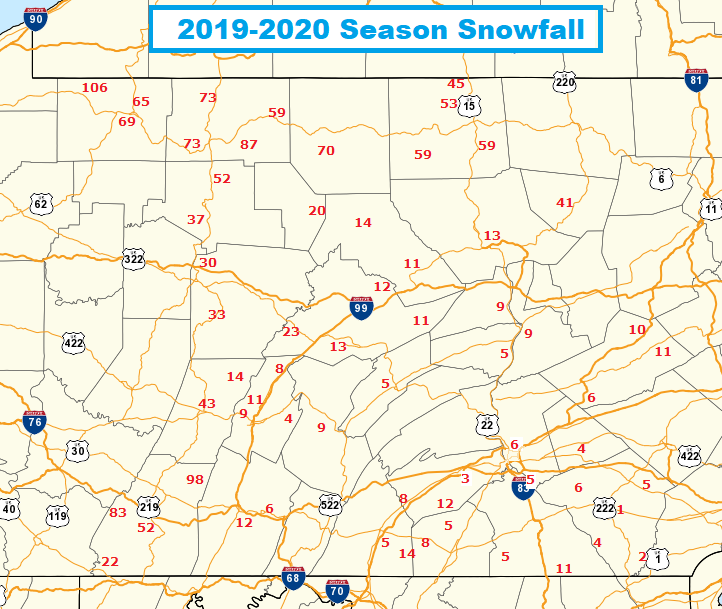
-
Central PA 2020 Fall - The Hope begins
MAG5035 replied to paweather's topic in Upstate New York/Pennsylvania
I was glad my team (Steelers) got out of today pretty clean on the injury front. Lot of injuries today. -
Central PA 2020 Fall - The Hope begins
MAG5035 replied to paweather's topic in Upstate New York/Pennsylvania
Euro with a similar big ticket amplification and precip event today to the GFS. It seems like they entrain the remants of Beta (esp Euro) which looks to swirl about down in the Deep South most of the week. It still looks like a big amplification in the pattern with or without that extra charge. This is still out past D7, so obviously not getting too wound up on any details yet. Being that early next week timeframe is right near the beginning of October, we're getting to that period of the fall where we usually can see that first major system that jolts the pattern towards more of a mid-late fall regime. In the meantime, we warm up second half of the week while staying bone dry.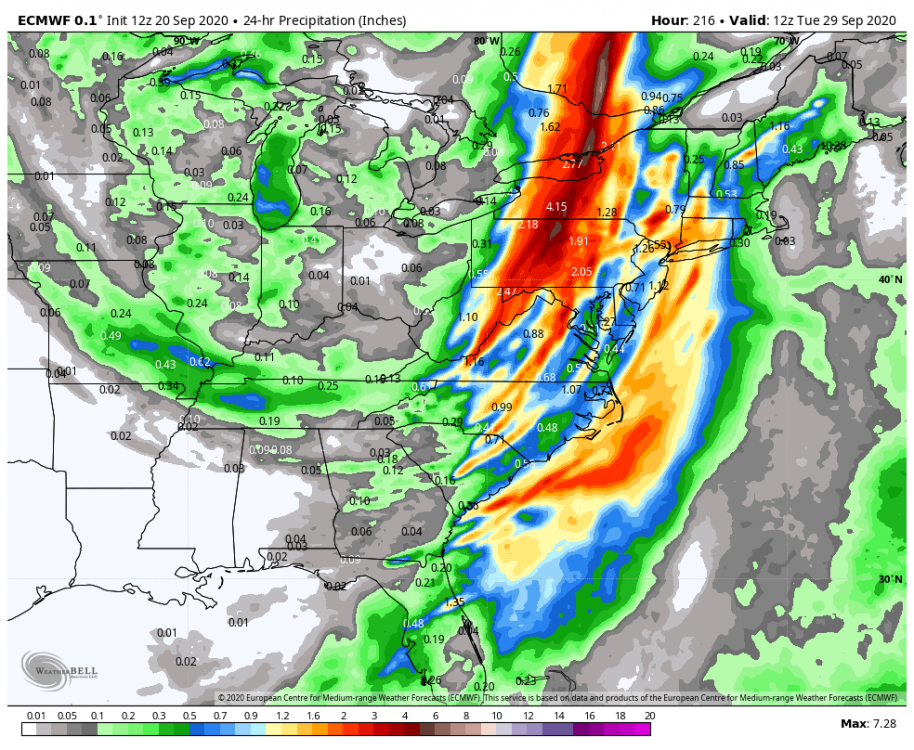
-
Central PA 2020 Fall - The Hope begins
MAG5035 replied to paweather's topic in Upstate New York/Pennsylvania
It was 35ish here this morning with patchy frost. Just outside of town several of the local meso obs were around 32ºF and it was a pretty solid frost. Looking like just about the same deal tonight. Eastern PA might have the coldest low temps tonight. Eyeing up late next weekend/Monday for the next precip chances in the area. Models have generally had something there and 12z GFS went for a phase and cutoff with an excessive rain event in the central counties. I'd say the West Branch might go positive again if the GFS 2-5" stripe in 24hrs between the western Laurel's and the Sus River came to fruition. Still way out there...but as mentioned, models have shown more widespread QPF in that timeframe. Other hopefully good news later this week is models have been showing a Pac NW system coming in mid-late week.. so hopefully some of that gets down at least into Oregon and knocks down some of those wildfires. -
Central PA 2020 Fall - The Hope begins
MAG5035 replied to paweather's topic in Upstate New York/Pennsylvania
Light frost here this morning and it got down to 34-35ish. If i'm seeing a bit of it in town I'm sure the usual spots outside of town probably had a pretty heavy frost or even a freeze. Several meso stations below freezing in the immediate area. Station in Philpsburg reporting a 27ºF and a couple on the outskirts of State College and near Port Matilda 30-31ºF. -
Central PA 2020 Fall - The Hope begins
MAG5035 replied to paweather's topic in Upstate New York/Pennsylvania
Fortunately the only thing I really got going outside right now is the two Knockout rose plants i planted in the late summer.. which are supposed to be fairly hardy to chilly nights like that. That mid May hard freeze and snow we had I don't know how that didn't take out some of the stuff that was growing then like the daffodils and the fully bloomed Magnolia tree. -
Central PA 2020 Fall - The Hope begins
MAG5035 replied to paweather's topic in Upstate New York/Pennsylvania
Wow lows in the mid 30s here the next 4 nights in a row. Sometimes we don't get a run like until most of the way through October. -
Central PA 2020 Fall - The Hope begins
MAG5035 replied to paweather's topic in Upstate New York/Pennsylvania
Smoke's maybe a tad thinner tonight. You can see some of the brighter stars tonight where last night about the only thing you could see was Mars, which is currently one of the brightest objects in the night sky (closest approach to Earth Oct 6th). Still can't really see much though, which is a bummer for star gazers b/c you couldn't ask for better viewing conditions right now between the clear/dry conditions (sans the smoke layer) and an almost new moon. -
Central PA 2020 Fall - The Hope begins
MAG5035 replied to paweather's topic in Upstate New York/Pennsylvania
That's a good question. My best take on that would be it's kind of a yes and no type thing. Yes the smoke particles limit the sun's radiation and that of course has an affect on surface temperatures, which we're seeing the effects of today. I don't know if i've ever seen wildfire smoke so widespread over the US. Part of it is a product of the pattern, most of the US is in a stagnant regime with broad 500mb ridging across the CONUS. Thus the smoke is just rounding the broad high pressure and not getting cleared out by any systems. The setup is also stuffing Hurricane Sally and making that a likely major flooding situation in that part of the Southeast when it finally makes landfall. Where it is not similar is duration/scope as well as makeup of the ash. I would imagine one is thinking of the long term global cool down as a result of a really major volcanic eruption scenario. When a big time volcanic eruption occurs, that will drive the volcanic ash all the way into the stratosphere. The wildfire smoke is riding the jet stream at about the height of a cirrus deck in our parts. High up but still in the troposphere. Weather will eventually clear the wildfire smoke particles (or volcanic particles) out of the troposphere. Dispersing volcanic sulphates takes a much longer time in the stratosphere. Also, being that volcanic ash is actually pulverized rock/minerals/glass.. it is likely a good bit more efficient at reflecting the sun than wood ash is. -
Central PA 2020 Fall - The Hope begins
MAG5035 replied to paweather's topic in Upstate New York/Pennsylvania
KAOO was down to 40ºF last night, and a look at the local mesowest stations showed about the same (39-42ºF). One of the Penn State Ag stations in the fields SW of State College was down to 36ºF as was one near Port Matilda. Those valley areas, especially the Barrens region which is near the Penn State agricultural fields are very good radiational cooling areas so it's likely there was some scattered frost this morning even in this general area.