
LibertyBell
-
Posts
39,756 -
Joined
Content Type
Profiles
Blogs
Forums
American Weather
Media Demo
Store
Gallery
Posts posted by LibertyBell
-
-
Just now, bluewave said:
This was the first time ever that LGA had a high in the 60s only three days after reaching 100°. I will just add the instances of late June and July 100s below. The high of 67° yesterday was well below the average following so soon after a 100° day.
6-30-21….100
7-3-21……67
6-26-52….101
6-28-52……82
7-21-19…..100
7-32-19…..77
7-19-13….100
7-22-13….82
7-18-12…..101
7-20-12……73
7-6-10…..103
7-7-10…..101
7-10-10….85
7-27-05….100
7-28-05….81
7-6-99…..101
7-9-99……85
7-15-95….103
7-16-95…..86
7-20-91…..101
7-21-91…..100
7-22-91……89
7-2-66….101
7-3-66….107
7-6-66….87
7-22-57….101
7-23-57…82
7-22-55….100
7-23-55….100
7-24-55….87
Chris can you dig up June-July 1993? If you could please use NYC/JFK temps for that since thats what I remember.....95/96 around the summer solstice in late June (JFK hit 96 if I remember right)...then a cool/rainy day very similar to yesterday on July 2nd, when the split was 66/62 (NYC/JFK) and then that all time record heatwave and kick start to a historically hot summer a week later.
-
16 hours ago, lee59 said:
Raining all day here, .53 so far. I have gotten 1.75 inches in the past 3 days.
did you get to 2 inches for the event and 1 inch on the day?
-
22 hours ago, BxEngine said:
With the exception of a few evening storms, ive barely seen a cloud out here. Obviously not good for fire season.
wow the blue and green go really well together, Nature has color coordination
")
-
13 hours ago, gravitylover said:
You should have seen that spot 30 years ago when the glacier was a couple hundred feet thick in that bowl and spilled over the cliff down the gully above the waterfall. It was spectacular. The peak in the right background was completely covered with no rocks showing at all right down to treeline except for southerly spines in late summer where the rocks would show through. The difference is staggering to me
 I'm glad I saw it back when...
Kind of a nice day today. Not so great for outdoor stuff but in the same way it kind of was because it's so cool out. Ehh, saving on the AC so I'll take it.
In a few decades they'll have to rename that park to Puddle National Park.
-
Just now, LibertyBell said:
Roger, July 1993 had the most extreme and longest heatwave I've ever experienced....it was very cool and rainy (like yesterday) just a week before the heat came in, with a high/low of 66/62 on the 2nd, and a week after that we were in the middle of a 10 day heatwave, during which 100+ was reached 3 consecutive days (5 consecutive days at EWR, which includes two 105 days- their all time record at the time), we finished with a record 39 90+ days that summer and 20 of them in July!
The following winter we had that extremely cold and stormy 1993-94 winter (after we had our latest ever 80 degree high on November 15)....
-
Roger, July 1993 had the most extreme and longest heatwave I've ever experienced....it was very cool and rainy (like yesterday) just a week before the heat came in, with a high/low of 66/62 on the 2nd, and a week after that we were in the middle of a 10 day heatwave, during which 100+ was reached 3 consecutive days (5 consecutive days at EWR, which includes two 105 days- their all time record at the time), we finished with a record 39 90+ days that summer and 20 of them in July!
-
1979 and 1994 are the only ones on that list I've experienced and 1994 was a lot more snowy/icy than 1979 was and probably a lot more disruptive.
1968 is the only post 1940 year in the top 5.....
-
wow 1917-18 is unmatched by a wide margin....what was going on that winter?!
-
18 hours ago, bluewave said:
Probably the first year that a Memorial Day weekend and July 4th weekend had at least one day with such a cool max. All the more unusual when you consider that we had record heat before both weekends. Goes to the extreme wavelength changes that we have been experiencing over short periods of time.
Might be a pattern that repeats....look at my June-July 1993 comparison
-
18 hours ago, donsutherland1 said:
New York City’s (Central Park) < 60° Temperatures in July: 2000-2021
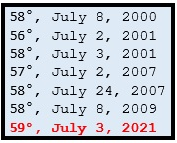
Don what about this morning? Looks like JFK made it to 59?
-
16 hours ago, JustinRP37 said:
This weather is so bizarre for July. 43 degrees colder than just a few days ago. Absolutely stunning.
Not that dissimilar to July 1993. We hit 95-96 right after the Summer solstice that year in late June right down to the coast, then we had a cool, breezy, rainy day on July 2nd when the splits were 66/62 and a week after that we were in the middle of one of the greatest heatwaves the area has ever experienced with 10 straight days of 90+ and 3 straight days of 100+ (and EWR had 5 straight days of 100+!) We ended up with the hottest summer we've ever had with 39 90+ degree days with 20 of them coming in July. July 2nd became a distant memory.....
-
 1
1
-
-
12 hours ago, Nibor said:
"..." upper right corner "edit"
it's very nonintuitive it should be at the bottom right where the quote button is
-
10 hours ago, donsutherland1 said:
The temperature peaked at 66° in New York City's Central Park. The last time the temperature rose no higher than the 60s in Central Park during July occurred on July 25, 2013 when the temperature peaked at 68°. This was the coldest July high temperature since July 8, 2005 when the temperature also topped out at 66°. The daily mean temperature of 62.5° is the coldest July figure in Central Park since July 12, 1990 when the mean temperature was also 62.5°
Tomorrow will be variably cloudy and warmer. There could be a brief push of very warm air into the region early next week.
Out West, there are growing model indications that another above to much above normal regime could set up over parts of the West, including the Southwest.
The ENSO Region 1+2 anomaly was +0.2°C and the Region 3.4 anomaly was 0.0°C for the week centered around June 23. For the past six weeks, the ENSO Region 1+2 anomaly has averaged -0.17°C and the ENSO Region 3.4 anomaly has averaged -0.20°C. Neutral ENSO conditions will likely prevail through August.
The SOI was +19.57 today.
The preliminary Arctic Oscillation (AO) figure was -0.143 today.
On July 1 the MJO was in Phase 2 at an amplitude of 1.276 (RMM). The June 30-adjusted amplitude was 1.367 (RMM).
In late April, the MJO moved through Phase 8 at an extreme amplitude (+3.000 or above). Only February 25, 1988 and March 18-19, 2015 had a higher amplitude at Phase 8. Both 1988 and 2015 went on to have an exceptionally warm July-August period. July-August 1988 had a mean temperature of 79.1°, which ranked 4th highest for that two-month period. July-August 2015 had a mean temperature of 78.9°, which ranked 5th highest for that two-month period. September 2015 was also the warmest September on record. The MJO's extreme passage through Phase 8 could provide the first hint of a hot summer.
Since 1896, 76% of years that saw Phoenix reach 115° or above in June, as occurred this year, had a warmer than July-August in the Middle Atlantic region. The ratio of top 30 July-August temperatures relative to bottom 30 temperatures was 6:1 in favor of the warmth. Overall, the ingredients continue to fall into place for a warmer than normal to potentially hot summer.
Don, in July 1993, on the 2nd, didn't we have a cool rainy day similar to this one? I believe the high/low was 66/62.....and a week later we were baking in one of the greatest heatwaves the area has ever seen and a record hot summer with 39 90 degree days and 3 days at 100 or above!
-
On 7/2/2021 at 5:13 PM, rclab said:
The political party system is in itself a problem. Too many identify with a party and vote that line trusting the party to guide their judgement. It makes voting a lot easier and appropriately brainless such as in NYC. Can you imagine if to run for a local, state or National position you had to divest yourself of any party affiliation. Your name only, not the party appeared on the ballet. All registered voters listed as independent. You could still belong to a party, the same way you can belong to the Masons or the Knights of Columbus. If wanted to run and were elected all such affiliations would have to be cancelled/suspended. I know, once upon a time …… still “you may say I’m a dreamer But I’m not the only one” Thank you JL. As always …..
Love Lennon....if we all lived as "one" humanity would be far more advanced by now and not destroying the planet either.
-
1
-
 1
1
-
-
8 hours ago, Typhoon Tip said:
They were both an example of synergistic feedbacks.
Right, nothing occurs in "isolation"
-
21 minutes ago, bluewave said:
This was the warmest June on record from the Pacific Northwest across Canada to New England and the Canadian Maritimes. The most extreme heat was closest to the areas of the greatest 500 mb height long term height increases over Western North America. Those areas experienced all-time 500 mb heights near 600 dm. The secondary area of record warmth was located closer to New England where a June record 597 mb height was recorded at Upton, NY. This is the other region with fastest rising long term 500 mb heights east of New England.
I was wondering if our heat was somehow related to that, because there was a heat spike more than what was expected. 100 at LGA and 103 at EWR were monthly records in their own right.
-
7 hours ago, donsutherland1 said:
The Washington Post reported:
Within the next week, researchers expect to publish a “rapid attribution” study that determines how climate change made the Northwest heat wave more likely. Yet precisely quantifying the role of climate change in the event has been difficult because the heat was just so extreme, said Michael Wehner, a climate scientist at Lawrence Berkeley National Laboratory in California who is contributing to the attribution effort.
“It’s well beyond what straightforward statistical analysis would suggest. It’s well beyond what climate models suggest,” he continued. “But it happened.”
https://www.washingtonpost.com/climate-environment/2021/07/03/climate-change-heat-dome-death/
Here's a probability question- which was more rare the Pac NW extreme heat, or what happened in Siberia last year?
-
13 hours ago, Roger Smith said:
If you are making a list of singularities then the 2003 heat wave in Europe should be added, early August, longer duration than recent ones, large death toll from heat prostration in Paris.
In historical terms, heat waves in 1911, 1944, 1948, 1953, 1966 are probably in the same league as more recent and better known cases (better known to younger weather weenies at any rate).
Not all climate facts point to runaway warming. Toronto has broken 100F on twelve occasions, only one of them since 1953. The annual max for NYC peaked around the 1930s to 1950s and has only recently begun to approach the highest level it attained (running 30-year averages).
I think AGW is real and plays a role, but we don't really understand what natural processes are at work in either an unmodified or modified climate, so a lot of this is speculation and guesswork, which tends to invite in a political spin factor since nature abhors a vacuum. But I think we have to be honest and say that we cannot be sure what interaction there might be between human modification and natural variability. And that can be taken any way you want, saying that does not make one a "denier" just a clarifier. The role of AGW could be less or it could be even greater. My main motivation in producing a raftload of climate studies is to try to find foundations for disentangling these signals. I would readily admit it is difficult work.
Dont forget 1966, when the high temp records were set at LGA and JFK- also part of the 11 yr cycle
-
9 hours ago, raindancewx said:
I would say to add to this, that each climate region / zone is akin to a slot machine with specific odds for an extremely unlikely event. The odds of a jackpot in the Northwest are apparently much higher in Summer for record heat than where I live in the mountains of the Southwest as an example. How do I know that? In Albuquerque, the all-time record high is 107. The highs reach 72 in mid-April peak at 92 in late June to early August, then fall back to 72 in mid-October. That means you have a six month period, for 1892 to 2020, which is 128 complete years at 183 days per year, when 35 degrees above average is less than 1/23,000+ odds, just going by the observations. That's even including substantial warming in that time frame. That's what I mean when I say the bigger effects are from climates changing climate zone/type. Seattle and Portland are perfectly capable of warming up rapidly by drawing up hot desert air in the Summer that sinks from the East rather than cool Maritime air from the West or cold Arctic air from the North. New Mexico is hot regardless, because whether from the south or east or north or west, the surrounding is hot. NM won't see +35 because in that six month time frame since there is no source region of air hot enough to put 127 degrees at 5,300 feet above sea level in July, or 107 in April or October.
The issue with this type of math is that the odds reset each day. It's not 1/23,000+ for Albuquerque to hit +35 for the half year, or 1/10,000 for Portland to do it in the Summer. It's each day. I know some spots hit +50, but the general area was more like +35.
Given that we just had multiple days of record readings, all concentrated in the same area, it's pretty obvious that because of the exposure to cold in the Arctic/ very wet Pacific air/ very hot desert air from the Southwest, that the odds of a +35 day in the Northwest in the Summer are actually way better than the <1/23,000 per day floor here.
If you split the Earth into 200 pieces, I would bet the average frequency for extremes resemble what I have observed in my lifetime. I am going to be 34 in September. In my lifetime, living in Philadelphia, London, and Albuquerque, I have experienced something like 5-10 days that were more than 30 degrees above or below the long-term average high for the place. Philadelphia had a high of 6 in 1994, that's out by +30. Off the top of my head, I remember some mid 80s pool parties in March 1990 and 1998, a 95 in April 2002, 23 in March 1996 after the very cold winter. That's my guess for most extreme in Philadelphia. It snowed when I was in London in October 2008, but that's not 30 out, despite being part of that record wave (their earliest snow since 1934). In Albuquerque, there was a high of 9 (-42) and then 18 in February 2011, a high of 20 (-33) in February 2021. That's it -seven (ish) days, with a few others right probably pretty close. So based on my random sampling of Earth's climate, I've experienced 7/ ~12,400 days more than 30 degrees above or below the average high, roughly 1/1,800. I'd imagine that's closer to the figure for the extreme heat, with the recognition, that those odds are for each day. That's also why you see the extremes so often. Using my lifetime, it would be: 1 in 1,800 odds for a +/-30 high, every day, run every day for each climate, since each day has a different weather pattern globally.
The other simpler issue is if you scan old newspaper and magazine accounts, you do have a lot of accounts of pretty extreme temps even in the 1800s in the Northwest. Some of the records online are free, like the one, others are behind paywalls from things like the NYT.
https://www.ncei.noaa.gov/sites/default/files/march-1887-monthly-weather-review-final.pdfvia:
United States of America War Department, Monthly Weather Review for 1882, Washington D.C lists the data below
The following are the highest temperatures observed during July 1882 in the United States:
Fort Lapwai, Idaho (113° F, 45.0° C)
Umatilla, Oregon (105° F, 40.6° C) Alamota, Washington (105° F, 40.6° C)
One report says:
In August 1889, forest fires raged in California, Idaho, Washington, Michigan, Montana, Oregon and
Wyoming in the United States. At Seattle, Washington, for several weeks, this region was clouded by
smoke, caused by extensive forest fires in every direction. The entire eastern slope of the Cascade
Mountains, from Natchez Pass north to the boundary was in flames. At Helena, Montana, destructive
forest fires prevailed during the entire month of August. The fire consumed many million feet of lumber
and thousands of acres of timber.Another report says Walla Walla hit 108 degrees in July 1891 as an example (pretty close still to the 114 record that stood from 1961 to a few days ago), with Portland at 102. I'm assuming with the current average July high of 89 or so in Walla, it was probably 85 or 86 back in the day, so just as now, you had +30 Summer days against the background of the climate state. I personally think the idea that the probability curve is what is changing for these events is sort of wrong. The events at the far end of the normal distribution are still very rare, they're just somewhat warmer when they do happen. If you change a spot from averaging 70 degrees to 72 degrees annually, and the physical limit of the spot is +/-35 v. the average, people can adapt to it. The issue would be if you changed from 70 to 72 and also shifted to a different climate zone, and suddenly +40 and -40 events became as routine as the +30 or -30 events against the 72 baseline. That's why that "record heat SW" thread has no real activity. It's great that you're concerned that we had a 600 decameter high. We'll have another one this week, and just like the last one, people here won't even notice.
I remember that spring break heat in March 1990 very clearly- and then we had snow in April that same here lol. I also remember the amazing heatwave in April 2002, one of my favorite summers followed and then a big snowfall winter.
-
13 hours ago, rclab said:
The political party system is in itself a problem. Too many identify with a party and vote that line trusting the party to guide their judgement. It makes voting a lot easier and appropriately brainless such as in NYC. Can you imagine if to run for a local, state or National position you had to divest yourself of any party affiliation. Your name only, not the party appeared on the ballet. All registered voters listed as independent. You could still belong to a party, the same way you can belong to the Masons or the Knights of Columbus. If wanted to run and were elected all such affiliations would have to be cancelled/suspended. I know, once upon a time …… still “you may say I’m a dreamer But I’m not the only one” Thank you JL. As always …..
antitrust regs should be applied to political parties (and every other industry or cartel)
-
1
-
-
10 hours ago, Weatherdude88 said:
The Federal government makes 18.4 cents per gallon of gas.
The state makes between 18 and 58 cents, depending on where you live.
ExxonMobil makes 7 - 8 cents per gallon of gasoline.
Additionally, if the oil industry were taxed more, oil prices would go up. The money would come out of our pockets. All of us would have less money. Electricity, natural gas, cable, internet, and all utilities bills would go up. Also, most products in stores would be more expensive. Green energy is expensive.
It takes time to transition. All the big oil companies have invested in Green Energy. As it becomes more profitable, you will see then pivot more.
I've seen their papers, they say they are past peak oil as of 2020, so hopefully this is about to begin, but the Exxon lobbyist who was recorded was not exactly looking forward.
And then there's things like this going on:
-
47 minutes ago, skierinvermont said:
Yeah just skimming Portland annual max temperatures the mean seems to be around 99-100 until recently it's more like 101-102. And the standard deviation a bit under 4. All guessing of course.
Now if we use NYC data, it's probably less likely because the climate on the east coast is becoming more humid as well as warmer. So warmer mins, but the maxes are leveling off. You see how long it's been since NYC, LGA or JFK has had an all-time max. 1936 for the former, 1966 for the latter two. I've been complaining about the lack of 100 degree heat here. Last really big summer heat period was the 2010-2013 series when we had 4 summers hit 100. Never did I think that Seattle could have an all-time high in excess of NYC's. That's like Seattle having an all-time record snow season in excess of NYC's record from 1995-96!
We also have to consider the cycle of 11 years- the CONUS seems to get excessively hot summers (even for the current climate) in 11 year intervals. Do you think that could be at play here too? Looking at 1933,44,55,66,77,88,99,2010 and now 2021 they seem to be hot all across the country. 2010 was our summer of record heat. These 11 year cyclic summers seem to be getting hotter too as time goes on.
-
12 minutes ago, skierinvermont said:
Under a BAU scenario
And they would see ~112 every few years
It's not hard stuff... you just shift the distribution upwards by the expected daytime summer warming in that region. Maybe broaden the distribution slightly if the wavy jet hypothesis is correct.
If you shift the distribution by 1 standard deviation* (~4F I'm guessing), then a 4.37 sigma event becomes a 3.37 sigma event. If you broaden the distribution slightly then it becomes a ~3.0 sigma event.
*NOTE this is the standard deviation of annual maximum temperature, not daily high temperature
Making a separate post regarding your edit. Right, because we want to find the likelihood of an all-time record high temperature. So the variance should be much less than it would be for a daily high.
-
11 minutes ago, skierinvermont said:
Under a BAU scenario
And they would see ~112 every few years
It's not hard stuff... you just shift the distribution upwards by the expected daytime summer warming in that region. Maybe broaden the distribution slightly if the wavy jet hypothesis is correct.
If you shift the distribution by 1 standard deviation (~7F I'm guessing), then a 4.37 sigma event becomes a 3.37 sigma event. If you broaden the distribution slightly then it becomes a ~3.0 sigma event.
Yeah I remember doing this kind of work with bell curves lol.
You just need to know what the value of 1 SD is and calculate the rest accordingly.
I always thought that normals should be calculated this way- anything outside +/- 1 SD should be deemed above or below normal, not the strictly linear method we use now.

July 2021
in New York City Metro
Posted
7-21-19…..100
7-32-19…..77
Chris, I assume the second date should be 7-22?