
Daniel Boone
-
Posts
3,542 -
Joined
-
Last visited
Content Type
Profiles
Blogs
Forums
American Weather
Media Demo
Store
Gallery
Posts posted by Daniel Boone
-
-
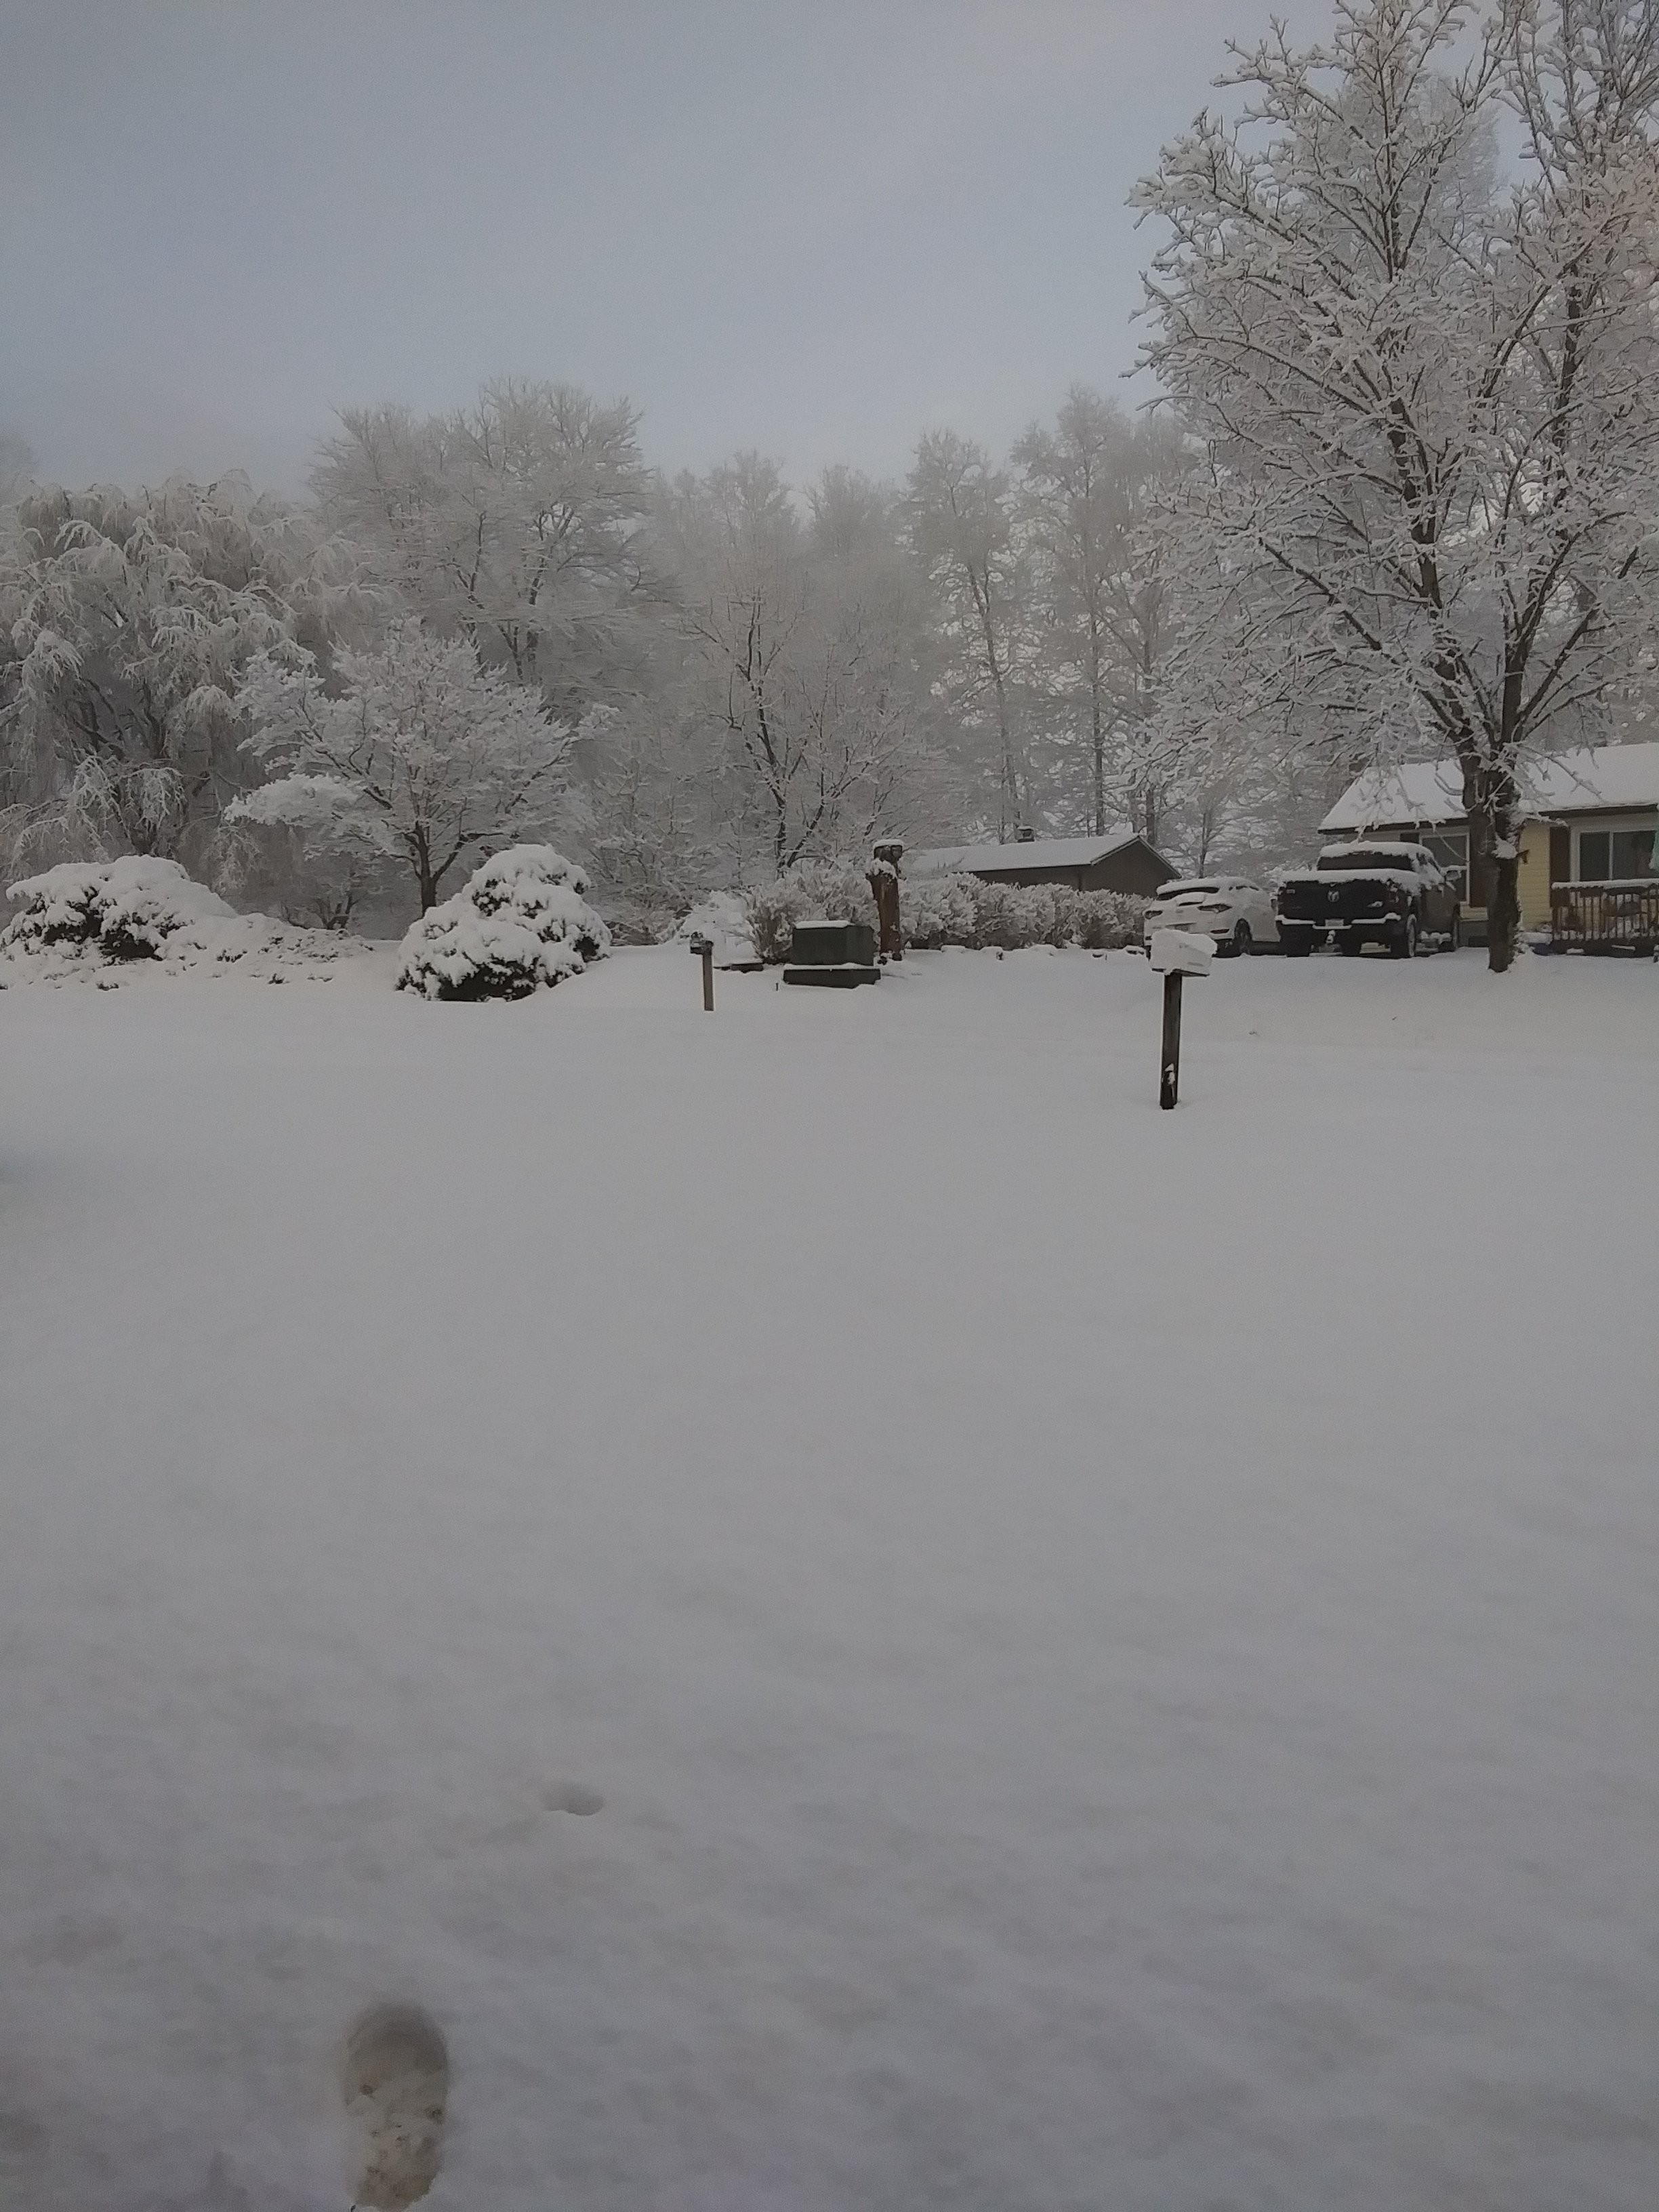
Totalled 7.2" with this one . All snow. High yesterday was 28.5. Low this Morning was 13. Currently 17.
Got official measured reports of 8 inches near Pennington gap and 7 in Dryden, eastern Lee County.
-
 2
2
-
-
5 minutes ago, Carvers Gap said:
@Daniel Boone, I am going to put the response to your MJO thoughts. I didn't realize I was in the storm thread. Also, check out those temps in Montana from the last three days!
The strat split brought us this current outbreak and also likely this weekend's. We are going to need another one I think. I would suggest that the way that we have dodged warm phases in the past is with that set-up. I think winter returns(JB mentioned it today) due to that reason in part. Plus, I think the NAO will re-fire. I do think what looked like an early start to spring (March) is in serious peril if this warm-up has any duration.
Agree completely.
-
13 minutes ago, Silas Lang said:
Not really sure what to think of this one. Models showing rain, but with a thick snowpack and frigid air and more coming behind this system, one has to think we have shot a frozen precipitation regardless of what the models spit out. I just don't know how the cold can retreat so easily.
If they're seeing a strong push of mild air ahead of the System that's why. However, the entrenched lower level cold should spell sleet/freezing rain with still snow northeastern sections (upper valley) as cold from the valley lifts and mixes with the waa ahead of the system.
-
18 minutes ago, Carvers Gap said:
I would say I am very confident of a sharp warm-up next week - spring like stuff. The return of cold continues to get can kicked. I am much less confident today about February than I have been since June - much less. I would say that we get a brief, but sharp cold shot from Jan30-Feb3, and then another warmup(not to the degree next week will be). The duration of that second warm-up will hold the fate of winter for most. The MJO is forecast to stall in phase 6 which is the warmest phase of the MJO, and there is no running from phase 6 - it is going to warm-up. Final hurrah of winter should be the final two weeks of February(maybe first week of March) as the MJO should be favorable then, and that is two weeks behind schedule. The CFSv2 would end winter as its MJO plot rotates and stalls in the warm phases.
There is a strat split, and we are going to need to roll the dice(I know many don't like that reshuffle) with that reshuffle. As we have seen this week, sustained cold is the easiest way to winter. Until we get the MJO to cooperate again, it is thread the needle the rest of the way. So the strat split may be our best option so to speak. With the strat split, we should its effects 2-3 weeks down the road. I would encourage everyone to read back through the winter discussion to see the order of regions it tends to focus on. This current cold snap is probably due to strat warming during mid-late December. I would look for the NAO to reappear.
Overall, and modeling doesn't show this just yet....I bet the upcoming warm-up is more of a thaw. This winter just has the feeling that it is going to be back after this week.....I could be wrong.
Agree. I looked over alot of the goings on last night and if right, we're probably looking at maybe 60's as early as next week. If that big SER materializes and we're stuck in the MJO warm phases .. ugh. The SSW is probably needed this go around for sure. Hopefully, guidance is off on the MJO.
-
9 minutes ago, John1122 said:
https://www.resortcams.com/webcams/downtown-lafollette-tn/
Webcam of LaFollette about 3 miles SSE of me. The road looks like that even with city and state crews working them.
Amazing the difference between you and there irt snow and cold most of the time.
-
1
-
-
7 minutes ago, PowellVolz said:
It’s pouring again but when it slacks up, lots of sleet mix in.
Also I completely forgot about how bright it is at night with snow on the ground. It’s like a full moon.
.Really strange that mid layer warm tongue still shooting up the Valley. It's as if an ULL is sitting to our West.
-
1
-
-
2 minutes ago, John1122 said:
It's absolutely dumping down here still. It's snowed 3/4ths inch in 30 minutes.
Hopefully, that'll survive up through here. Sounds like Lee side Low at work.
-
1
-
-
22 minutes ago, Carvers Gap said:
There is some can kicking of the cold...I just haven't posted in a bit. It is more like weeks 2-4 of Feb as the MJO is gonna get toasty after the 22nd. We were gonna have to pay that toll at some point. It is possible that we may have a cold shot around the 30th, warm-up, and then hit the cold skids during the second week of Feb. I do urge a bit of caution to new posters (not you, Shawn). Originally, Jan 10-20th looked very warm. That can got kicked about ten days. So, any kind of strong cutter or storm is gonna bring down a lot of cold air, even during what looks like a warm-up timeframe. The first week or two of March could be cold but the jury is still out. This winter reminds me a lot of 95-96 which had a big storm, a warm-up, and then got cold again. I am maybe a little less confident that Feb is gonna be cold than I was a few weeks ago, but still reasonably confident.
Yeah, I'm a bit concerned about February as well as the MJO has me skiddish. It may set off that Firehose into Canada again. Probably not but, possible. IF it were to, would probably delay cold till later in February. Hopefully, that won't happen. Otoh, maybe the warm phases get knocked off kilter by other Drivers as happened in some Winter's of yore.
-
1
-
-
9 minutes ago, Carvers Gap said:
6" for the storm so far.
Expect 8-10 brother.
-
1
-
-
1 minute ago, John1122 said:
I got the goose feathers and it stopped for about 10 minutes then picked back up.
That's what I was thinking, maybe some larger flakes with those Shower's.
-
1
-
-
3 minutes ago, Carvers Gap said:
Sitting at about 5.25" of snow. I hate it for the rest of the TRI folks who were dealing with snow/rain issues. Probably will come close to 6" of snow if these last bands work out.
6" here. Suddenly stopped as broken area coming through. Some of those showers with the batch coming off eastern plateau are heavy and may put down a quick inch or two. I expect you to get 8-10 at least Carver.
-
2
-
-
Just now, Dsty2001 said:
Shouldn't heavier rates also help bring cooler air down as well?
Yeah, it does.
-
11 minutes ago, Carvers Gap said:
For several days, the NAM busted badly in the eastern valley as it didn't have any snow east of the Plateau. Globals did much better over here. The final run of the GFS before the event is probably going to verify for the most part with the exception of the foothills which mostmodels basically failed w/ until the last minute.. The Canadian sniffed out the problems in the eastern foothills first. Once the NAM came on board yesterday, it also had it. The HRRR also had it to some extent when it came into range. It is also worth pointing out that the NAM doing well in middle and west TN while not doing well here is easily explainable. It was closer in time to the event and those areas got cold quickly(better ratios). On this end, we were still several hours behind from a modeling standpoint...and it overdid accums on the Plateau and Cumberlands which was feedback. I do think the NC lee side low caused it problems. Once it lost that feedback(and we got closer in time), it did much better. It didn't dial-in here until about 12-16 hours to go. The other problem is that as the system backed and slowed, the NAM tended to feedback. The ICON is probably gonna be the big winner in all of this statewide, and that is probably a shock to most - me for sure. The 3k NAM was particularly good. The 12k NAM was terrible. The RAP and HRRR have been really good as well. I don't like the RAP, but it has done decently this go around.
As MRX noted, no model had the warm air pushing to I-81 in NE TN.....personally, I think the front stalled at dawn at the Plateau and then daytime temps caused issues. The front stalling on the Plateau is not unusual. As Tellico noted the other day, Knoxville has a nice pathway for cold air from the Plateau. Chattanooga and TRI do not. The big red flag was when temps in NE TN yesterday beat forecast highs by 8 degrees. That produced a lot of warm air to scour as we got cloudy at dark, and warm air couldn't scour. Then it go banked against the Apps this AM.
The NAM itself is I think a false positive. It got some things right, but for the wrong reason IMO. It got incorrectly amped and missed the track, but its snow totals worked out. Why? The cold air moved aggressively into middle and west TN and allowed rates to be crazy good. I have roughy 4" of snow right now. My ratio might be 8:1. If it was colder, I would likely have double that. So, whichever model moved the cold in most aggressively is correct...and I don't which one that is....probably the RGEM? The other thing is that the over-amping of the NAM gave it some semblance of expanding the precip shield. Its precip shield was juiced due to feedback and had a bad track in the East - plenty of snow fell east of the Apps which it didn't have. In reality, that precip shield was going to fill in as the rush of cold air squeezed every drop of moisture out of the air - it was impressive. The entry point of heavy precip was decently modeled and didn't change much.
Still looking through some of the reports from middle and west TN which are incredibly helpful. I think the main bust(and let's be honest, nobody cares if a model busts and they get more snow than shown), is the foothills...and that may take some time to figure out.
Excellent post man ! I agree on your reasoning on all points. We were fortunate here in that we were colder than TRI and Ratios better but, rates have been light for the most part as flakes have been small. Portions of the County have been experiencing larger flakes, generally near mountains. I currently have about 4.5 inches.
-
4
-
-
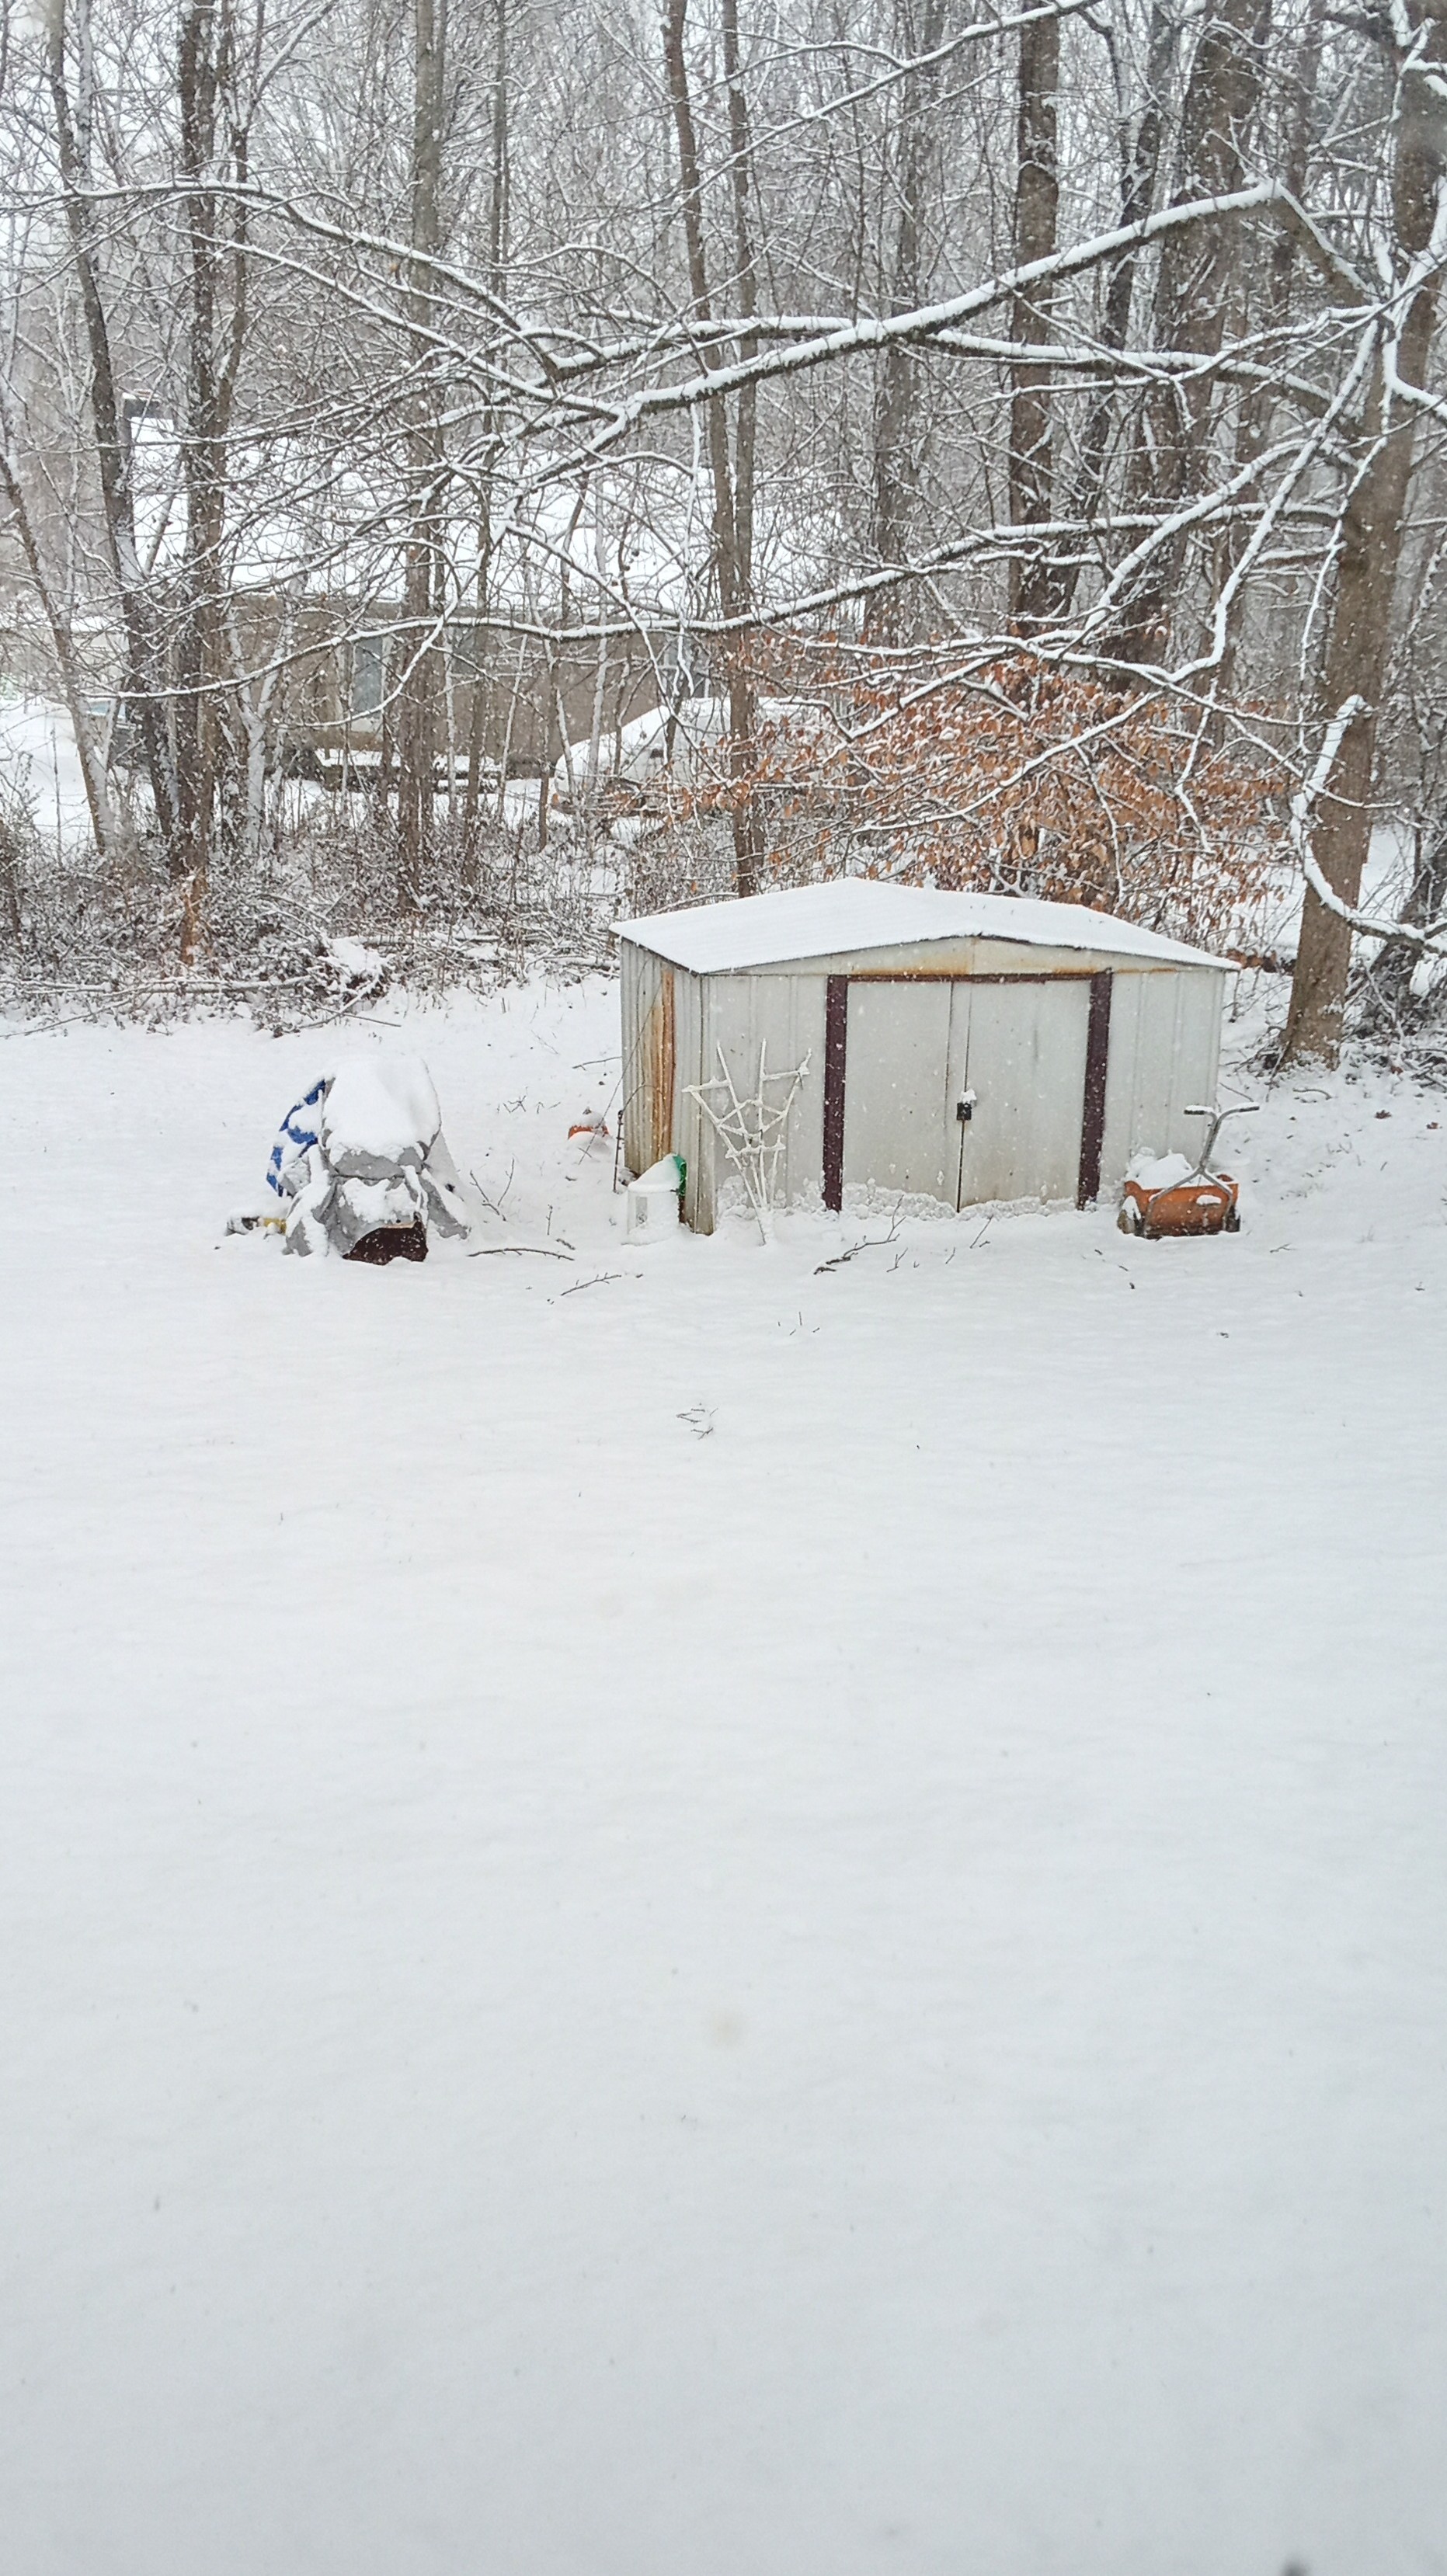
4" now with moderate Snow. 26 F.
-
2
-
-
One more...
-
8
-
-
-
1 minute ago, PowellVolz said:
Temp around 28 but the DP is 25. That’s should keep my temp from going up and keep me all snow right?
.I think you and my area will stay snow but will probably crack 30-31 for a High then start falling.
-
1
-
-
A little over 3" here with steady lt Snow falling.

-
2
-
 1
1
-
-
All jokes aside, probably a coding issue causing that there Carver.
-
3 minutes ago, Carvers Gap said:
On a separate note, there has got to be something off with a station(or programing issue) just to the west of Knoxville. It had 22" of snow and 1.0" of water, and nothing the same around it. It is very visible on the 3K NAM. Anyone know how long that has been an issue? @Daniel Boone, you might be the person to know this....
Or that might be the elk in @Holston_River_Rambler's neighborhood.
It has to be the Elk !
-
1
-
 2
2
-
-
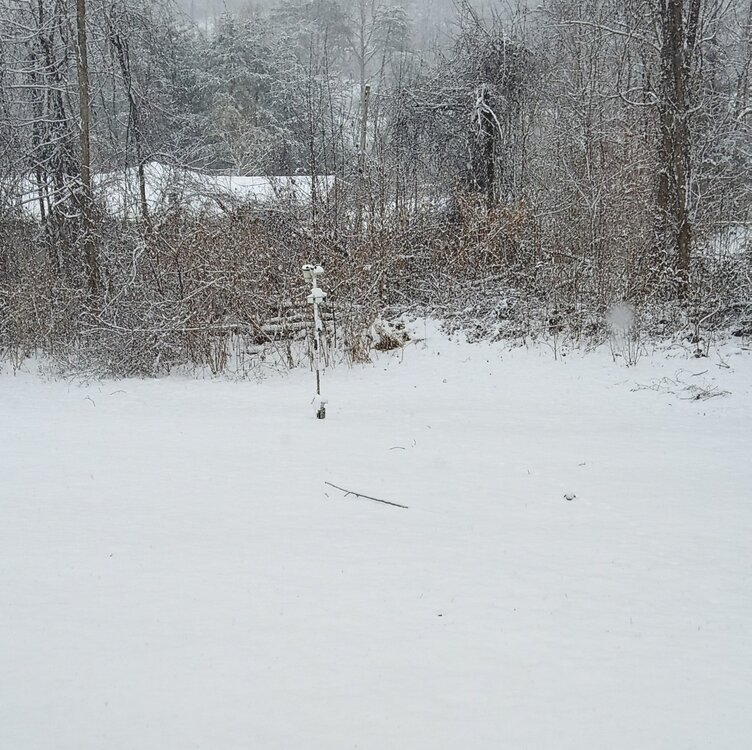
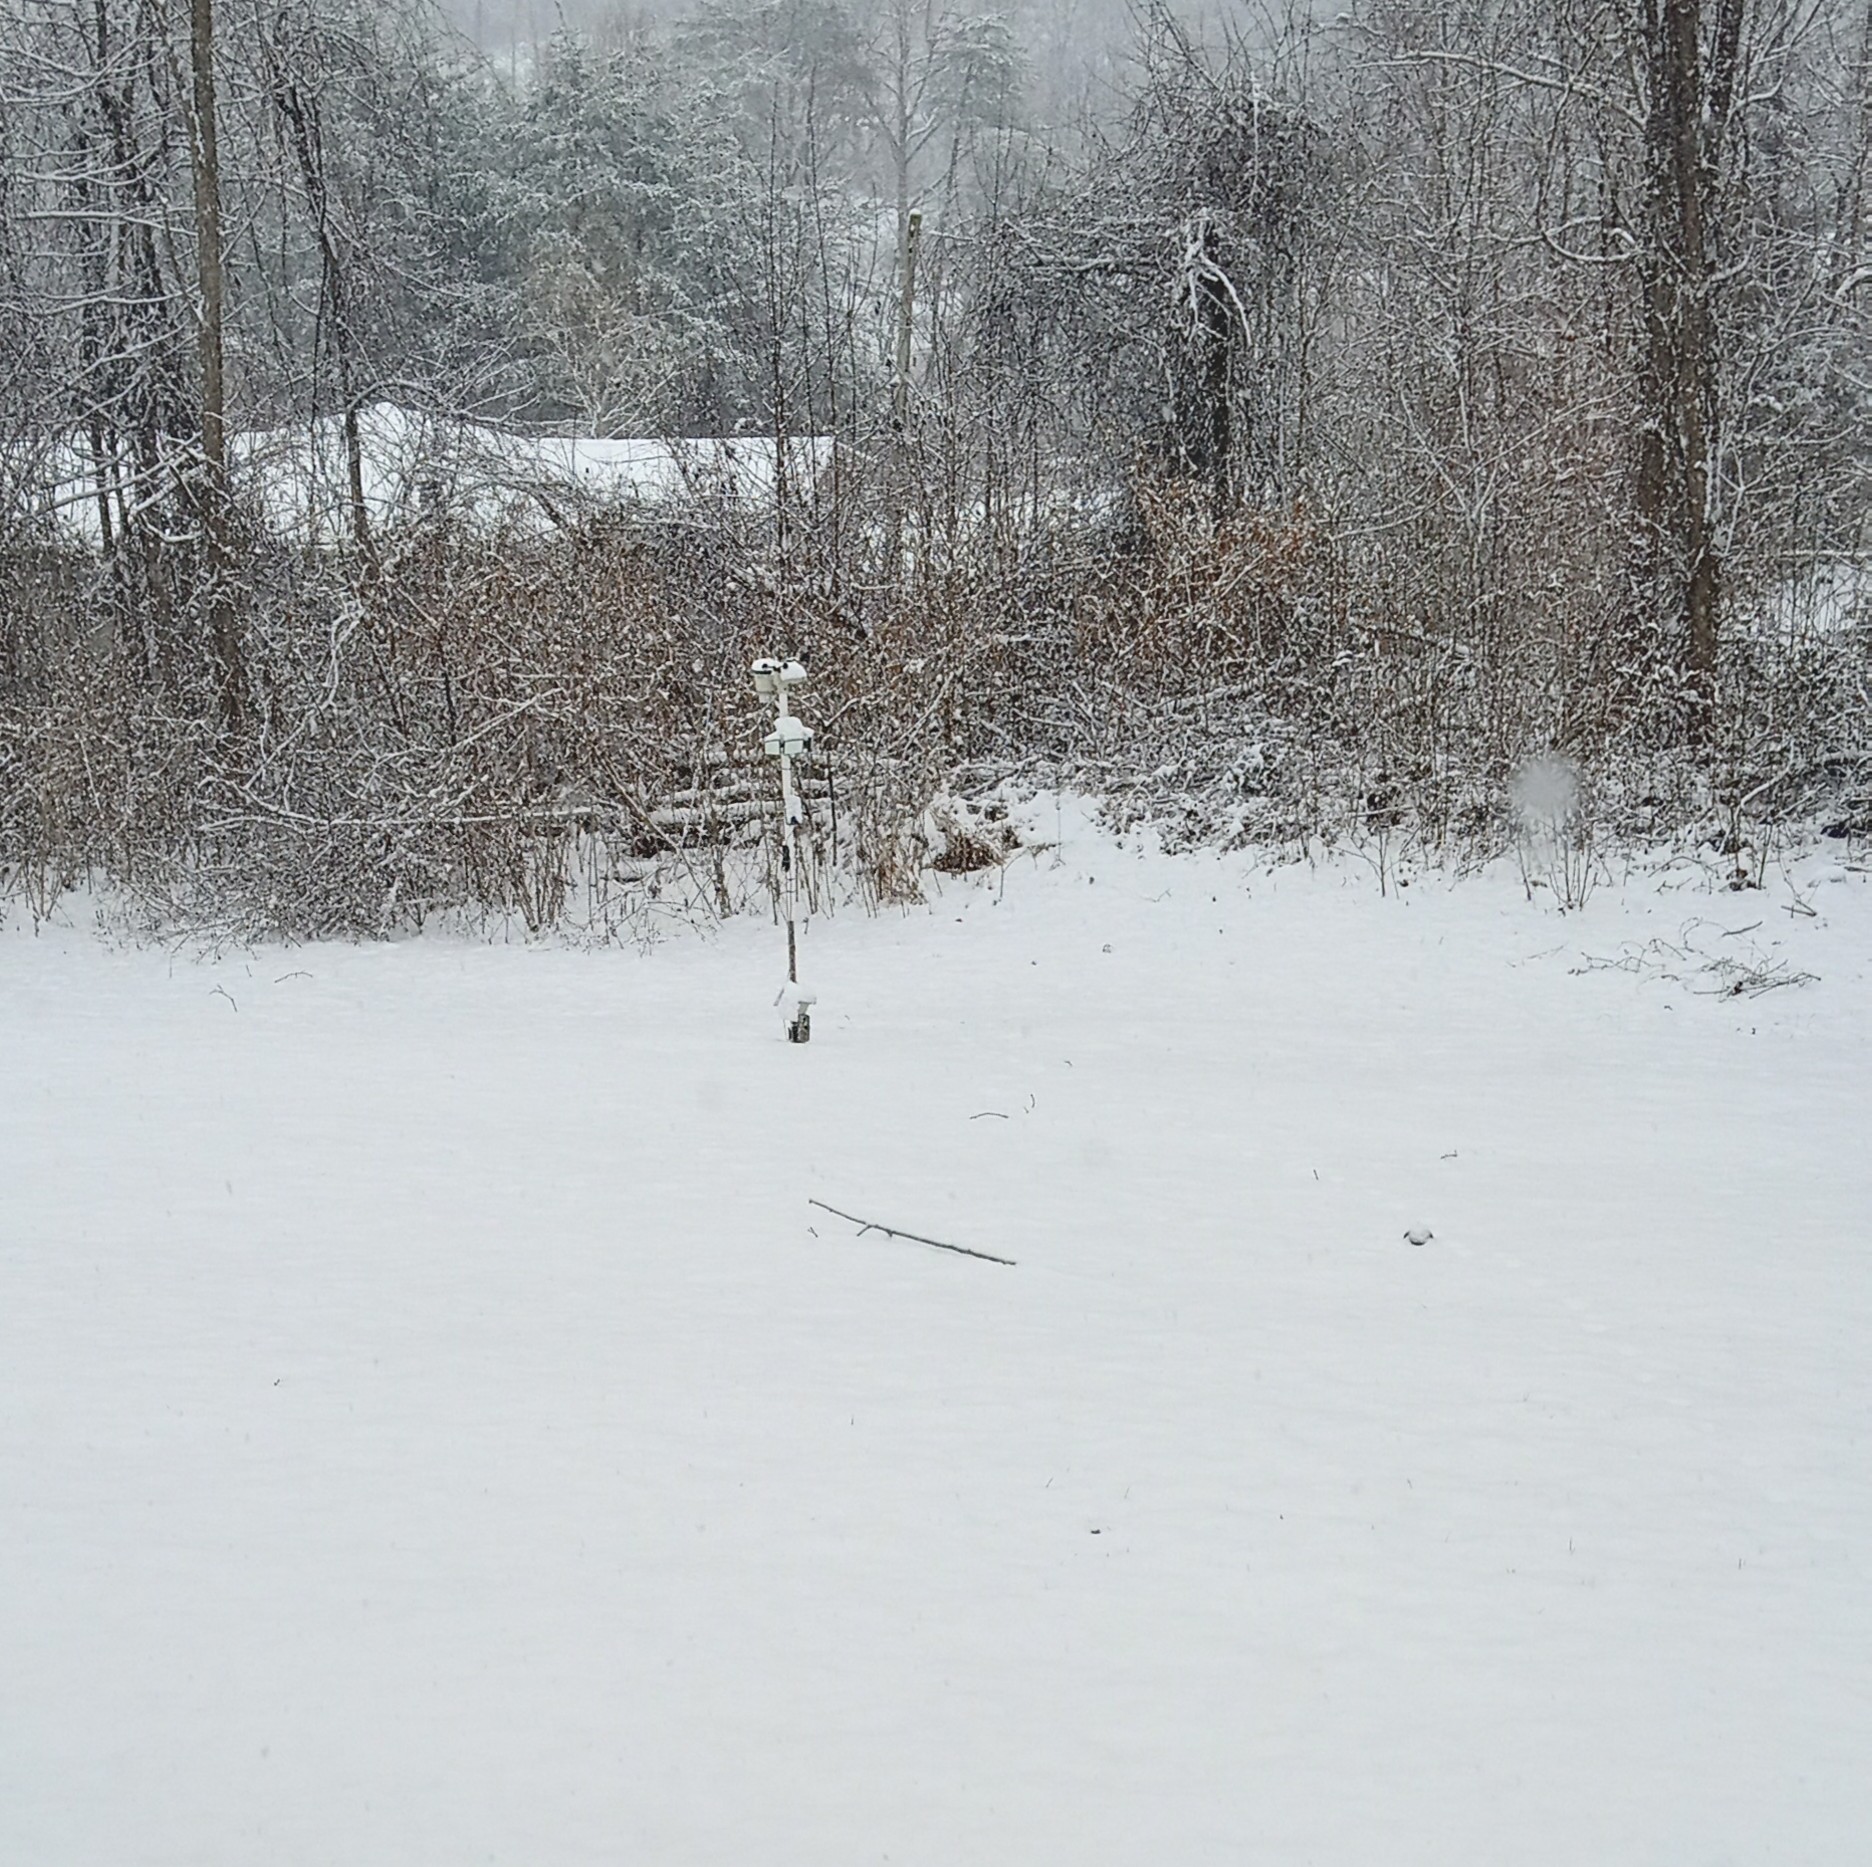
My Stations are KVAJONES4, KVAJONES1 and COOP DW6569.
-
1
-
 1
1
-
-
28.5 here in Jonesville VA.
-
3
-
-
50 minutes ago, Stovepipe said:
At least we know our weather stations are calibrated, I'm right there with you.
Also, LOL at the ads!
Those ads drew my attention away, lol
-
2
-
2
-
-
1 minute ago, Dsty2001 said:
MRX upped their totals, would post the map but it's blurry on my phone
Yeah, basically 6-8" Knoxville north and 4-6 Johnson City east.
-
1
-
January 15th-17th 2024 Arctic Blast/Snow Event
in Tennessee Valley
Posted