

Ottawa Blizzard
-
Posts
4,530 -
Joined
-
Last visited
Content Type
Profiles
Blogs
Forums
American Weather
Media Demo
Store
Gallery
Posts posted by Ottawa Blizzard
-
-
1 hour ago, BuffaloWeather said:
What was that one legendary ice storm in quebec? Had like 3" of freezing rain? What year was that?
January 1998
-
 1
1
-
-
6 hours ago, BuffaloWeather said:
I think thats congrats detriot. Looks like rain/ice/ends as snow here

Wow...another 17" for Toronto on top of what we already have. The city won't know where to put all the stuff.
-
1
-
-
39 minutes ago, wolfie09 said:
This warmth, peaking Thursday coupled with a southerly breeze and
dewpoints rising above freezing will put a major dent into our
existing deep snowpack. Biggest drop in the snowpack will likely be
Thursday when a primed snowpack encounters an airmass that will
likely bring air temperatures to 50F if not warmer to WNY along with
a period of rain. Late next week will need to be watched for
possible ice jams along with any flooding with the combination of
rain and snowmelt.
Might see some ice buildup at Niagara Falls.
-
1
-
-
1 hour ago, Syrmax said:
Highly recommend this book for weenies interested in synoptic of EC storms. There is a Vol.II also that has extensive nomographs of many storms. Always like to break it out in winter.

Has anyone read the new book called Mighty Storms of New England by Eric. P. Fisher?
-
1
-
-
5 hours ago, BuffaloWeather said:
Also don't care about snow on the ground. Just give me 3-4" rates all day.

I'll never understand how really cold temps are even enjoyable. I almost got frostbite a few times on some of my long winter hikes. It's not fun. Skiing in really cold temps going up the lift sucks, hiking in it sucks, what is it good for? I guess frozen ponds for pond hockey would be one thing.
That's what I like the cold for. Nothing beats skating on natural ice. My local pond was 8" thick last Sunday.
-
2
-
-
9 hours ago, Flying MXZ said:
Nice morning walk with the dog! The eagle that flew over didn’t seem to mind the cold.
I went for a walk on Friday morning when it was -11 F. The sun was out and the winds were completely calm. It actually didn't feel that bad, surprisingly.
-
My back yard thermometer got down to -27.3 Celsius (-17 Fahrenheit) on Friday morning - among the top three coldest temperatures I've ever recorded! Amazing example of radiational cooling at night. Deep snowpack, clear skies, next to no wind...
-
On 1/20/2022 at 8:48 PM, mississaugasnow said:
If it can get pushed back a week or two I’d like it. Getting married end of march so an early spring is what I’m hoping for lol
Congrats on your upcoming wedding! I'm still hoping for a February like 1934, 1967, 1979, and 2015, followed by a March like 1960 and 1984. Spring can then get off to a roaring start in April!
-
1
-
-
5 hours ago, DeltaT13 said:
I realize we are actually talking about two somewhat different things. When there was no ice boom and the river got choked with ice, the falls would certainly freeze up substantially more. Nowadays, mostly what we see around the falls is frozen mist. It's this frozen mist that makes the amazing ice bridge and accretions on the gorge. And it's this process that benefits from colder incoming water and a prolonged period of sub freezing temperatures.
I remember there was one winter back in the 90s (1996-1997?) where the ice boom actually stopped working, resulting in a massive buildup of ice below the falls.
-
1
-
-
2 hours ago, Syrmax said:
I've done the Cave. It's a fun experience. Highly recommend.
Great experience. I used to love parking the car and walking over the Rainbow Bridge to the US side, back in pre-pandemic days. These days, I'd need a PCR test to cross back into Canada.
-
 1
1
-
-
Temperature has fallen into the 20s here. Sidewalks icing up.
-
3 hours ago, DeltaT13 said:
The ice boom and power plants have no effect on the ice, we just need prolonged cold. Prolonged cold is at least 4 weeks below freezing with a lot of very cold single digits night and highs in the teens days. Once you get into the 4-6 weeks of prolonged cold is when the magic really happens. It’s certainly not a yearly thing. Additionally you want Lake Erie frozen over so the water feeding the falls is only a couple degrees above freezing. Right now that is a very warm mist with lake temps near 40!
We’ve only had 2-3 years out of of the last decade with impressive ice accretion down there. If the next two weeks remain fairly cold you might start seeing some good stuff around the beginning of February. Otherwise it might not happen this year which is more of the rule than the exception these days.I seem to recall it was quite impressive as recently as January 2018 - that was during the big arctic outbreak that year.
The next few weeks look quite cold, so we'll see what happens.
-
1
-
-
1 minute ago, SouthBuffaloSteve said:
I didn’t think it did but the Ice Boom actually had a huge impact on the falls ice build up. The falls themselves never freeze up but the gorge use to be a sight. Back then if it was cold enough ice flows would rush down and over the falls and jam up in the gorge. Use to be a big winter time attraction in the late 1800s and early 1900s The Ice Bridge they called it. Could walk from US to Canada side, sledding hills, just crazy to think about doing something like that today. 1930s the ice flows were so high the honeymoon steel truss bridge over the gorge literally had its anchors ripped out of the gorge walls and collapsed. Was said the worst winters the ice could grow as much as 100’ high against the gorge walls. Today most you’ll really see is the mountains of ice that accumulate on the rocks under the American Falls and maybe a standard ice sheet in the lower river but only in real long cold winters sustained winters with multiple days of single digits or less.


I'm surprised to see cars in the centre picture. I believe walking on the ice bridge was illegal after 1912 - I've read there was a terrible tragedy that year, when the ice bridge suddenly broke up, and a couple were swept away to their deaths.

-
Just a general question, but when does ice gnerally start to develop at the base of Niagara Falls? I notice that, despite the recent cold temperatures, none has formed yet. I know it's unlikely we'd see ice build up to the extent it did a century ago, due to the ice boom, and the fact we all rely on the falls for our electric power.
-
6 hours ago, Roger Smith said:
I also had a look at reports from YYZ and YTO (downtown Toronto) on the EC website. Using the same convention that I have used for any other recent Toronto snowfalls, the total snowfalls on 16th-17th will be recorded as 39.3 cm (from 10:1 conversion of 39.3 mm total precip). The site reports 25 cm snow depth at some point during the storm and tomorrow there will be another snow depth report. If that exceeds 39 cm then I would enter that amount adjusting the two conversions and retaining the precip numbers. I have never found a case like that since 2017, what has been more often the case is that the post-storm snow depth is just a bit below the presumed 10:1 conversion which is acceptable given compaction, but then again, the water equivalent implied from the YYZ obs indicate only about a 9:1 ratio which if applied to the YTO precip would give a slightly smaller snowfall of around 35 cm. As a previous poster indicated, the YYZ total snowfall was 32.4 cm and that came from a total precip of 34.4 mm (ratio then is 324/34.4 or 9.4 to 1). That assumes that none of the precip was rain, if any small amount was, then the ratio would be closer to 10:1.
If the final snowfall estimate for downtown is maintained at 39.3 cm (the conversion of the two daily amounts is shown in the table and adds up to 15.5 inches) , then the storm will rank t-18 all time (since 1846 when daily snowfall becomes available), and 4th highest since 1930, highest since Jan 1966. Many of the top thirty storms in this list (first appeared here yesterday) are from the heavy snowfall era of the 1860s and 1870s when Toronto's average winter snowfall was closer to 80" and sometimes exceeded 100". March 1870 alone contributes three of the storms to this list and March 1876 two more. By the way the heaviest Nov storm was in 1950 (12.5") and the heaviest April two-day total from 1975, nearly ten inches. So no Nov or Apr storms make this list.
Rank ____ Amount (2d total) ____ Dates (with daily amounts)
_ 01 _____ 23.0 __________________ Dec 25-26 1872 (15.0 + 8.0)^
_ 02 _____ 22.5 __________________ Dec 11-12 1944 (19.0 + 3.5)
_ 03 _____ 22.0 __________________ Feb 20-21 1846 (18.0 + 4.0)
_ 04 _____ 20.0 __________________ Mar 15-16 1870 (10.0 + 10.0)
_t05 _____ 19.5 __________________ Mar 26-27 1870 (3.5 + 16.0)
_t05 _____ 19.5 __________________ Jan 24-25 1873 (4.2 + 15.3)
_t07 _____ 18.0 __________________ Feb 5-6 1863 (16.0 +2.0) (+1.0 4th = 19")
_t07 _____ 18.0 __________________ Feb 14, 1850 (18.0) _ one day
_t07 _____ 18.0 __________________ Jan 20-21 1867 (15.0 + 3.0)
_t07 _____ 18.0 __________________ Feb 24-25 1868 (12.0 + 6.0) (+1.0 23rd = 19")
_ 11 _____ 17.8 ___________________Feb 28-Mar 1 1900 (10.0 + 7.8) (1900 not a leap year)
_ 12 _____ 16.6 __________________ Jan 22-23 1966 (0.9 + 15.7)
_ 13 _____ 16.5 __________________ Mar 21-22 1867 (15.0 + 1.5)
_ 14 _____ 16.2 __________________ Mar 28-29 1876 (10.5 + 5.7)
_ 15 _____ 16.0 ___________________Dec 4-5 1898 (6.0 + 10.0)
_t16 _____ 15.7 ___________________ Jan 8-9 1884 (11.1 + 4.6)
_t16 _____ 15.7 ___________________ Jan 21-22 1902 (2.5 + 13.2)
_t18 _____ 15.5 ___________________ Mar 20-21 1876 (9.0 + 6.5)
_t18 _____ 15.5 ___________________ Mar 8-9 1931 (12.0 + 3.5)
_t18 _____ 15.5 _____________ Jan 16-17, 2022 (1.2 + 14.3) (msd 3.1 + 36.2 cm)
_ 21 _____ 15.1 (msd 38.4 cm)*___ Jan 2-3 1999 (almost all on 2nd)
_t22 _____ 15.0 ___________________ Dec 29 1855 (one day)
_t22 _____ 15.0 ___________________ Mar 12-13 1870 (6.0 + 9.0)
_ 24 _____ 14.5 ___________________ Feb 2-3 1910 (5.0 + 9.5)
_ 25 _____ 14.4 (msd 36.5 cm)*___ Feb 7-8 2013 (8.0 + 6.4) (msd 20.3+16.2 cm)
_ 26 _____ 14.3 (msd 36.2 cm)*___ Feb 27-28 1984 (4.7 + 9.6) (msd 12.0 + 24.4 cm)
_ 27 _____ 14.2 ___________________ Feb 21-22 1950 (11.0 + 3.2)
_ 28 _____ 14.0 ___________________ Jan 18-19 1864 (4.0 + 10.0)
_ 29 _____ 13.9 ___________________ Dec 27-28 1968 (2.6 + 11.3)
_ 30 _____ 13.5 ___________________ Feb 25-26 1960 (13.0 + 0.5)
_ xx _____ 13.0 or more __________ Feb 1845 (upper limit probably 18")
______________________________
* and ^ notes are explained in my previous post almost 24h back in the thread, * basically refers to fact that only four now post-1978 storms were measured in cms and converted, all the rest were originally measured in inches; and ^ the leading storm from Dec 1872 appears to be mostly from localized lake effect as synoptic pattern available suggests a much lower potential total from that component. That was not the case for any of the other old-time storms where the weather maps revealed strong low pressure systems tracking to the south of Lake Ontario usually from southwest.
---------------------
So this storm would rank t-18 on the all-time list, but note that it is third highest January total just behind Jan 22-23 1966 which the author recalls as being no more disruptive than this one, and on a weekend, and marginally lower than a storm total from 1902 (Jan 21-22); the Jan 2-3 1999 storm was slightly lower in the table but its disruption increased after subsequent 8-10 inch falls added to the snowpack. Also while ranking t-18, the storm ranks third since 1940 and fifth since 1899.
Open to suggestions about any revision of those estimates, I have just finished the update of the data base that you can find over in the climate change forum here (a link to a similar thread on UK net-weather where due to larger download limits I have stored the supporting excel files), and I have not contacted anyone at EC to inform them that this data base exists, but my plan is to do so, and to suggest that they fill in the few missing days from this location (most of which are after 2013) from hourly data which are often almost complete and would give reliable temperature and precip estimates, also it would probably be a good plan to merge the two concurrent reports that exist between 2003 and 2017 where one needs to go from one site to the other to blend temperature, rainfall and snowfall. If the downtown station was then maintained at the current service level (ideally with snowfall restored) then it would continue to provide an unbroken climate record from essentially the same location as at all past times, that is to say, geographically similar, a large city has grown up around the location which was originally near the outskirts of a small town.
Awesome post Roger - thank you. Wow, Toronto saw a lot of snow in the 19th century. Tail end of the Little Ice Age might be a reason? The UK saw some big storms back then, as well, the great storm of 1881, and the deep freeze of 1895 being two example.
-
2
-
 1
1
-
-
1 hour ago, Snowstorms said:
6 straight hours of +SN at YYZ only to finish with a whopping 9" lol. Though other stations all recorded between 14-18" with this storm.
Similar to this storm, then, in how YYZ reported bogus numbers. I seem to recall a bunch of us venting about it on this board, at the time.
-
1
-
-
5 minutes ago, BuffaloWeather said:
Isn't there multiple airports in toronto that record snow or just YYZ?
Multiple. Downsview reported 35 cm (14")
-
2
-
-
5 hours ago, dmc76 said:
No Toronto posters anymore. Chicago peeps scare them off?
Oh, we're here, but we've been posting in the Upstate New York subforum for this storm...given the storm didn't really impact Michigan and Illinois.
Has anyone heard from snowstormcanuck? I would have thought he'd have been right on top of this storm!
-
On 1/16/2022 at 7:21 AM, LakeEffectKing said:
For entertainment purposes only.....
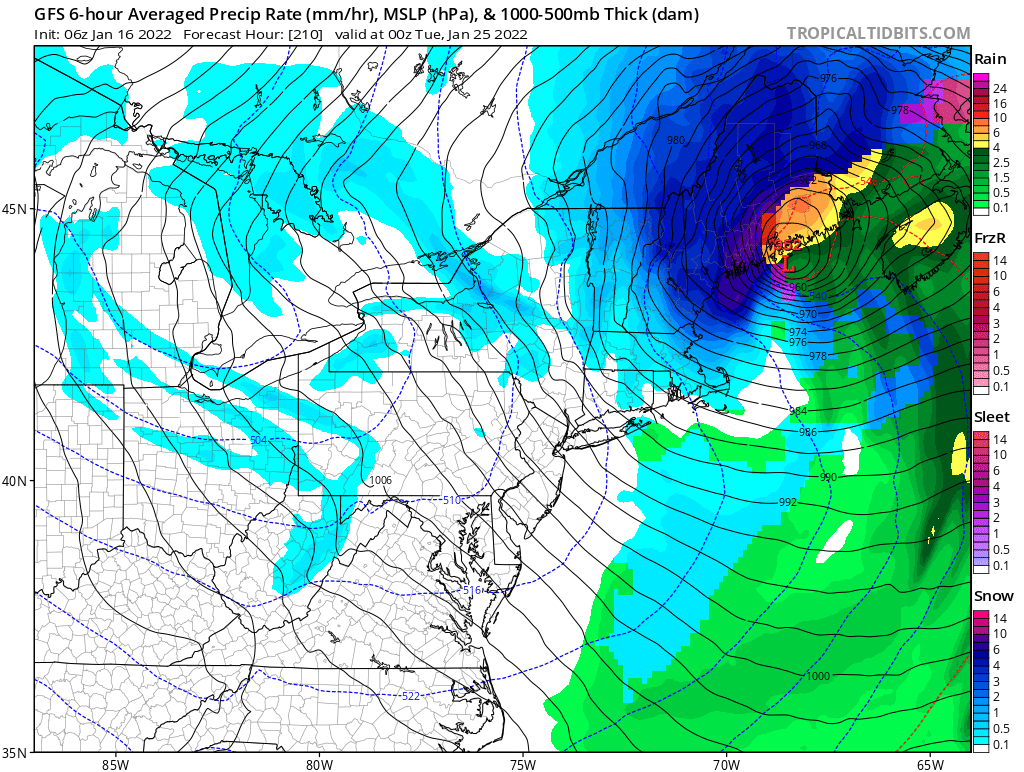
06z GFS....952mb....wow!

Congratulations Bangor, Jackman Station, and Quebec City.
-
6 hours ago, TugHillMatt said:
Ha! Yup...it's this neverending repeat pattern we've been in for years.. cool down, then warms up and rains...cool down.
Perhaps we can get this to move far enough north on Thursday? Or will it take the suppressed southern track right after the one on Wednesday takes the north track?

I remember back in 2007-2008, there was very much a "northwest trend" on the models, kind of like what we saw with the recent storm. Maybe we can get that to happen with this storm too?
-
1
-
-
55 minutes ago, TugHillMatt said:
I am quite perplexed on what it takes for CNY to get a decent synoptic snowfall. It's like we need the perfect thread-the-needle situation. These lows are too far south, but if they come even the slightest bit too far north for us to actually get affected, we warm.
Trust me, I know how that feels up here in Toronto. This latest storm was very much the exception that proved the rule. We are not exposed to lake effect snows too often, while the lake serves to moderate our temperatures. Unlike cities like Ottawa and Montreal, we aren't in a valley location that can trap in the cold. We are very often in a snow-to-rain scenario here.
-
1
-
-
2 hours ago, BuffaloWeather said:
March 2008?
That was a big storm, especially in Ottawa (20"), but it wasn't as big as this one has been, here in Toronto.
-
1
-
-
1 hour ago, Snowstorms said:
Have to revise this. It's ~20".
Yup, I'd estimate I got around 16", maybe more.
-
2
-
-
1 hour ago, andyhb said:
Knowing some of YYZ climo, large snowstorms like this one (and particularly blizzards) are quite rare for them. There have only been a select few storms in history that have dropped over 15" there, and this looks to join the club.
Last one I can remember was early February 2013.
Other than that, there were big storms in 1944, 1965, 1966, 1992, 1999.

Upstate/Eastern New York-Pattern Change Vs Tughill Curse?
in Upstate New York/Pennsylvania
Posted
I was living in Toronto at the time, so we could just got grazed, before it turned to rain. It was really bad in Kingston and Ottawa, though. People out of power for days.
Toronto's big ice storm was on December 21, 2013. Without power for three days. Great photo opportunities, though.