

It's Always Sunny
-
Posts
1,943 -
Joined
-
Last visited
Content Type
Profiles
Blogs
Forums
American Weather
Media Demo
Store
Gallery
Posts posted by It's Always Sunny
-
-
2-4" for BOS looking more reasonable based off 00Z suite.
-
 2
2
-
-
Next week's severe weather potential looking good per dry line setup in TX/OK. Low level moisture, CAPE (not shown), kinematics all in place. Not a bad look at all albeit a week out.

-
3
-
-
Still lots of asymmetric spread but for snow weenies good to see it on the W/NW side. Obviously too far west isn't good but any sign that keeps this thing closer to the coast rather than OTS is a win for the time being.
-
2
-
-
Had some spare time to put this together. Current modeled output resembles January 26-27, 2015 blizzard. Surprisingly most of these events occurred when the NAO was neutral-positive.
-
3
-
-
4 minutes ago, CoastalWx said:
1995 was like single digits Christmas morning with a foot on the ground. I’ll be picking roses this year.
Highs in the 40s isn't cold enough for you?
 . DFW may get close to 80F I'm loving every bit of it
-
 1
1
-
-
On 12/1/2021 at 6:28 AM, Powerball said:
DFW ended up +1.3*F above average for November.

I think we're close to a lock to break the latest freeze record which is Jan 4th (1972).
-
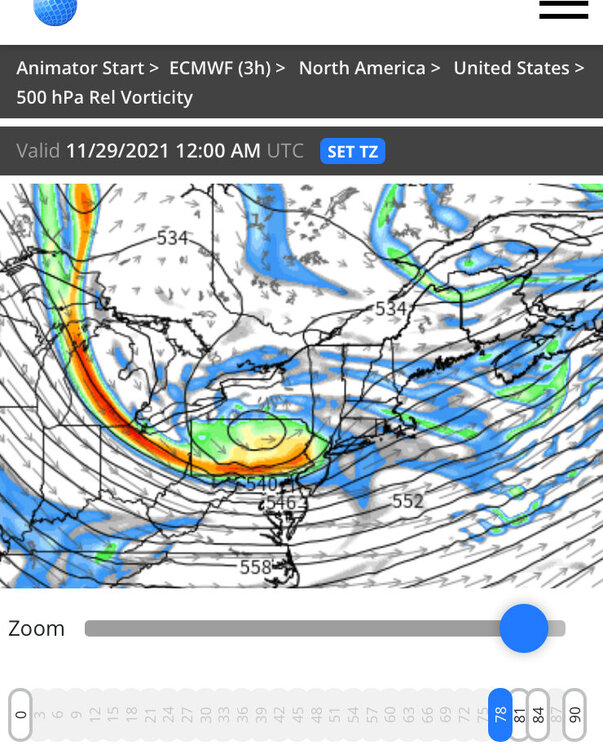
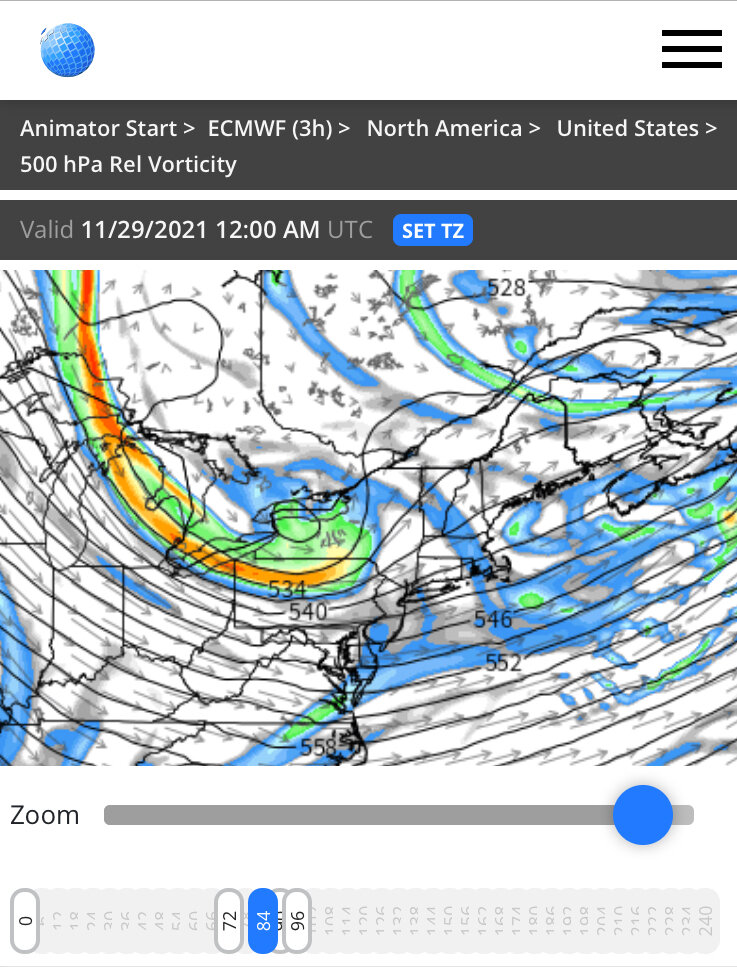
Meh on this potential IVT. Sniffing snizzle.
-
Manch Vegas mixing now
-
Just now, ORH_wxman said:
It’s significantly south imho. It’s enough to matter anyway. Here’s 18z on top and 12z at the bottom at the same time:

Oh I'm talking about tomorrow night. I was like Will's a smart dude but uh it looks very similar lol.
-
8 minutes ago, ORH_wxman said:
Well it was the first run in several cycles that deepened the northern stream shortwave further south. So at least for now the trend of it being flatter has stopped which is what we need to get this back to being a bigger deal.
12Z had a similar look though. 18Z doesn't look much different if we're talking h5
-
40 minutes ago, MaineJayhawk said:
Maybe change the date on this topic to 11/26 - 11/27
Just saw this after I posted...I agree!
-
1
-
-
This thread should be renamed to Nov 26-27 Snow Threat much better chance people see snow tomorrow.
-
1
-
-
1 hour ago, George001 said:
I believe the ceiling is a lot higher, if the northern stream digs more and the southern stream ejects faster, the snow totals on the models will increase. It’s not showing it yet but I believe it is close. The pattern does not favor a progressive solution from what I saw. It favors an amplified one. Maybe it will amplify so much it rains, that’s possible. However just yesterday we saw 1 foot+ on the European guidance in some areas. Even Kevin is sticking with his 4-8 call, and he’s a more conservative forecaster than I am.
You and your ceilings...just like your prediction a couple months ago Boston can get 150+" of snow smh.
-
1
-
-
If anyone east of 95 in MA is expecting more than 1" you'll be disappointed.
-
 1
1
-
-
I think this is currently an underplayed system tomorrow night. Quite a few spots from MHT up through PWM could see between 1-3".
-
34 minutes ago, Iceresistance said:
18z GFS . . . O_O
Yeah 18Z is nice for you. We just end up with our first freeze of the season here. Still fantasyland though...
-
12Z GFS...
-
7 hours ago, CoastalWx said:
Also the polar vortex is climo. Just because it’s near the North Pole does not mean winter is doomed. I guess it’s how you define weaken, but those weakenings and splitting are not typically common, yet we still average the snow that we do. In Pacific we trust.
This is what happens when The Weather Channel (and the media in general) refers to the Polar Vortex so loosely; it creates misconception. They have everyone looking up at 10mb when at 500mb and below is what actually produces most of the time.
-
Just now, EasternLI said:
From what I've read, the Indian Ocean and the western Pacific Warm Pool are two areas under increased scrutiny in recent years, and continues to be. Mostly because of projected warming in that part of the world. Most of the research done previously did not look into possible global ramifications only local ones. The following recent paper, for example, attributes the +NAO of winter 19-20 to the very strong IOD of that fall.
https://rmets.onlinelibrary.wiley.com/doi/full/10.1002/asl.1005
I haven't read this article but just goes to show how much more there is to learn. Thanks for the link!
-
1
-
-
6 minutes ago, Ginx snewx said:
Winter influence is what I was referenced.
http://www.bom.gov.au/climate/enso/#tabs=Indian-Ocean
However, four of the five international climate models surveyed by the Bureau indicate the monthly IOD value for November will be within the neutral range, with the remaining model sitting just at the threshold value (i.e. −0.4 °C). A return to neutral weekly IOD values is anticipated in the coming weeks. This is consistent with the typical life cycle of an IOD event, which sees events dissipate in late spring or early summer with the arrival of the Australian monsoon. When the monsoon trough shifts south over the tropical Indian Ocean, it changes wind patterns and prevents an IOD event from forming. This is why IOD events are unable to form (and therefore influence Australian climate) during December to April.
Ok yeah I get what you're saying but I guess the point I was trying to make was there have been a few months during Dec-Apr where IOD was negative and has had some influence on downstream impacts via enhanced Walker Circulation. Obviously what transpires in the IO will have certain amount of time lag before its influence is felt over the Pacific but like mentioned before I think this is an area of research that can be explored more. IO is such a huge driver of our summer weather I would think there is at least some influence (big or not) it has on winter weather, more than what we currently know. There was some research done back in 2015 I think that correlated summer/fall IOD phase to proceeding ENSO phase with 8-14 month lead time. Results weren't entirely accurate but r-values were sound. It didn't pan out this year when referencing last but I believe the year before it did I would have to go back and look. Just shows how "new" all this is.
-
1
-
-
10 hours ago, 40/70 Benchmark said:
Yea, I don't even now what AAM and mountain torques are. Lots to learn still.
HM is the go to for this but put very simply it is the amount of westerly momentum (or lack thereof) occurring around the globe. GSDL plots only show what has already happened so you can't really forecast based on that but it gives a snapshot of current conditions (total GLAAM, FT, MT, tendencies, etc). Gensini has a nice webpage that shows AAM forecast but it currently is not up to date. Also has a strong low bias since it is GFS based. To be perfectly honest it's a nice tool to have but if you don't have access to AAM model guidance (which most don't unless you have a high tier WxBell account or if Gensini's site updates), deterministic and ensemble models along with teleconnections are pretty much all you need in my opinion. Here is a post I made yesterday pertaining to AAM & MJO where you can use AAM to support a forecast but without the AAM forecast models themselves it is hard to solely rely on:
-
2
-
-
1 hour ago, Ginx snewx said:
A great indicator for Australia though
I agree but a -IOD can enhance Walker Circulation = more robust convection over Maritime Continent = potentially more robust NPac Jet which can influence what infiltrates the Lower 48. This is one area that I think more research is needed to get a better grasp to specific impacts but from a general understanding this is what transpires.
-
4
-
-
10 hours ago, weatherwiz said:
Indian Ocean definitely has my interest as well and something I want to study more. In fact, I want to do much more with that area of the globe...not just for seasonal forecast but for long-range (talking 7-21 days) winter forecasting as well. I think that if we have a strong understanding of how models are performing across eastern Asia and the Pacific and how the PAC may begin to deviate there...that can give us immense clues about what we can anticipate here. This kinda gets into things like the AAM and mountain torques.
I think the IO is one of the most underplayed influences in long range forecasting. Meteorologically still more to be discovered but it is a known driver of the NPAC jet which obviously has downstream impacts.
-
1
-
-
What is the main difference between the two? They both appear to have the same functionality.

Texas/Oklahoma Discussion & Obs Thread 2022
in Central/Western States
Posted
Yeah the ECMWF hasn't done well with these shallow, cold air masses which explains why they are leaning colder. NAM could be too cold but I think leaning that way is good at the current lead time.