

It's Always Sunny
-
Posts
1,947 -
Joined
-
Last visited
Content Type
Profiles
Blogs
Forums
American Weather
Media Demo
Store
Gallery
Posts posted by It's Always Sunny
-
-
9 hours ago, 40/70 Benchmark said:
Its no coincidence why this composite gives us the warmest look...its west-based.
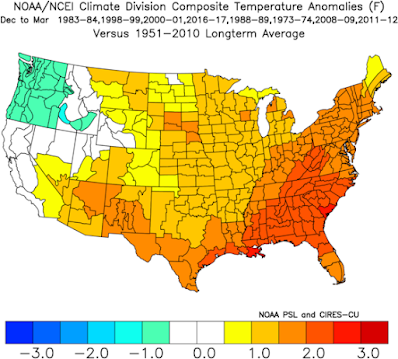
Yeah I don't think there is a right or wrong in something like we said is pretty subjective and we are all for the most part in the same line of thought. Anyways, I updated the La Nina composites that I already had and comparing what I had for CP La Nina versus what you had for WP La Nina they're actually pretty similar despite the years not being identical, with warmer than average temps mainly across central-eastern US, which makes sense. If you jump onto my website though you won't see that close of a correlation because I used the 1991-2020 climo which now has me contemplating changing it to maybe 1981-2010 and just keep it a sliding interval because my temp/precip anomalies are washed out because 1) I am using a -10-->10 contour interval w/ increments of 1 and 2) New climo raises ground zero so much that it's hard to discern anything unless it is "super anomalous" imo. Below are different samples of the same years, with my website image on the left, then the following two with different climos and intervals. Ahhh.


-
10 minutes ago, 40/70 Benchmark said:
I feel like you may not be coming up with a modoki composite because your criteria is too stringent and exclusive....ie, are you looking for seasons that did not have any la nina strength (-0.5C or cooler) at all over the central and east Pacific? If you look at the verbiage in my composites, that is a reflection of the criterion that peer reviewed, academic pieces use...like "small cooling" and "weak anomalies" over other sections. IOW, a west based event need not be entirely void of la nina caliber anomalies in regions further east, they just need to be very weak from around 150W points eastward, with the strong emphasis west of 150. It may help to look at the visual SST composites of my three groups for a more vidual representation.
I have several instances where there is a strong emphasis west of 150 but what Paul has in his is west of 170 which I had one borderline instance but nothing else. West of 150 with not much more west of 170W is still a CP La Niña to me.
-
I reevaluated my composites and after some thought decided to create a La Niña basinwide section. Most of it matches Paul’s. Didn’t create a WP section since everything I have on my end didn’t fully seem to fit that criteria. I may add some more years to my website however haven’t gotten to evaluating them yet.
-
Going through my ENSO composites and comparing them to Paul's I found that a lot of what I called CP La Nina, Paul calls Basin Wide. I also have no bucket for WP La Nina, where for me those are CP. I don't think this makes a huge difference but I also have my composites running between Nov-Mar to parallel how NOAA PSL does it. In addition, my contour intervals are fixed which allows for specific anomalies to pop out more than the Reanalysis page which could water things down a bit. I don't think either of us or right or wrong but just shows how much subjectivity is out there which could lead to different results. After looking through everything I do think I should sift through my composites again and make sure I have everything in the correct category per the definitions that I think we all three agree on.
-
 2
2
-
-
14 minutes ago, 40/70 Benchmark said:
Go look at the composite from my outlook last season. There were certainly discernible differences by structure and intensity of ENSO....temp, precip, vertical velocity (forcing) and H5.
I'll go back and check it out. For the composites I put together, some have a "general" pattern/look for certain ENSO setups but there are also instances where I saw a mix of different outcomes which I'll follow up with later.
-
Great stuff, Paul. I just recently posted a bunch of composites on my website as reference but your post comes at a good time. Sorting through the composites I’ve noticed that it is hard to say with conviction that certain ENSO structures frequently correlate to specific winter outcomes (temp/precip anomalies). To me, I am seeing more of a mixed bag of results and due to the small sample size it is hard to completely determine the cause and effect. Even analyzing 500 mb gph anomalies doesn’t always match up with what you would expect. Obviously there are other external factors involved but I now don’t give ENSO state as much weight as I used to. There are so many different flavors of it and this may be another area of research but I feel like the phase evolution of ENSO also may play a role in things (whether it is in a strengthening or weakening state) which is masked by the static indices. I’ll add more musings later when I have the time but just wanted to share my initial thoughts on this because I feel like we are on the same page.
-
18 minutes ago, brooklynwx99 said:
for sure. my initial thought is that the flavor of this winter will be similar to last, but we should shift the cold / snowy period up a few weeks. like mid December to early Jan
also... the PDO looks much improved thus far. it can change for sure, but this is a good look initially with all the warm water off the WC
if this remains heading into November, it bolsters the case for a wintry Dec
I'm interested to see how the PDO index for August looks given what appears to be a warming trend there since July came in at -2.48. -PDO appears non-existent now. That nuked GoA could make for an eventful winter.
-
11 minutes ago, CoastalWx said:
It is. It's amazing how many people get off to that. Here's the safe zone George. Sometimes lol.
I’ve only been active on Twitter for a couple of years but it didn’t take me long to realize that unfortunately for some people on there that is their sole identity.
Yes this is a safe zone, sometimes lol. Maybe I can become a cult leader on here if I forecast an active winter

-
I swear Twitter is a forum to formulate a cult led by a handful of know it alls and a bunch of brainwashed weather enthusiasts
-
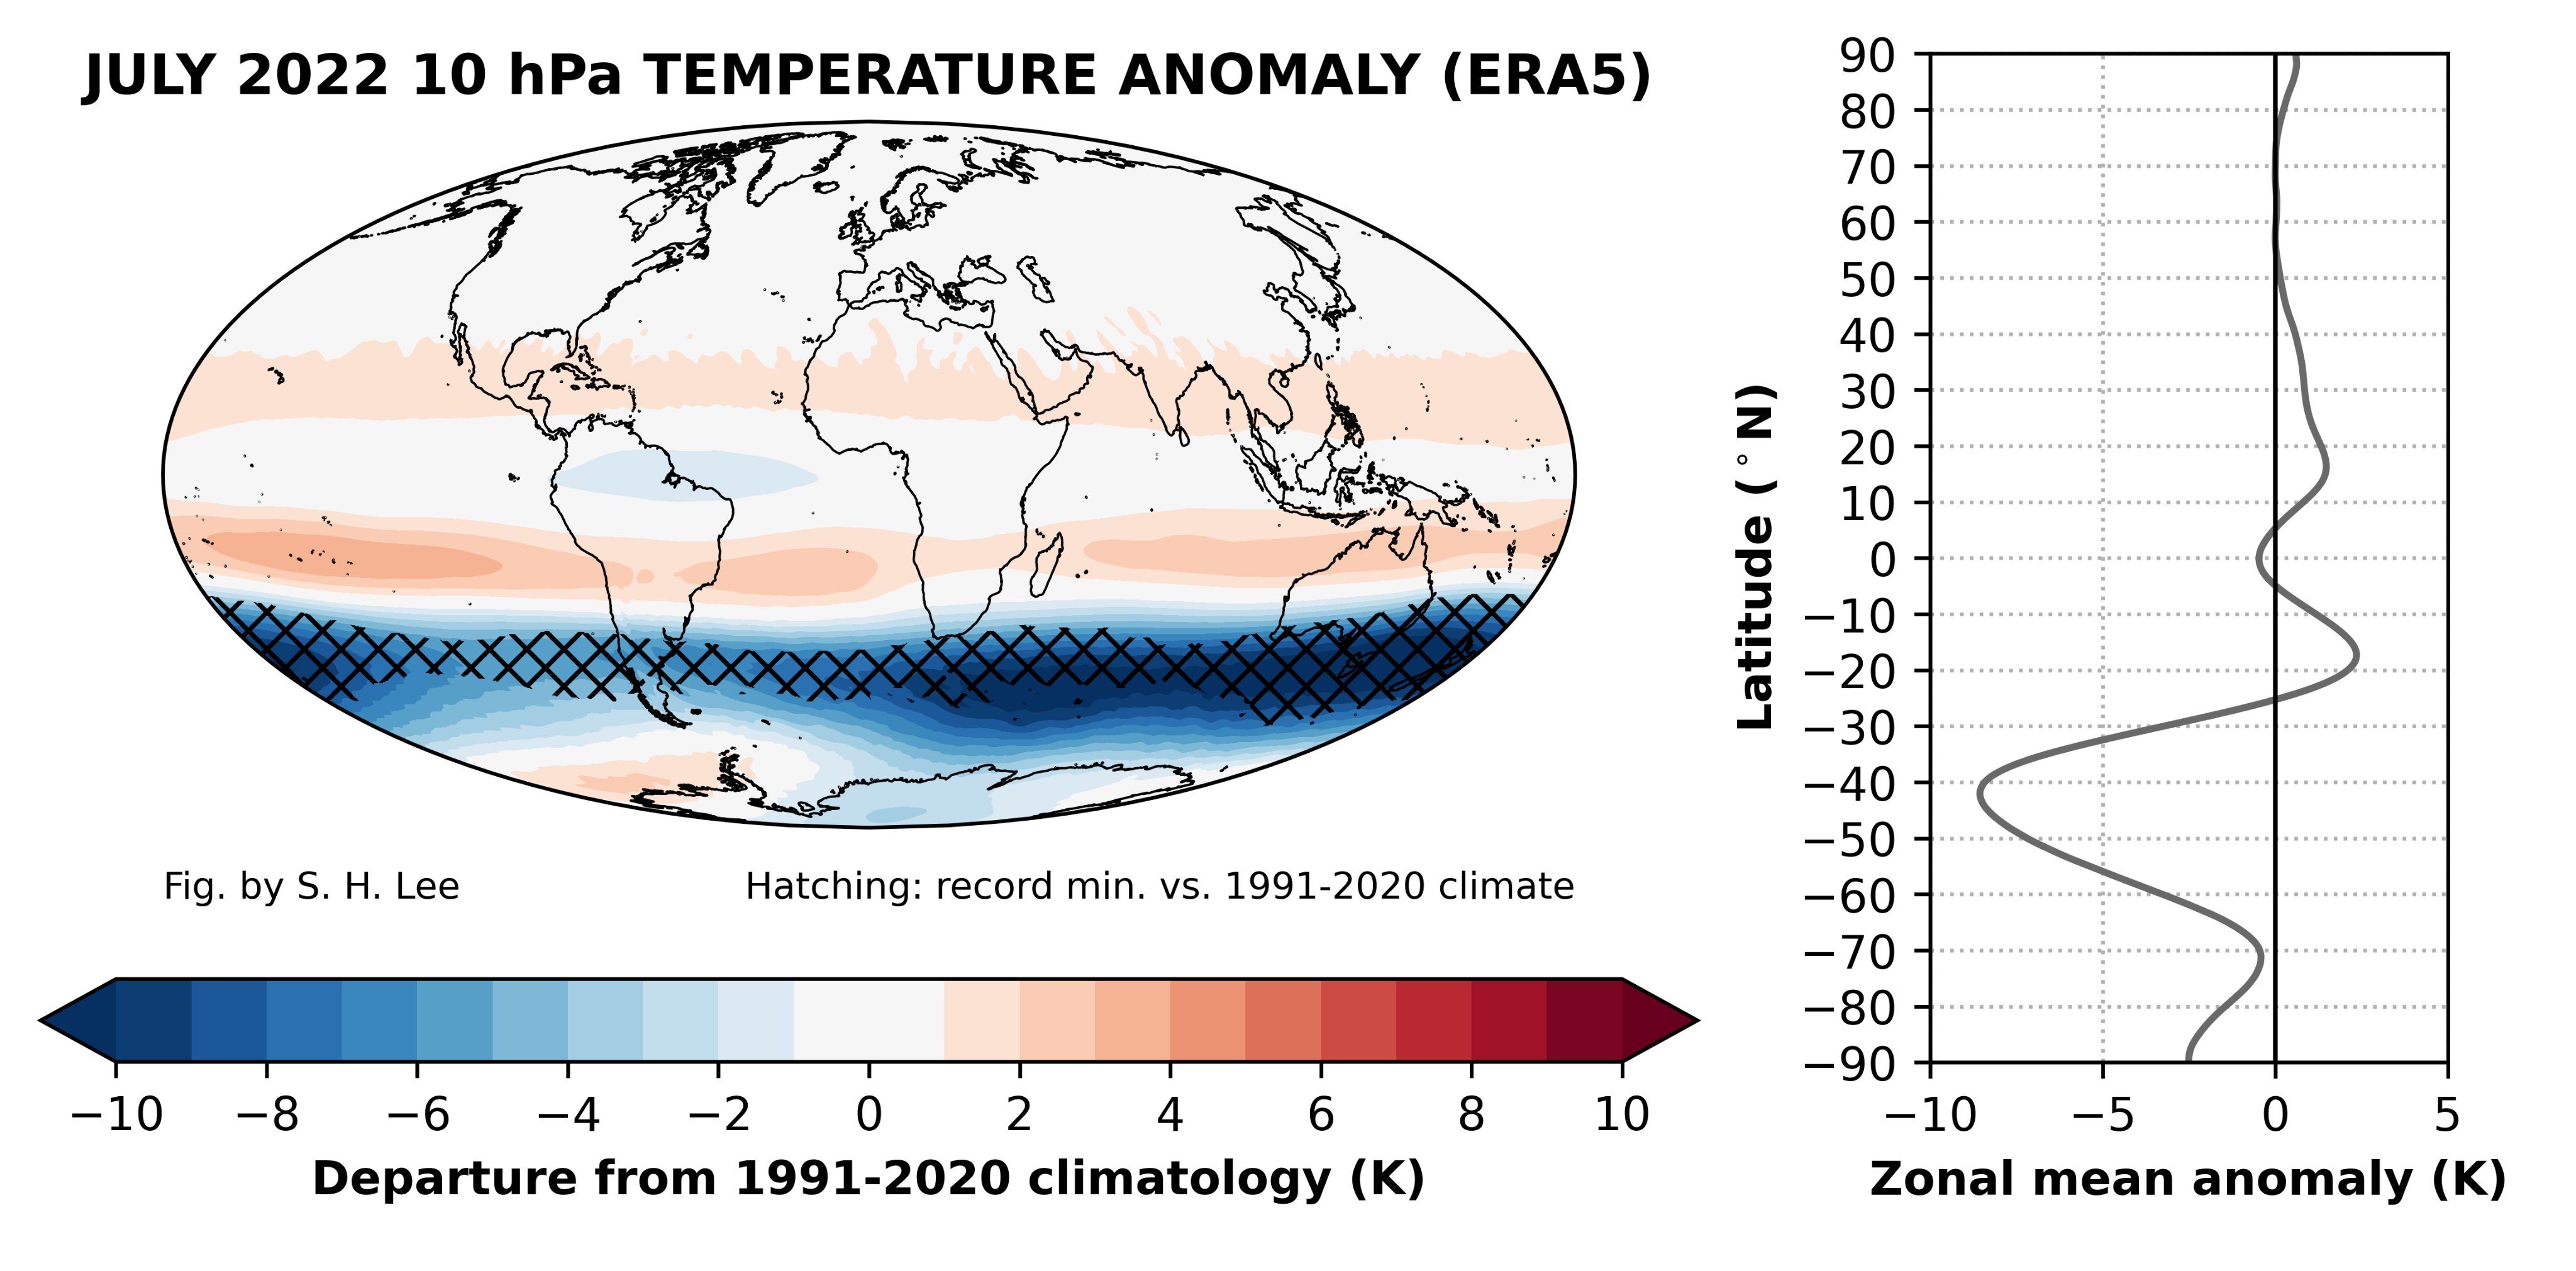
I also know this figure has been circulating but it's definitely interesting that we have this going on in the Srn Hemi and minimum tropical activity albeit things slowly picking up (for the time being). I'd be interested in any study that comes out linking hemispheric connections when it comes to volcanic eruptions. On a side note SAL & TUTTs have been cyclone killers this season. Parts of the NW Saharan Desert & western Sahel drier and hotter than normal this past month which could help generate more dust.
-
1
-
-
Still concerned about the big picture after ~9/10 conditions aren't forecast to be as favorable.

-
1
-
-
A couple articles I read believe volcanic eruptions can shift the ITCZ and/or lower SST/increase wind shear (however for this theory volcanoes that erupted only during El Nino were tested). From my understanding, no major eruptions occurred during a La Nina episode on record. I also read, similar to Raindance that Hunga Tonga had more aerosol forcing which has a larger impact. I pulled up some composites to see if anything was visible and you can make a case that convergence along the ITCZ isn't as strong as last year but I may just be grasping at straws since I don't notice a shift per se. There is noticeable veering >=10N and backing <5N which would support a weaker ITCZ in the Atlantic. Who knows...
-
On 8/22/2022 at 9:30 PM, It's Always Sunny said:
500 gph anomaly composites are up but they are out of order on mobile devices I recommend using desktop for time being until I fix it. Next composites I plan to add are temp/precip departures.
Temp & precip composites are added via NOAA/NCEI webpage. Rearranged the layout/format once again for easier readability. Best when viewed on desktop but mobile works as well just requires more scrolling. To view the galleries you need to click the image then you can pan left/right to toggle through the images. If you have a question as to why I categorized a certain year where I did, let me know.
-
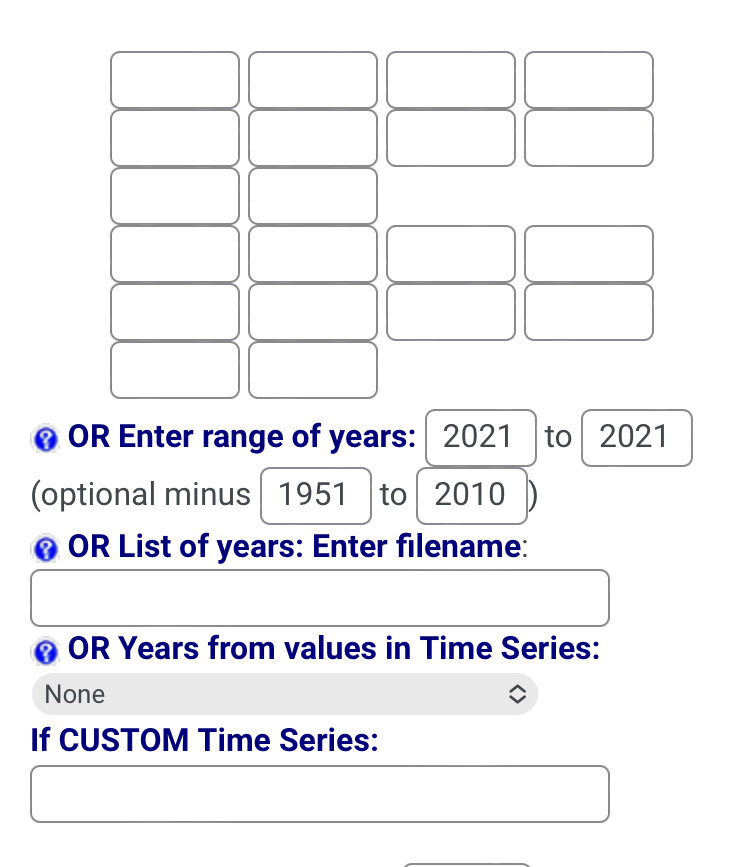
5 hours ago, ORH_wxman said:
You can use the subtraction comparison feature to regenerate the baselines from earlier. The only drawback is you can’t do a composite unless it’s a range of years in consecutive order.
Like for example, if you wanted to compare 2021 to the 1951-2010 baseline, you’d enter it like below:

There might be a way to do a composite of years against a custom range….that might be under “custom” time series….but I haven’t tried it before.
I wasn't aware of this type of versatility however when I plot it, it still says 1991-2020 climo at the top so does that mean it is calculating 2021's values off of 1991-2020 THEN comparing it to 1950-2010 baseline?
-
On 8/21/2022 at 9:53 PM, It's Always Sunny said:
I added winter (Nov-Mar) ENSO composites to my website. Feel free to take a look! If you find something out of place please let me know. There are likely a few since I've been focusing on compiling them (there are quite a few!). Eventually, I also want to incorporate 500 gph anomalies for the corresponding years for quick access and analysis.
500 gph anomaly composites are up but they are out of order on mobile devices I recommend using desktop for time being until I fix it. Next composites I plan to add are temp/precip departures.
-
36 minutes ago, 40/70 Benchmark said:
I need to go through the el nino events since 1950 and bin them by modoki level, like I have for la nina....probably this spring while in Africa.
But I noticed that you have 2009-2010 as central Pacific el nino; I distinctly remember that as being modoki....2002-2003, too.....1986-1987 was probably basin wide with a westward lean.
Ok thanks for the feedback I need to go through them again today and shift a couple around. I will be organizing it based on how the basin looks within that 5 month window. Also since Modoki is still an evolving area of study I feel like there are varying opinions on what is one and what isn’t. I feel like there are some pretty clear-cut ones but also a lot of ones that are arguably borderline, especially situations where the EPac is near average. That’s just my thought process but open to suggestions I’d like to make this a good, quick, reference source rather than having to go through the NCEP site every time or trying to remember something from 20 years ago.
-
I added winter (Nov-Mar) ENSO composites to my website. Feel free to take a look! If you find something out of place please let me know. There are likely a few since I've been focusing on compiling them (there are quite a few!). Eventually, I also want to incorporate 500 gph anomalies for the corresponding years for quick access and analysis.
-
12 minutes ago, 40/70 Benchmark said:
I actually don't think the IOD and nina are coupled....according to research, the IOD isn't directly triggered by la nina unless it's a new event that develops by early summer...year long and late developing events interact differently with the ambient atmosphere over the tropical Pac.
This is a big reason why I think the rug gets pulled out quickly this winter, regardless of the state of the subsurface in August. This will serve to give el nino a real head start and it will at that point couple with the IO next summer...probably another negative event.
I don't think they are coupled either but the Walker Circulation gets enhanced with a -IOD in place with concurrent La Nina. When the -IOD weakens late this year/early next year I think that's when the "rug gets pulled out", not to mention some unforeseen upwelling occurring between now and then that may weaken La Nina even earlier. I'm expecting La Nina to hold through the end of the year but I think once the calendar flips we could be heading into Neutral territory, with El Nino by next summer.
-
28 minutes ago, ORH_wxman said:
That's a good look though at least....we want the western region to warm while eastern region cools.
That warm pool out west in the subsurface is probably the fuel for El Nino in 2023-2024....
-IOD certainly helping the cause over the WPAC. Also a good time to take advantage of the Nina induced EWBs keeping that warm pool going and cash it in next year.
-
I have my sources for composites but with the ever evolving internet there may be something else out there...having said that, what do you use for SSTa composites? I currently use https://psl.noaa.gov/data/composites/day/ but not sure if there is something better out there. I know I can break out coding and do it that way but looking for something more convenient. Thanks!
-
ENSO neutral isn't a bad phase to be in either for Mass.
-
I can't connect to this.
Hm ok try this link
https://weatherchest.weebly.com/
I have it posted on my MA blog too if that one doesn’t work:
http://www.baystatewx.blogspot.com
.-
1
-
-
First shot at it. Enjoy!
https://weatherchest.weebly.com/home/preliminary-winter-outlook-2022-2023
-
 6
6
-
-
I think it's too early to write anything off but when you take potential ENSO phase, -IOD, +QBO just to name a few teleconnections I'd lean towards an average season with potential for above average. ENSO will still be presumably weak La Nina, maybe neutral, which generally fares well for New England. Remember, you can have a temperature forecast be "above average", but it'll still be cold enough for snow most of the time.Great…Another meh winter after a meh summeh.
*EDIT* I also want to add that the years a +QBO & La Niña overlapped is only a three-year dataset which is very small so I would not put a lot of stock into that. If you just look at +QBO alone the setup is rather favorable.-
1
-
Let's talk ENSO
in New England
Posted
That's how I approached my composites regarding SSTa, 500 gph anoms & surface temp anoms. Only exception was precip anomalies because it was far too variable so I allowed that to be a sliding interval. Using a consistent interval allows not only easier cross-analysis but also helps determine stronger vs weaker events/anomalies because everything has an equal baseline.
I have Nov-Mar 2010-2011 under basin wide but regardless, I understand what you're saying; since I'm having a hard time calling something "west based", a good approach could be to call them "east leaning" or "west leaning". I like it. Once I sort through more composites again I'll probably start binning them that way as my sample size grows.
Regarding the disco of using tropical forcing as a proxy for ENSO: While I think that's possible and a really good idea (and could be better than SSTa imo), I just feel like there are too many external variables that can impact velocity potential (or even OLR) anomalies beyond what is occurring in the Pacific Ocean. Also what anomaly period do you use for that which is another question. What about mean 500mb gph because then that way you don't need to use a climo period and not have to worry about SST changing. I think upper air patterns could be easily correlated with ENSO episodes but to discern what may be strong, weak or neutral could be tricky. Haven't tried it so idk but that's where my mind is heading. I've spent the past few days thinking about what climo period to use for my composites and the more I thought about it I think Paul's method makes the most sense because it classifies something "for that period in history" because it's not scientifically sound to use a current day baseline for an event that happened 60 years ago. Food for thought but maybe it's not scientifically sound to compare an ENSO event in the 1960s to one within the last decade due to the warming atmosphere (water and land temps). Not saying I agree or disagree with that but something I thought of. I like the idea of using 1950-2010 b/c it encompasses everything but 1950 vs. 2010 are also two very different time periods. Again I don't think there is a right or wrong but many subjective ways of doing it.