
ILMRoss
-
Posts
668 -
Joined
-
Last visited
Content Type
Profiles
Blogs
Forums
American Weather
Media Demo
Store
Gallery
Everything posted by ILMRoss
-
From what I understand thunderstorms oriented perpendicular to the storm track essentially act as a firehouse of moisture into a system, whereas storms oriented parallel to the storm track can basically act to cut off the conveyor belt of moisture by disturbing the inflow into the storm.
-
I like cranky, and I think he can have some moments of brilliance, but often I find his reasoning to be oversimplified... like right here. Gee, if it were as easy as looking at cirrus clouds, I'd be out of a job right now.
-
RGEM has a sharper, more negatively tilted wave as early as 36 hours from now, which is causing the stronger solution. I don't know much about how the RGEM handles synoptics but I wouldn't attribute the run to mishandling of convection.
-
My guess is that the suppression trend is partly tied to this: the trend is for the ULL to "landfall" into Baja California as a more and more positively tilted wave. This positive tilt has ramifications downstream for its orientation, how amp the wave gets, and where some temperature profiles set up because a more negative tilt can raise heights downstream.
-
Something I’d watch out for in this next suite is cyclogenesis along the Atlantic- so far not a single global has represented this well to my eye. The mesoscale models look more believable. Here’s what I mean: Cyclogenesis is favored to occur in areas where there’s already a distinct low level vorticity axis (think: frontal boundary! “Low level vorticity axis” sounds like an intimidating weather term but it’s really just represents a wind shift!) In CAD regimes, there’s always a super distinct axis just off the coast between the CAD Airmass and the coastal front. Thus, as that area has some lift imparted on it, you’d expect pressures to drop and cyclogenesis to initiate. The globals don’t show this. Here’s the GFS: it has not signature along the Gulf Stream at all... and I’m not sure I buy that. Here is the nam in comparison at the same time: In the nam, there’s a much more distinct signature of this taking affect, and this represents what “supposed” to occur in this scenario. I think this is helping toss everything more northward in the NAM. Now, obviously, meteorology doesn’t always bend towards what’s “supposed” to happen, as any seasoned weather enthusiast knows. That being said, I wouldn’t be surprised to see a “CAM vs Global” battle emerge today as more CAMs get in range. Lastly- CAM = convection allowing model- think NAM, RGEM, HRRR, etc. They don’t have to parametize convection with their higher resolution. .
-
All I’m going to say is, Fish loves ensembles, and Fish loves certainty, and the ironclad nature of 1 inch + totals on the ensembles have probably weighed on that team.
-
CAD actually warms the other side of the Apps. We’re all familiar with how cold, dense air “piles up” on our side, creating CAD. However, on the Tennessee side, there’s all of the sudden much less air making it over the mountain, which lowers air pressure (why you see an inverted trough here) and ultimately warms the area.
-
I spoke a little too soon, next frame the r/s line makes a bit of a comeback, almost back to the previous run
-
Solid 40 mile shift N with r/s line, weaker high here.
-
18z FV3 already looking like a pure weenie run
-
Wouldn't be surprised if there's a diminished gradient because more members are throwing some of that front end thump further east. that initial finger of precip extending ahead of the storm can be a doozy. I would still expect the main rain/sleet line to developed somewhere along RDU/CLT during warmest portion of storm
-
Really I wouldn't even focus on p-types much right now at all, not until the NAM-3km and RGEM has taken a couple of cracks at this storm. Until then, a rough guideline would be to take the modeled 850 0C line and imagine another line 50-75 miles north of that... there's your sleet zone between those lines. We're still talking NC snow, lol.
-
FV3 is fine, the low is going to gravitate towards the Huntsville/Knoxville area a little before the transfer because of the CAD forming lower pressures on the OTHER side of the Apps... One more thing to think about is the overall pressure field remains similar, but that little "L" icon is going to shift. It's there because Levi's or whoever's code puts that L at every local minimum... and in a transfer like this, that could be a lot of areas! Run to run, the "L" could jump by hundreds of miles, but in the grand scheme of things, it's probably not a big shift. It's a psychological thing! Be careful!
-
FV3 looked fine to me, a touch slower but overall maintained the same general r/s line.
-
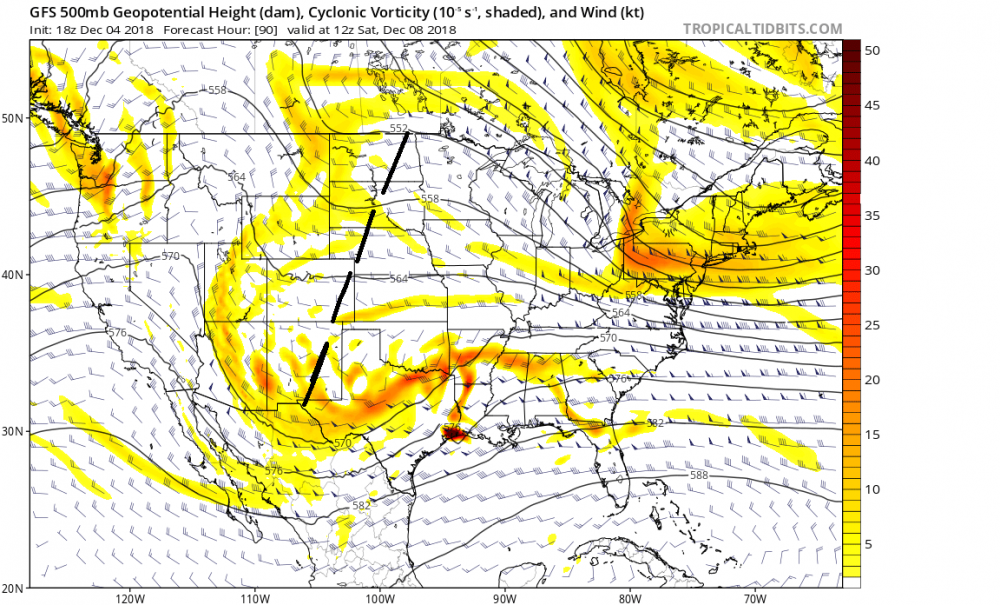
GFS is wild. Check this out. I got two trend gifs. First one is the 500 vort over Texas: So, there's some variation, and these differences are important! But for the most part, it's just noise, and the front end outcome hasn't changed much with this system. Now fast forward 24 hours later: There are worlds of differences here- vort maxes aren't just in different states, they're in different regions- Especially on the last 3 runs. This has a lot implications for how our trough is oriented, where the best lift is, where the SLP ends up, and consequently, where the high gets pushed. Don't really know what's going on upstream for the GFS to cause these differences. I also don't know if other models have this, it's just the first thing that caught my mind on the GFS. Any of these solutions are still probably plausible but it's definitely weighing on my mind that the GFS has no idea what's going on once this shortwave gets into the SE.

-
GFS looks like it lost that positive tilt it had in 18z so this run should at least be juicer in qpf, like previous non-18z runs
-
Blah, wish I could give you a straight up answer. Perhaps? Someone posted verification scores for all the models a few days ago which showed the FV3 was verifying slightly more accurately than the GFS. Based on that, maybe, but this is a question above my pay grade.
-
Two things: 1. Just because a low is jumping around doesn't make a model run unrealistic. Lows are going to jump to where the combination of vertical lift and low level spin are maximized. 2. 18z GFS FV3 was a pretty cool run. Caught a wide swath of people with significant snow. Seemed like a pretty reasonable run, as far as dynamics go. Let's hope that continues.
-
If I were chasing I would choose fancy gap, hillville, or Wytheville, somewhere that’s still going to get CAD bleeding in but also at elevation. Proximity to I-77 and route 52 or 58 is also critical, interstates and us routes will be plowed first and foremost making sure you don’t get stranded longer than intended.
-
There's also counties in that dma that are pretty far south of the triad. I think she is being a little conservative but it goes without saying that a full fledged "omg it's going to snow" message would freak people out, and if that forecast is blown less people may watch that station. There is palpable pressure, from the sales department to the news director, to have this right. Before I got into broadcast, I thought, "oh hue hue hue I'm going to be brazen and I'll speak my mind!" but it's *a lot* harder said than done.
-
18z got derailed very early on, when configuration of the parent shortwave got pushed *way* more positive over the southwest. This kind of put a positive slant on the s/w for the rest of the run and to me, really tampered with the dynamics, and created less qpf. Is it possible? I mean sure, but I'm not putting much stock in this particular iteration
-
Raleigh will be in the running for 1-3 inches of front end thump before switching to... something else. Learn from the NE from that mid Nov storm... that front end thump can stymie even the most experienced models and forecasters, especially with a solid CAD in place. Might not happen, but I’d keep an eye on that possibility. Lastly, I would not make any absolute statements about surface temps until we’ve seen a few cycles of the nam, raleigh still firmly capable of a significant sleet/ice event in my opinion
-
I don’t know how much of that is the Canadian’s depiction of the CAD, or its general cold bias (it always seems to have the coldest temps in general of all the storms I’ve tracked around here). When I still lived in Wilmington, that model was my saving grace a lot lol
-
Yeah, as others have alluded to, the NAM, and it’s 3km nest, usually have the most accurate depiction with CAD. The reason? I think it’s all resolution- since CAD is driven by topography, you need to accurately represent that topography to accurately model a CAD! The lower resolution of globals see mountains as 25x25 km raised lumps... while NAM and other higher resolution has the resolution to pick out individual mountains, valleys, ridges, and peaks. I think that is really important in terms of accurately modeling what kind of cold air bleeds down from the parent high, and how long it sticks around.
-
Remember folks, if the gradient isn't running through the heart of Wake County, then you can toss that snowmap. It's not verifying.