ncforecaster89
-
Posts
1,224 -
Joined
-
Last visited
About ncforecaster89

- Birthday 05/03/1970
Recent Profile Visitors


-

Major Hurricane Melissa - 892mb - 185mph Jamaica landfall
ncforecaster89 replied to GaWx's topic in Tropical Headquarters
https://x.com/twitter/status/2027850149855477851 -
Blizzard of 2026 Storm Thread/OBS
ncforecaster89 replied to Mikeymac5306's topic in Philadelphia Region
Here’s the data corresponding to the only two locations whereby I personally compiled top 10 lists a couple of years ago for this general area: Philadelphia, PA: 1) 31.0” Jan. 6-8, 1996 2) 28.5” Feb. 5-6, 2010 3) 23.2” Dec. 19-20, 2009 4) 22.4” Jan. 23-24, 2016 5) 21.3” Feb. 11-12, 1983 6) 21.0” Dec. 25-26, 1909 7) 19.4” April 3-4, 1915 8. 18.9” Feb. 12-14, 1899 9. 18.7” Feb. 16-17, 2003 10. 16.7” Jan. 22-24, 1935 New Brunswick, NJ: 26.9 inches January 2016 22.6 inches January 1996 20.9 inches Feb 2003 20.8 inches Feb 1961 20.7 inches Feb 2006 20 inches Feb 1899 19.5 inches December 1947 19.5 inches Feb 2010 18.5 inches Dec 1948 17.9 inches Feb 1983 17.0 inches Jan 2011 -
Blizzard of 2026 Storm Thread/OBS
ncforecaster89 replied to Mikeymac5306's topic in Philadelphia Region
I’ll add that I’m posting in this particular sub forum because I’m considering a chase to your specific area, depending on how things evolve over the next 12-24 hours. -
Blizzard of 2026 Storm Thread/OBS
ncforecaster89 replied to Mikeymac5306's topic in Philadelphia Region
I have no idea who “hurricane” happens to be, but I’m not surprised that they are “hugging the EURO”—as it’s the main fall-back approach for most forecasters. That’s not meant to be demeaning, but rather a reflection of the general consensus due to the EURO’s general superior 500 mb scores. That said, there’s still an ample amount of time for relatively significant synoptic changes to materialize that could change the current model consensus considerably. Right now, a blended approach amongst the Euro/UKMET/GFS/CMC/NAM would be best, in my opinion—which doesn’t simply place the latest Euro solution above all others. -
Hope everyone is, and has been, doing well. Just finished a short write-up on this 11th anniversary of the 2015 Valentine’s Day Blizzard—last of the four major SNE snowstorms that buried the region. https://x.com/tbrite89/status/2022830263093395652
-
January 30th- Feb 1st ULL and coastal storm obs
ncforecaster89 replied to JoshM's topic in Southeastern States
It was simply the result of deformation banding setting up directly over that area. -
January 30th- Feb 1st ULL and coastal storm obs
ncforecaster89 replied to JoshM's topic in Southeastern States
Here’s a look back at this truly historic and unprecedented event for the Tar Heel State (NC): https://x.com/tbrite89/status/2019523144395157791 -
The “I bring the mojo” Jan 30-Feb 1 potential winter storm
ncforecaster89 replied to lilj4425's topic in Southeastern States
The mesoscale (short range) models are the primary source at this point. However, the globals still have value in helping determining the track of the coastal low. -
The “I bring the mojo” Jan 30-Feb 1 potential winter storm
ncforecaster89 replied to lilj4425's topic in Southeastern States
It’s a direct consequence of the more eastward track and finding ourselves in the strong subsidence zone, while the more inland areas are in the deformation zone. There’s always going to be winners and losers in these type of setups…with a coastal low that’s bombing. In this particular run/solution, we are the undisputed losers. But like Josh noted, it’s still too early to pinpoint the precise location of these dynamics.
-
The “I bring the mojo” Jan 30-Feb 1 potential winter storm
ncforecaster89 replied to lilj4425's topic in Southeastern States
You’re correct in that the NAM is more prone to exaggerated dry slots than the globals (such as the ECMWF and GFS). Even so, the physics still apply and is a definite cause for concern. It was also seen on the 18Z ECMWF, as well. In both cases, the dry slot was directly over my house! -
The “I bring the mojo” Jan 30-Feb 1 potential winter storm
ncforecaster89 replied to lilj4425's topic in Southeastern States
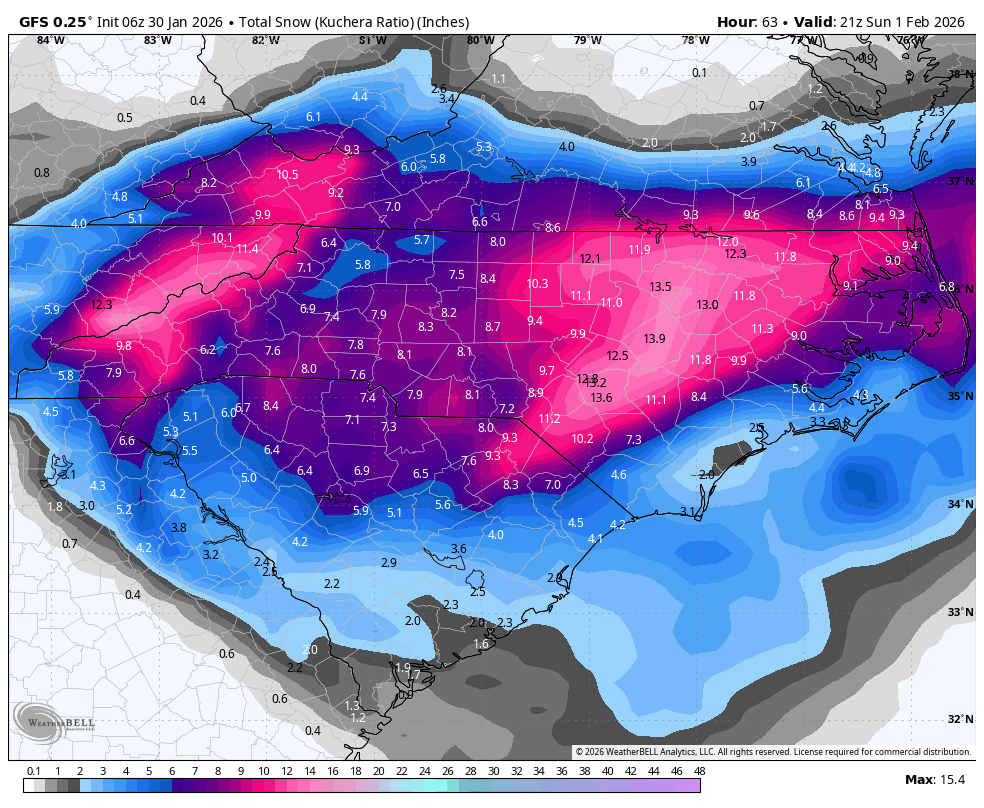
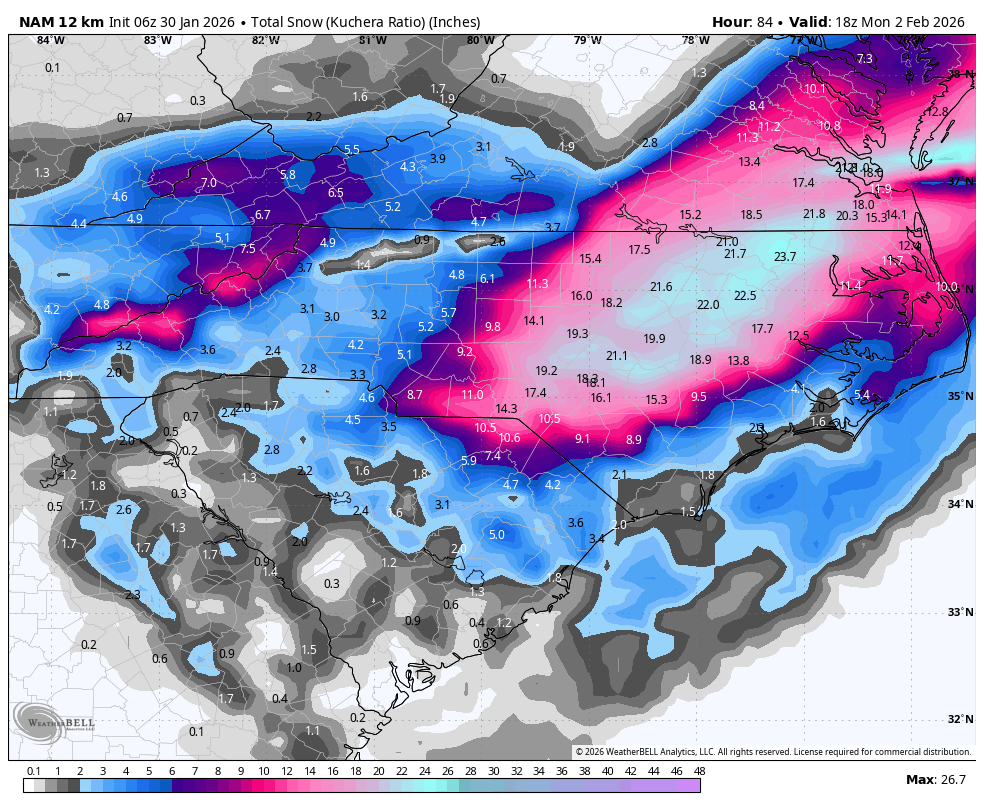
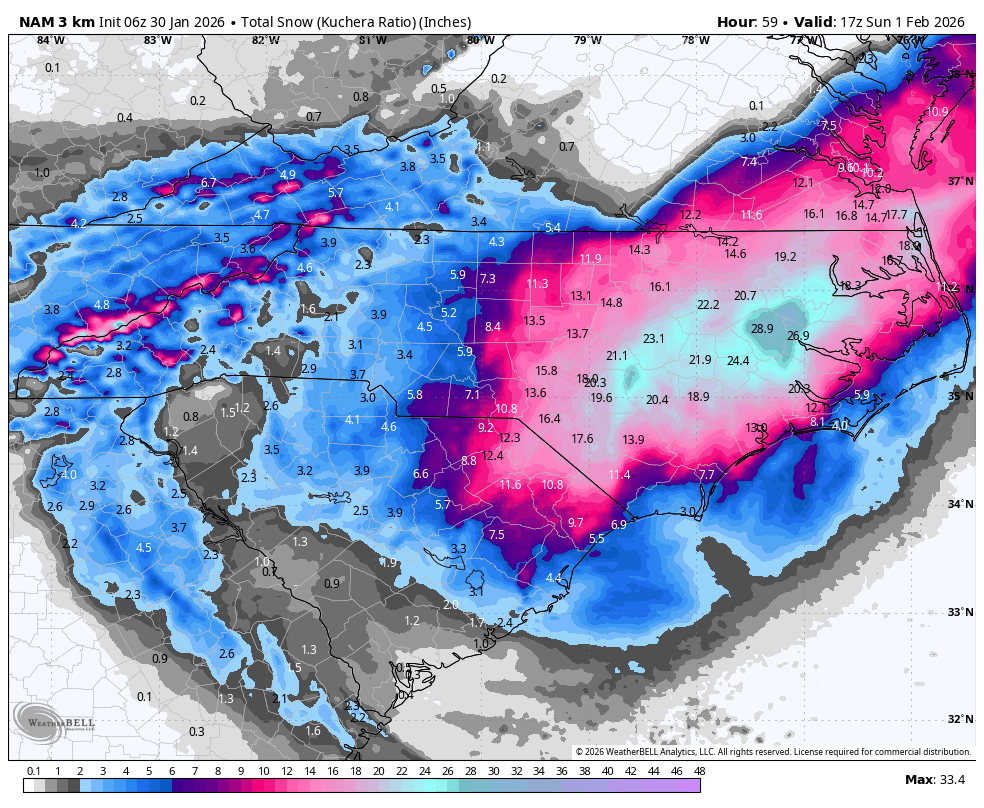
In simplest terms, it’s the result of the coastal low tracking farther offshore as it’s undergoing bombogenesis…where the deformation zone is positioned more to the north/northeast, favoring central/eastern NC and SE VA with high totals (10-20+ inches along the coast and inland). However, this setup allows dry mid/upper-level air to wrap cyclonically around the low's southwestern/southern flank from the southwest, creating a pronounced dry slot that intrudes into SE NC. The worst part of this particular scenario is that the dry air wraps in during the peak precip phase, leading to an abrupt transition from heavy bands (e.g., near New Bern/Kitty Hawk) to much lower/no accumulations in Wilmington and other SE coastal zones. That said, this is a common feature in these explosive coastal setups, especially when the low stays a bit farther east, as shown in that 06Z 12km NAM run. -
The “I bring the mojo” Jan 30-Feb 1 potential winter storm
ncforecaster89 replied to lilj4425's topic in Southeastern States
Horrible…being that I live in the “screw zone!”
-
The “I bring the mojo” Jan 30-Feb 1 potential winter storm
ncforecaster89 replied to lilj4425's topic in Southeastern States
How does this work for everyone? Edit: see I was late posting the map on the previous page.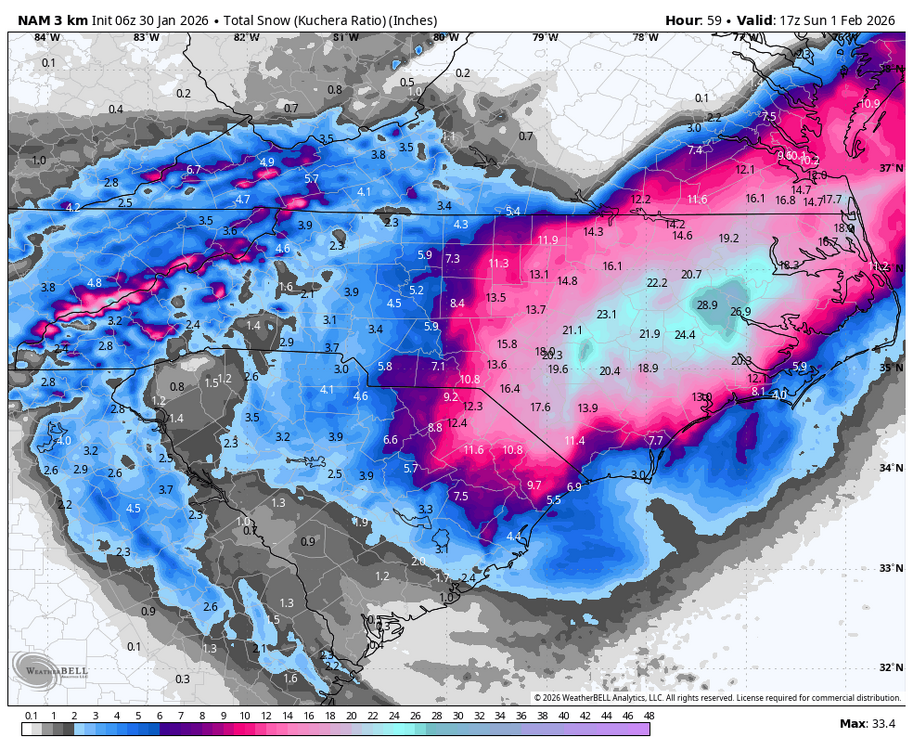
-
The “I bring the mojo” Jan 30-Feb 1 potential winter storm
ncforecaster89 replied to lilj4425's topic in Southeastern States
My previous post is gone, so I took the time to provide a new update: https://x.com/tbrite89/status/2017152042779689147 -
The “I bring the mojo” Jan 30-Feb 1 potential winter storm
ncforecaster89 replied to lilj4425's topic in Southeastern States
For those who might be interested, here’s my latest projections for 25 select locations along the east coast: https://x.com/tbrite89/status/2017125164824100896