

Quixotic1
-
Posts
21,788 -
Joined
Content Type
Profiles
Blogs
Forums
American Weather
Media Demo
Store
Gallery
Posts posted by Quixotic1
-
-
43 minutes ago, bubba hotep said:
Euro weeklies continue the theme of basically saying winter is over. At least if looks active moving towards March, maybe an early and active svr wx season.
2008 is a good analog IMO. Had some vicious severe weather.
-
10 hours ago, DoctorMu said:
Yeah, who knows. The QBO cycle appears to be disrupted by climate change...
I saw that. HM was tweeting about it. There was another met (I think Sam Lillo but get me to lying) that had done some work on it. Seems the theory was that the forcing from last year's El Niño was so strong it disrupted the QBO. One of the most regular oscillations in weather went AWOL.
-
6 hours ago, bubba hotep said:
The more I look at the QBO the more it appears to be playing a major role in the pattern. The wet California look is very +ENSO like but is also common during +PDO/+QBO winters. However, most +PDO/+QBO winters are also +ENSO, so the -ENSO is a bit of an oddity. I'm thinking that the +PDO/+QBO helps accelerate the atmospheric response to warming ENSO? The current run of +PNA looks a lot more like last winter than this winter and it looks to relax but then come back strong.

Yeah, I wish I had the data at my fingertips but the best way I can describe it is a stratospheric tendency. If you've got a strong force teleconnection wise such a strong El Niño or strong La Niña, the QBO isn't going to change it. However it can be an additive force. A strong with a +qbo is just going to amplify the enso signal. If it's negative, the hope for blocking is much better. When the Qbo kept going positive my heart sank. Just another nail in the coffin. Next year we should be negative. Emphasis on "should".
-
19 minutes ago, DoctorMu said:
Snow in Big Lake moving towards Junction. Not sure it will reach the Hill Country. Mountains in northern Mexico could be in for a treat.
http://www.corad.org/kftw_base.htm

Man that would be awesome! I hope someone south of here gets a surprise.
-
8 hours ago, bubba hotep said:
Wow, model trends are ugly as it gets right now. Winter seriously might be over with for N. Texas.
Got 11 freezes at DFW. Record fewest occurrences in a season is 14.
-
3 hours ago, bubba hotep said:
It was warm and sunny in DC today... what a wasted winter. I was really pulling for a big EC winter storm this week but instead it was cold rain and now beautiful weather. What a waste

Yeah. It's a bust so far. Maybe we can pull a 2008 type week out of there. That was another weak Nina after a Nino. It was really warm. Had one storm come through at night and gave us a few inches of paste after a 60 degree day and it was gone by noon as temps rebounded into the 50s. Had a bigger thundersnow event the same week where tarrant and Denton had up to 9" and Dallas got 1". Here in Collin we got about 3" but if it had been colder we could have been like Tarrant. Then it was gone. Severe season was good though.
honestly the QBO should have been taken in as a greater factor. It's strange behavior maybe should have indicated how things were more zonal rather than meridonal. Showed just how strong the Nino was last year.
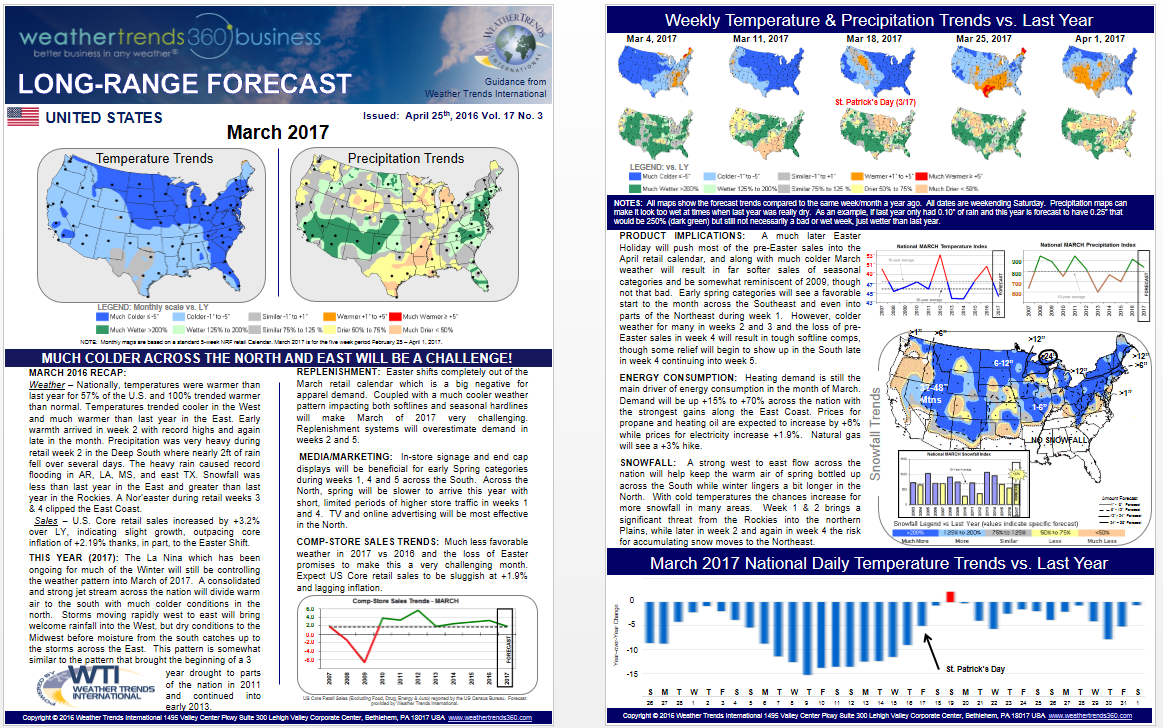
2 hours ago, raindancewx said:Do any of you follow Weather Trends 360? They have a pretty impressive track record for timing long-range precip/temp anomalies. They have 6"+ snow in March in Albuquerque. Almost the entire country 1-5F below last March (when it torched). Texas drier than last March. They have NM >=2x wetter than last year...but that isn't saying much, it basically didn't rain or snow the entire month. I've put the image below. Snowline is into the Texas Panhandle in March.

I haven't heard of them but it looks reasonable. It has to be better than last year because we torched. Hope you make out well though!
-
Reports of IP in N.Texas.
-
Nice work Bubbahotep! February and March of 89 were keepers. Both had surprise events that kept me out of work/school for a few days.
-
Runs like today are why I don't buy subscriptions. Ugh.
-
Storms are really moving!
-
This is a trip! Mammatus clouds with no storms!
-
2 hours ago, raindancewx said:
I was doing some research the other day using a Z-score calculator for a differences in proportions, and if you use an 11-year filter (sunspot/flux cycle), there are definitely clusters of notable weather events near certain parts of solar cycle here in Albuquerque. Used a p value of <=0.05 with the cluster in question compared to all others. In other words, was trying to see if "low probability events" become meaningfully more likely in a given solar year. I defined solar years as x+11, for each year from the 1930s to now, and then compared frequency in the cluster to all others. Most of the stuff I looked at didn't show a meaningful difference but some stuff did.
Low sunspots - frequently cold Jan - Apr. My math suggests we are in "year nine" of the solar cycle. Years 11 to 2 - and the cycle is 1-11, with 1 following 11 - tend to be remarkably cold in Jan-Apr at least once. I set 1931-32 (July-June as year one) with 1941-42 (July-June as year eleven).
My threshold for cold or warm is mean high 1931-2015 +/-2F - so you're essentially looking to see if something you'd expect to happen 20-30% of the time, given the hypothesis the sun has no impact, instead happens 80-100% of the time in the cluster, and it does in a few cases. Anyway, the sun controlling the NAO/blocking or whatever seems to have notable impact here Jan-Apr for making us cooler.
For precipitation the pattern was really interesting here - odds of "meaningfully" different clusters of dry/wet years exist in all periods of what the sun does. The three years heading into the solar maximum, July-Sept are very wet - but it goes in order, July initially (further from the maximum) then August, then September right in the July-June maximum year (i.e. we had 3.97" precip here in Sept 2013, solar peak was Feb 2014). A similar but slower pattern happens in the cold season - November is wet near the solar peak, then January a couple years before the minimum (i.e. now - and sure it's been very wet!) - and then Feb/Mar are very wet at and just before the minimum. September & April tend to be very dry just after the maximum, I think 7 of the 8 Aprils had no precip at all.
Also looked at odds of getting 3 inches of snow by month and cluster, to see if there were solar effects. January and April both came out as notably more likely (p<=0.05) to have >=3" snow in year nine here, which is this year. We've had a ton of rain this month, but not much snow yet - still possible though with three little systems coming in the next week. April has only had >=3" snow in six years, so it was cool to see 3/7 in pattern 9...given there are 11 patterns and given that is only snows here in April a quarter of the time! February, which is both cold/wet in pattern 11 (the year before the solar minimum) had a huge snowy cluster (5 of 7 years with 3-11 inches of snow...against 14 of 78 instances of >=3" snow all other years) in pattern 11 - so that should be fun in two years.
Interesting. I did something similar comparing land falling hurricanes in Texas and the subsequent winters. The chi2 plots showed absolutely no difference temperature wise (temps are the bigger deal here because of the lack of elevation) in all months except one: January. Winters after no Hurricane landfalls were more likely to be colder than warm. Cray cray.
-
1 hour ago, bubba hotep said:
Euro weeklies have time of death about Feb 3rd... just ugly.
Ugh. This why I avoid long range: either overhype or despair. I prefer old school teleconnections. I think I can talk myself into it with histograms rather than maps. Haha.
CPC has us BN days 10-14. Maybe?
i will say this: the current pattern will make for an interesting spring. I think we (the U.S. ) will have our busiest severe season since 2011.
-
6 hours ago, DFWWeather said:
I know it is on hiatus now, but the cold is definitely coming back in some fashion. Despite the positive PNA, the latest 2mb warming episode over the pole and the epo trending negative towards the end of the month and the NAO trending negative all point to the cold coming back end of next week into week one of February east of the Rockies. MJO in phase 1 and 8? Also, looks like a favorable 500mb pattern for snow and ice for us. Both the long range ECMWF, GFS, and CMC all support this idea. Check out latest 8 to 10 day 500 mb means. Arctic may even overtake the eastern 2/3rds of the CONUS by mid February.
I know but overall there's a "meh" kind of quality to it. NAO is going negative. Great for the east. EPO is going slightly negative so a shot of cold isn't out of the question. The PNA and AO argue against anything earthshaking. And that jet is insane. I see zonal and that is bad. Hope I'm wrong.
42 minutes ago, bubba hotep said:18z GFS is scary! Watch this be the one time it is right at 384 hrs


That jet is nuts for a Nina. Absolutely nuts. It's like they moved the ITCZ north about 20 degrees.
-
6 minutes ago, cheese007 said:
At least DFW got a dusting this year!
certainly better than last year. I can buy a real weather station for a real winter next fall.
-
Winter is on deathwatch.
-
Got a bunch of stuff in my yard that wasn't there this morning. Vent covers, shingles and what not. All the patio furniture got slammed.into the fence. First time I've seen that in 5 years.
-
12z gives us multiple chances. all of them close calls but I like that look better than one fantasy land bomb over our area.
-
Looks like outbreak of 1898 type stuff. Gimme.
-
15 minutes ago, bubba hotep said:
Good thing for this current system or it would be a two week snooze fest. Hopefully, the Pacific jet will relax and another -EPO will pop. Also, models are trying to get the MJO going, it would be nice if the next cold spell had a connection to some tropical forcing.
Phases 1,2 and 3. Not too shabby!
-
1 minute ago, cheese007 said:
Is this a "winter cancel" type scenario or just a break in the action? Bit new to this kinda stuff
I say that every winter/spring when it's boring and nothing to track. I'm still optimistic about later in the winter. Maybe end of January - Early March. Right now, there's little blocking to send cold air our way. Maybe some storms to track this weekend but it seems pretty "meh".
Strat warming about to commence. Never know where the dump will be though.
-
And then, depression set in.........
-
Heck, according to the 00z gfs nobody is getting ice. Even OK.
-
2 minutes ago, jhamps10 said:
Comparison time... Nam Friday morning.. 41 degrees... Gfs??? 64...
If it's going to rain, 64 please.
Texas/New Mexico/Louisiana/Mexico Obs And Discussion Thread Part 8
in Central/Western States
Posted
Looks like a fast mover. What I wouldn't give for some blocking.