

Isotherm
-
Posts
7,930 -
Joined
-
Last visited
Content Type
Profiles
Blogs
Forums
American Weather
Media Demo
Store
Gallery
Posts posted by Isotherm
-
-
1 hour ago, uncle W said:
its like the storm I talked about that happened near the end of Feb 1974...NYC 2"...Freehold 10"...1973-74 was a usefull analog...
Indeed, it was. The stratospheric warming wildcard was fascinating, as if that evolved more-so in a displacement rather than split fashion, January likely would have been colder. Retrospectively, the NAO will be near neutral December, negative January, and positive February. But the SSW prevented us from receiving the cold/snow results until later. I thought we'd have most of our snow this winter within a month stretch, but was off on the timing by about 15 days. The magnitude of the snowy period was more impressive than anticipated due to the -AO/blocking this winter.
-
 2
2
-
-
9 minutes ago, doncat said:
Congrats...3.7" here on si.
4 minutes ago, LibertyBell said:Monmouth magic strikes again
") 40" on the season?
40" on the season?
Thanks and almost - this event brings me to 38.9" on the season (31.1" since Jan 31st). Today was certainly the definition of a CNJ/Monmouth jackpot. It appears C-NJ/N-NJ, at least through today, has been one of the most favored regions snowfall wise relative to normal, in the DCA-BOS corridor. Our stretch of snow cover was 8 days in December, and Jan 31st-present thus far.
-
1
-
 1
1
-
-
3 hours ago, Isotherm said:
8.8" here, likely final total - Colts Neck, Monmouth County [reported to NWS via trained spotter ID]. This brings us to 37.9" on the season.
9.8" now total here.
-
2
-
 1
1
-
-
8.8" here, likely final total - Colts Neck, Monmouth County [reported to NWS via trained spotter ID]. This brings us to 37.9" on the season.
-
4
-
-
6.5" here so far - interior Monmouth.
-
5
-
-
Currently 12.2F with ground ice fog here -- a unique, rare phenomenon, induced by the deep, fresh snow cover. It was "freezing fog", but note that typically under 14F it is termed "ice fog" as the water droplets cannot remain in liquid forum.
-
6
-
-
5.1" total. 27.1" YTD. Current depth: 11".
-
1
-
-
One note on snowfall:
Snowfall is invariably the most stochastic, capricious and therefore most difficult variable to prognosticate from the long range, which is why I assign more weighting to temperature departures than snowfall at final verification. That said, the snowfall tally through 2/5/2021 has NYC at 28.0", slightly above my seasonal snowfall range. It is almost certain that this value will be increased, via, at least, light or moderate opportunities in the coming 10 days. Boston, currently around 22", has a ways to go to arrive at my range of 40-48", though that is still within the range of outcomes, certainly. The Mid-Atlantic cities are nearing my seasonal projections at this time. We will see how the remainder of this period progresses. However, for those certainly in the NYC area, it appears certain that a "positive" snowfall error will be occurring this winter, namely, more snowfall than forecasted. NYC will likely get into the 30s as far as snowfall. The evolution of the mid-month threat is subject to a number of different permutations and mechanisms. The equatorward/southwestward degradation of the block toward the Pacific is not ideal, as it could invite height rises in the Southeast US. Further to that, the MJO is somewhat out of phase and may tend to force SE-ridge resistance in the means. Contemporaneously the TPV will press from the north, as the SSW mediated block decays to its northwest. Overall, a highly convoluted and difficult to prognosticate variables. However, the rapid multi-standard deviation rise in the AO & NAO invite another large precipitation event opportunity. The PNA may not be as conducive this window, however, and that must be monitored. I'm not nearly as optimistic about this window as I was for Jan 31-Feb 2 along the Northeast/Mid-Atlantic coast, due in part to the more favorable mechanics of the block degradation in Jan 31-Feb 2. That said, Feb 12-14 is a window to monitor in the East.
-
1
-
-
On 2/3/2021 at 2:57 PM, 40/70 Benchmark said:
NAO does't look to cooperate through at least mid month....seems we both may have missed the boat on that, at least to a degree.

Indeed. While there is significant uncertainty as to the pace at which the NAO neutralizes in the medium to long range, I believe it's high probability as this point that DJF will average negative for NAO (barring an anomalous positive episode from mid month through the end of Feb, which isn't out of the question). The NAO finished -1.11 for January and -0.3 for December. January was expected, but the inter-monthly duration of the NAO was unexpected. The DJF NAO miss will go down as my first NAO formula miss in about a decade. And of course the AO domain, likely the most glaring aberration from the indicators I've quite frankly ever seen. The QBO finished +10 for January, continued strongly westerly. And while that in and of itself is not the sole determinant, there were other robust indicators pre-season that strongly suggested a neutral or positive AO mean winter.
I have been speculating/hypothesizing as to provenance -- the 2020 Australian fire induced aerosol dispersal may have been a factor in changing things up, possibly in concert with record low Arctic sea ice. But I think more likely the former. Regardless, the mean circulation flow altered significantly in the Arctic once December began.
As to February temperature departures, as you delineated in a recent post, it is possible the East Coast still finishes warmer than normal, depending upon the second half. The core of the cold will clearly be centered in the N Rockies-N Plains for the first half of the month. Overall forecasted temperature departures DJF still may fare very well; we will revisit that at the end of Feb. Snowfall -- New England looking good for a SWFE threat next week (potentially). And we'll need to monitor the window around mid-month as the blocking structure degrades.

-
2
-
-
13.8" total here, likely total. An additional 1.7" fell overnight/this morning. Year to date seasonal is 21.3".
-
3 hours ago, Isotherm said:
11.5" here. Light snow, 31F.
12.1" here now. Solid low-end MECS territory, if it were to be over. I thought we would receive 14-18" total (that band clearly developed 15 miles farther north, favoring N/C NJ into NYC).
However, it is possible we pick up an additional 1-3".
-
11.5" here. Light snow, 31F.
-
1
-
-
A major winter-storm is evolving across the Mid-Atlantic and Northeast, as signaled by the macro-scale proxies which suggest that a meteorological show will be displayed over the coming 12-36 hours. The appearance of this storm as much as two weeks ago was foreshadowed by the multi-standard deviation height field alterations over key domain spaces (specifically the PNA/NAO vicissitudes). As a result, this will likely be the largest, widespread winter storm since March 2018.
Estimated snowfall for various locations:
Atlantic City, NJ: < 2"
Point Pleasant, NJ: 5-10"
Trenton, NJ: 14-18"
Freehold: 14-18" - locally higher
New Brunswick: 14-18" - locally higher
New York City, NY: 14-18" - locally higher
Newark, NJ: 14-18" - locally higher
Philadelphia, PA: 6-12"
Sussex, NJ: 8-15"
"Jackpot" totals will occur via the juxtaposition of initial overrunning, maintenance of frozen p-type during the energy transfer, and the secondary redevelopment induced enhancement. This region will be approximately 1.5 degrees latitude north of the z850 low path, and N/W of the z700 low path -- NYC on the northeastern side, Morristown on the northern side, southwestward to near the Delaware River, then extending southeastward to Freehold on the southeastern side. I expect that there will likely be some 18"+ reports within the delineated zone.
-
7
-
2
-
-
20 hours ago, 40/70 Benchmark said:
I think its time to concede that @Isotherm and I were too aggressive to break down the blocking this season.
Monitoring the recovery of the z10-z50 stratospheric vortices as well as the subseasonal/MJO signal which will play a greater role in the month of February. At least, from the NAO perspective, it will flip positive early Feb (following the major storm/phase change threat, which finally showed up at the tail end of the Jan +PNA/-NAO pattern). Then the NAO may dip negative again in the Feb 5-9 time frame, but potentially only ephemerally. Coherent MJO 6-7 w/ magnitude is a +NAO signal, and depending upon the pace at which the SPV recovers, that may add adjunctively to a neutral or + NAO. The AO domain, I think may be a bit different, and that domain space will clearly go down as a miss this winter. The AO will probably average neutral to negative for Feb, if only by virtue of both residual +GP strat heights initially, but then the coherent MJO 6-7 assist will drive poleward EPO ridging into the Arctic domain. So the AO heights will receive assist from the Pacific induced intraseasonal alterations. My thinking at this time is the MJO expeditiously weakens in coherency beyond P7, so most of Feb should still feature the fairly robust SE-ridging in the means, and a colder Rockies/N Plains structure as forecasted.
Another player on the field is that Feb will have legitimate arctic cold on the North American side, now that the SSW is over. So the cold shots that do slide through the Northeast US will be quite strong in February. Fascinating winter overall, and from a LR forecasting point of view, particularly on the AO domain, a very rare outcome in terms of opposing certain indicators.
I still think February will probably be a snowier than normal month for most of New England (although warmer than normal in the means). SNE coast points southward will be dependent upon the extent of countervailing blocking.
-
4
-
-
The macro-scale physical forcing agents are conducive. After most of January +PNA/-NAO in the means and a few missed opportunities, favorability tends to reach a point of culmination during significant mass height field vicissitudes, e.g., as evidenced by the rapidly neutralizing NAO and PNA near the end of January. Meteorology being a probabilistically driven field, it always made/makes sense to emphasize that probabilities were/are heightened for snowfalls, but a deterministic guarantee that significant snowfall will occur is often imprudent beyond short range. Nonetheless, these lengthy wait times in conducive regimes are not uncommon (e.g., December 2010 wait time until very late month, near phase change). Here, we see the canonical jet retraction to off-west coast trough adjunctively with the decaying Hudson block/departing confluence, and amplifying Rockies longitude geopotential height rises. This should certainly yield a cyclogenesis event along the East Coast. The finer mesoscale details will be disambiguated, as everyone knows, in the coming days. But an energy transfer-primary-secondary appears fairly likely, with the potential for a z500 close off if the energies phase correctly. It's a legitimate threat within a legitimate, bonafide pattern, in fact the threat with the highest potential of success so far this January (verbatim, now, Jan 31-Feb 1). This still can imply a failure; that is certainly on the table. However, the macro-scale features in their phase changing capacities will almost guarantee an intensifying low on the coast, it's merely a matter of which region receives the brunt (on the east coast).
-
5
-
7
-
-
6 hours ago, 40/70 Benchmark said:
What exactly does the NAM entail? I haven't used that....is it like North American Angular Momentum?
Often used synonymously with the AO; Northern Annular Mode, a proxy which has geospatial overlap to the AO. I think we will flip to a +AO/NAO.
-
On 1/16/2021 at 1:35 AM, 40/70 Benchmark said:
Tom, are you getting uneasy about your Feb call? Starting to look like the PV may not recover for at least through early Feb....
Ray, Not yet. Historically and probabilistically, from the standpoint of the background conditions/forcing agents extant at this time (e.g., one variable being the QBO), almost always yield a robust reversal of the NAM status in month 3 (we will now have seen two consecutive months, Dec-Jan, of fairly strongly negative AO status). From a forcing perspective, the putative rubber band snap typically (much more often than not) occurs when the winter-night is still lengthy, as it remains in late January, auspicious for re-intensification (as opposed to a late Feb or beyond SSW event, which is a more energy intensive process to regain potent vortex status). Further, the tropospheric pattern, unlike earlier in the winter, does not appear conducive for major wave driving/energy transfer into the stratosphere beyond the end of the month. So while there may be some plateauing at the end of January sufficient to hold vestiges of blocking into the early part of February, I still tend toward the idea that the direction we're headed is towards a +NAM state. The temperature departures of significant warmth in the East may be slightly more in question, if early month can include much more countervailing cold presses. But we'll see how it evolves.
-
1
-
-
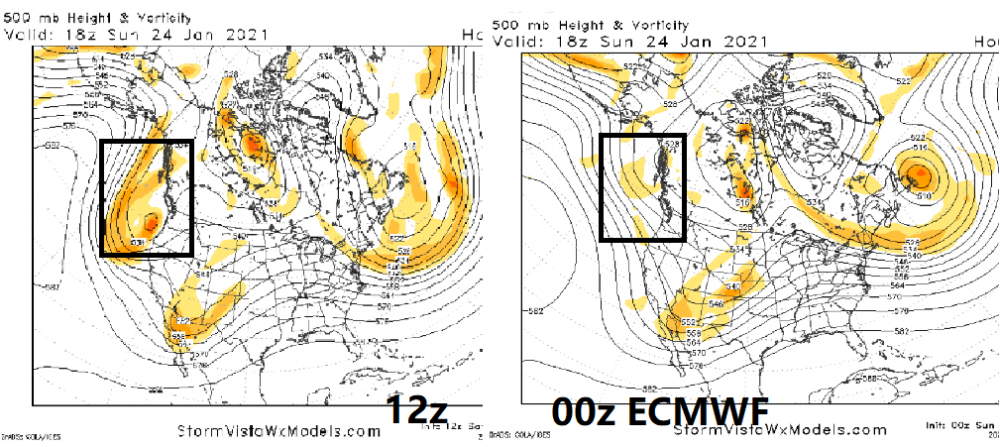
My brief thoughts w/ attendant illustration. The difference in outcomes b/t the 00z ECMWF and yesterday's 12z run (and by extension, other guidance), is largely predicated on the behavior of the short wave trailing the target short wave. Yesterday's solutions maintained significant magnitude/coherency w/ the trailing short, thereby keeping the front-running target short wave deamplified, and thus unlikely to "connect" with the Canadian PV lobe. The off-West Coast s/w trough is a key ingredient as to raising the putative ceiling on the downstream outcomes, as it provides the wave spacing to ensure deamplification until the "right" time, additional ridging in the Rockies, which aids in phasing and amplification at the most propitious times. The new set of solutions would still yield a winter event in the Northeast, but a lower-ceiling event. Which solution has more credence? The answer at this point is stochastic and effectively anyone's conjecture. The macro-scale features, inclusive of a westward retrograding, slowly degrading blocking structure, concomitant 50/50 positioned vortex, set condition precedents which significiantly increase the probability of wintry weather in the Northeast, as has been targeted for the month. The question as to the specifics of the actual system will be a function of the behavior of the incoming Pacific short waves. For snow enthusiasts, the solution to desire is a return to a larger trailing short wave which deamplifies the front-running initially, obviating early phasing. Full-latitude Western trough solutions would yield lower ceiling, energy transfer/SWFE type outcomes.
-
4
-
-
On 1/8/2021 at 2:48 PM, frd said:
@Isotherm Tom does this mean anything , enough to sway you that the event, although not a 5 day reversal, still might be considered major. Any thoughts would be appreciated.
The second dip and z10 split w/ mean zonal wind reversal for several days+, if it verifies, would attain the definition I described for major. As far as the real-world impact: it would aid in prolonging the +GP action center near Greenland, countervailing any increased SE-ridging resistance via the almost inevitable retraction of the upstream ridge by the end of January. The conducive north atlantic paradigm would thus maintain favorability in the Northeast/Mid-Atlantic beyond an ephemeral/short term window and potentially extend possibilities through the end of January. As it stands, these stratospheric outcomes do not alter my overarching thinking that mid-late January will provide heightened potential for snowfall in the Eastern US. Details remain indeterminate given the highly stochastic nature of snowfall, but I do not see any reason to abandon the notion that January will eventually produce wintry weather, to varying degrees depending upon locations.
-
3
-
2
-
-
53 minutes ago, 40/70 Benchmark said:
Tom, same page...that is the rationale that is utilized in the outlook back on 11/5. While I would like us to verify, I would also like a February 2015 redux, so forgive me for being a bit torn. lol
I feel as though even if we are correct about February, there could still be a substantial phase change event early in the month.
@LibertyBell I am also with Tom as to having some hope for March...hopefully its not like last season where the it happens too late.
Ray, indeed and I hear you re the internal conflict going forward. Certainly after the past few benign winters, it would be nice to have a longer wintry period. February's more canonical Nina z500 structure should tend to favor the northern and potentially even central New England at times for snowfall. So I don't think your area has as much concern to maximize the upcoming 2-3 weeks of potential (though the coming period should offer best opportunities).
-
31 minutes ago, frd said:
Yep. Ah the old days of 2002 - 2003 I remember - 4 and -5 up there.
An update from @Isotherm seems in order in regards to the SSWE.
Here is his outlook for this month:
January: z500 structure = neutral or +EPO/Near neutral AO/Near neutral or negative NAO/+PNA: this month, while still warmer than normal for most of the United States, will provide the highest opportunity for winter conditions in the coastal Northeast and Mid-Atlantic. Temperatures will be colder than normal across the Lakes and New England, near normal into the northern Mid-Atlantic, and warmer than normal elsewhere in the country. Snowfall will be above normal in the Lakes, New England, and near normal in the Mid-Atlantic.
@frd, see my outlook thread for continued updates (below). As emphasized awhile ago, I would repeat that stratospheric warming events are a reaction/product of tropospheric forcing, and the feedback outcome is dependent upon tropospheric receptivity, more integral than whether a subjective major definition is reached or not. In this case, the troposphere is well coupled, so it will promote at least a few weeks of blocking before disintegration. I still believe the coming period (through the end of Jan) provides heightened opportunity for snowfall in the E US. An important factor I'd monitor, esp. for the Mid-Atlantic and SE, is PNA tendencies upstream. It will be positive in the means, but the retraction toward the EPO domain/W PNA should occur later month, there will be more resistance in the far SE US via height rises.
-
3
-
5
-
 2
2
-
-
@40/70 Benchmark, the definition of sudden stratospheric warmings has been elusive, subjective and often capricious throughout the decades (see this paper, at least 9 different definitions): https://www.arl.noaa.gov/documents/JournalPDFs/Butler_et_al_2015_bams-d-13-00173.1.pdf You are correct that the common WMO definition of 'major' will be reached [mean zonal wind reversal to easterly at 10 hpa / 60N]. Other definitions, one of which I prefer for major ascertainment, is 60N/10hpa mean zonal wind reversal to easterly for a minimum of 5 consecutive days (see Simon Lee's blog: https://simonleewx.com/2019/01/24/the-january-2009-ssw/).
I've been monitoring this event, and it seems we may have an interruption in the zonal wind reversal in the coming 1-2 days [see ECMWF below]:
[note that the 10 hpa/60N zonal wind will probably hit or exceed 0 in the coming 48 hours, before slipping back easterly again].
https://users.met.fu-berlin.de/~Aktuell/strat-www/wdiag/ts.php?plot=fluxes&alert=1&lng=eng&hem=nh
So, we'll have to watch that interruption.
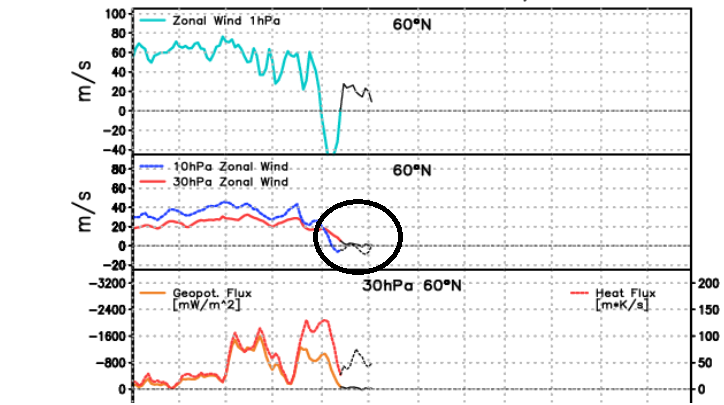
But regardless, the technical, subjective definitions don't matter much to me, as what is more integral is the tropospheric receptivity, downwelling potential, and resultant tropospheric response. The existing z30 westerly stress from the +QBO will tend to promote a more robust post-SSW recovery in my view, as well.
@LibertyBell, I believe there's high probability of NYC finishing in the upper portion of my snowfall range (low/mid 20s) with some potential for higher/toward average, depending upon the outcomes of the next few weeks (which I think provide the best opportunities for snowfall). In March, wavelengths are much shorter, and thus typically unfavorable winter patterns can become more serviceable - so I wouldn't be surprised if we had an event in March. I would still lean toward around 30" total or lower for the seasonal total. We shall see how it evolves.
-
1
-
-
Mid-winter checkpoint w/ my updated thoughts here:
Winter progressing in accordance w/ outlook thus far. Everything remains on track w/ respect to colder and more active January; most conducive multi-week period forthcoming.
-
1
-
2
-
-
Mid-Winter Checkpoint:
December = Thus far, the winter is progressing mostly in accordance with expectations. December finished +1.7 in NYC (within the range provided for in the outlook, +1.5 to +2.5). Most of the Northeast/Mid-Atlantic finished similarly. The core of warmth centered over the Rockies/NW Plains as anticipated, with a cool zone near Florida.
The +PNA verified as expected, along with the +EPO. The NAO for December was merely slightly negative. The principal error was the AO domain, which finished -1.7 (negative); this aided in permitting the significant snowfall for the NE corridor.
January = the forecasted mean +PNA/-NAO looks to verify. I see no reason to depart from the temp. anomalies forecasted. The highest probability for medium+ impact events of the winter exists in the coming multi-week period. The occurrence of the SSW is immaterial to the overall forecast, and a byproduct of the antecedent tropospheric forcing. This will likely be a significant, not major, SSW, and a non-vortex destruction event. This, too, has implications. The EPO may briefly move negative in the latter part of the month. The most conducive period for the SE US/Mid-Atlantic will likely be 12th-20th. Beyond the 20th, more resistance should develop in the far SE US via PNA diminution, implying the target zone may shift northward along the East Coast. The details are indeterminate and will be predicated upon wave/timing/propagation. Therefore, January 10th-31st should provide for greatly enhanced probabilities of wintry weather.
February = I expect a rapid disintegration of the coming multi-week pattern, with the genesis of +NAO/AO in concert w/ -PNA/Nina-esque Pacific structure. The delay of any negative PNA phase until February was/still is expected from my standpoint. It's possible the PNA may beginning transitioning as early as very late January. Sub-seasonal forcing should constructive interfere w/ low frequency forcing near the Maritime Continent, retracting the jet and forcing a more canonical Aleutian High/NW US trough paradigm. The stratospheric vortex should expeditiously redevelop to at least near average intensities by early February, and subsequently couple rapidly. Thus, I continue to think February will favor locations further north [N/C New England] for meaningful snowfall.


-
2
-


February 2021
in New York City Metro
Posted
Regarding the seasonal prognostication discourse, as someone who has been engaging in biannual long range outlooks (summer, winter) since 2006-07, with a high degree of success, I would state that the outcome which occurred this winter as it pertains to the AO domain in particular, (to a lesser extent the NAO), is very rare statistically speaking, wrt the indicators I analyze. The type of atmospheric alteration which occurred Nov-Dec and at the magnitude at which it occurred, was a nigh impossibility when considering the 1950-2020 indicator data. I expected the PNA+ outcome (Dec/Jan +, Feb -) and EPO+, and thought the NAO would go + Dec, - Jan, +Feb (but the DJF will be negative, a miss), and the AO severely negative was a major derogation from expectations. My formula that I utilize which incorporates several disparate variables and prognosticates the NAO at circa 90% success did not foresee this, thus, this AO-NAO outcome to me was a true curveball in the sense that the indicators actually supported an opposite average DJF outcome for the modality of the NAO-AO. I've determined upon analysis that the salient variables which emerged, in my view at least, could have only been potentially foreseen if I had waited another 10 days or so to write my winter outlook. There were red flags I noticed later in November that suggested the AO may not be positive for the winter. Overall, a very fascinating winter from the standpoint of atmospheric and oceanic nina-esque and nino-esque imprints. The SSW was a wildcard which disturbed the timing of the temperature progression, although the winter will average warmer than normal as I thought. I would hypothesize that a displacement outcome rather than a split may have allowed the colder January I thought would occur, but we ended up with a split, and a rather benign pattern for our -NAO month in January. The major stratospheric warming event was another highly unusual outcome given certain precursor signals, but the indicators did favor a perturbed and weak tropospheric vortex for January.