RodneyS
-
Posts
1,429 -
Joined
-
Last visited
Content Type
Profiles
Blogs
Forums
American Weather
Media Demo
Store
Gallery
Everything posted by RodneyS
-
May 2023 temperature forecast contest
RodneyS replied to Roger Smith's topic in Weather Forecasting and Discussion
DCA _ NYC _ BOS __ ORD _ ATL _ IAh _ DEN _ PhX _ SEA -2.1 -0.9 -0.2 -3.9 -1.7 1.2 0.9 -1.2 -0.7 -
I did have to update the numbers on February 1st, but since the snowfall at each airport remained below what every contestant had forecast, the relative outcome did not change one iota after the update.
-
Yes, January 2018 featured a lengthy arctic outbreak and it occurred during a Weak La Nina. January 4-7, 2018 at DCA featured a temperature range of 27/8. The four airports received 47.5 inches of snow that season, as compared with 48.1 inches durng the Moderate La Nina winter of 2021-22.
-
You're correct about the lack of precipitation -- just 9.19 inches at DCA during December 2022-March 2023, as opposed to 11.59 during December 2019-March 2020. December 2019 did not actually feature a true arctic outbreak, but the coldest day of the 2019-2020 winter season at DCA was on December 19, 2019, with a temperature range of 35/22. In contrast December 24, 2022 did feature a true arctic outbreak, with a DCA temperature range of 22/9.
-
You're welcome, and I'm sure that after your success the last two snow seasons, folks here will pay careful attention to your 2023-24 forecast.
-
I'm happy that this year's trophy is visible again -- maybe someone played an April Fool's joke on me.
-
See if this works:

-
If it's not as busy next year, it will be because of a complete shutout. Regarding the trophy, it loaded for me until I lost power at my home about two hours ago -- it is no longer loading. Perhaps a computer guru can fix. It should read the same as last year's trophy shown below, except the last two lines should be: 2022-23 Snowfall Contest/Little Village Wx

-
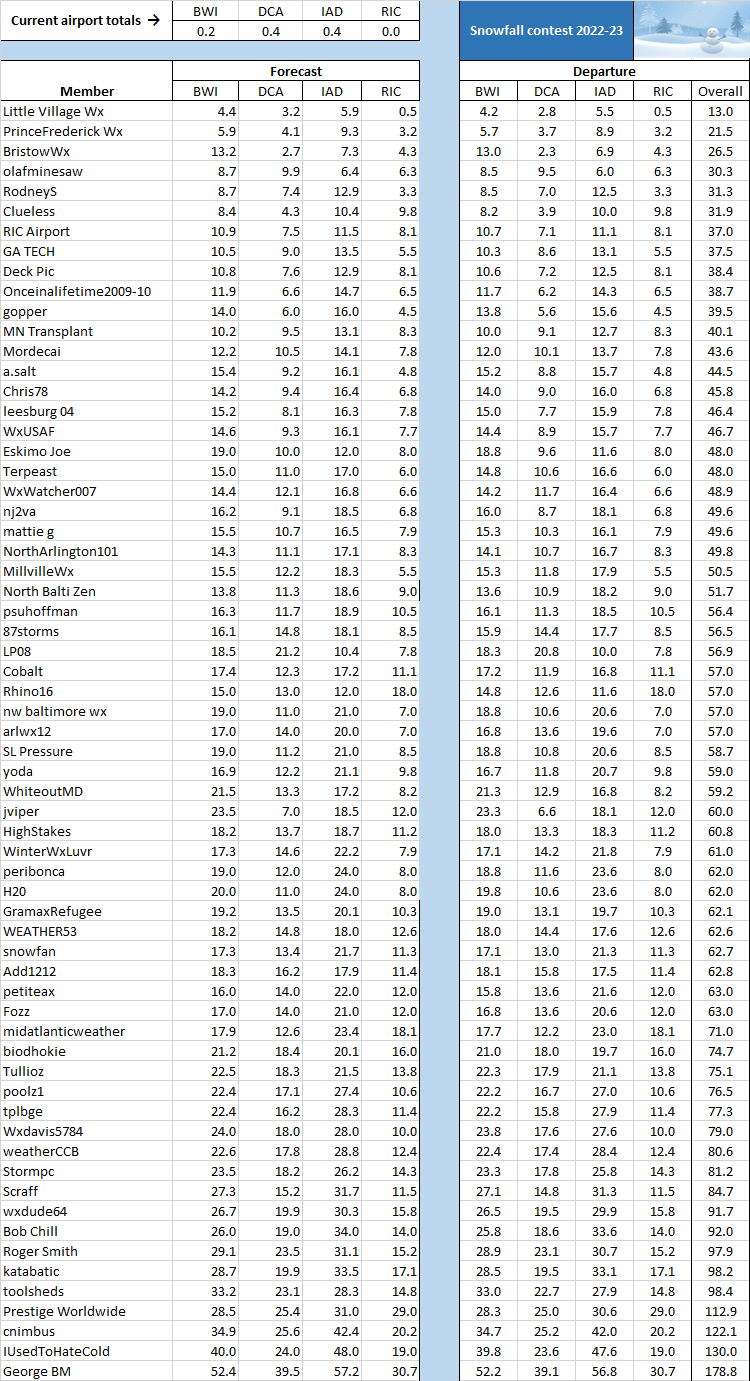
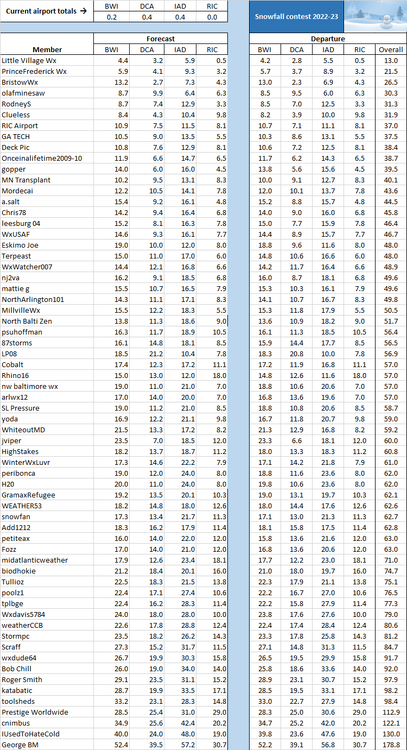
Indeed, but the previous record for lowest composite snowfall at the four major Mid-Atlantic airports that we use in this contest occurred just three years ago, during the ENSO-neutral winter season of 2019-20. That season, the composite snow total was 6.8 inches, comprised of 1.8 at BWI, 0.6 at DCA, 2.9 at IAD, and 1.5 at RIC. By the way, had history repeated itself and those same totals occurred this season, the order of finish in our contest would have been unchanged, although Little Village Wx would have had a negative departure at RIC. However, he would still have won handily, with a a total departure of 9.2 vs 15.7 for runner-up PrinceFrederickWx.
-
And your troll forecast edged out LIttle Village Wx by half a point! Of course, if anyone had done the Super Troll forecast of all zeroes, s/he would have been a runaway winner. Regarding February 1st, I have mixed feelings -- I did experience the excitement of sweeping away the snow on top of my car that morning, even if I did not experience the excitement of lifting a snow shovel.
-
Did you hear that the world's most accurate weather model is forecasting a foot of snow on Easter at all Mid-Atlantic airports? . . . No, I did not hear that either -- April Fools'. Like many others, I was not anticipating a banner 2022-23 snow season, but just 0.4 inches at Dulles? In 2011-12, we had more snow than that in October, and the previous low seasonal record holder at IAD was 1972-73, at 2.2 inches. And BWI even managed to undercut IAD this season, with 0.2 inches, breaking the all-time low Baltimore record of 0.7 inches set in 1949-50. RIC could not go lower than zero measurable snow, but did manage to tie 1918-19 with only a trace. That left DCA as the only one of our four airports where the low snow record was not at least tied, as the 0.4 inches recorded there was enough to place third lowest in DC history, leaving 1972-73 and 1997-98 as the co-record holders at 0.1 inches. Little Village Wx, who narrowly missed winning this contest last snow season, left no doubt about it this season. He shrewdly lowered his forecast from a year ago, although -- like everyone else -- he still went too high at every airport. Nonetheless, the writing was on the wall early this season that the lowest forecast overall total would win, as the much ballyhooed December 2022 polar vortex arrived too late to mix more than a tad with a low pressure system that departed the Mid-Atlantic on December 23rd. By late December, temperatures had warmed up, and snow lovers could only shake their heads the rest of the meteorological winter, as the first two months of 2023 brought record warmth. The early morning of February 1st was the only thing that kept the Snow Gods from pitching a shutout in the Mid-Atlantic. Our long-term administrator PrinceFrederickWx held out hope that a seasonably cool March and a decent storm track could give him the snow he needed to take the lead, but that did not happen, and so he had to settle for runner-up. Congratulations to Little Village Wx, and below is his championship trophy.
-
March 2023 averaged 49.1 degrees at DCA, 26th warmest March in DC history. However, because March 2012 was the warmest March all-time in DC at 56.8, January-March 2023 is only the second warmest quarterly start to a calendar year, at 47.0 degrees-- January-March 2012 averaged 47.3.
-
April 2023 temperature forecast contest
RodneyS replied to Roger Smith's topic in Weather Forecasting and Discussion
DCA _ NYC _ BOS __ ORD _ ATL _ IAH ___ DEN _ PHX _ SEA 1.2 1.1 0.7 -1.6 0.4 1.3 -1.6 -1.3 -1.2 -
The 2022-23 astronomical winter (December 21-March 20) and composite winter (December 1-March 20) at DCA followed suit, with each also coming as the third warmest in DC history. The former averaged 44.8 degrees, behind only 2011-12 at 45.9 and 2019-20 at 45.5. The latter averaged 44.3 degrees, behind only 2011-12 at 45.6 and 2019-20 at 44.6.
-
It's interesting that the Good Old Days also had some very warm winters -- it's just that they were much less frequent than nowadays.
-
The 2022-23 meteorological winter (DJF) at DCA was the third warmest in DC history, averaging 43.9 degrees on a true (90 day average) basis. Interestingly, two long-ago winters have it beat -- 1931-32 (91 days) averaged 44.7 and 1889-90 (90 days) averaged 44.3.
-
February 2023 was another warm one at DCA, averaging 46.7 degrees, good enough for third all-time in DC, behind only 2017 (47.7) and 1976 (46.9). Moreover, while neither January nor February 2023 broke the DC average monthly high temperature record, the two months combined did, averaging 45.9 degrees for the first 59 days of the year. The previous record-holder was January-February 1932, which averaged a full degree lower, at 44.9 for the first 60 days (60 days because 1932 was a leap year. However, if the first 59 days of 1932 are used instead, they also averaged 44.9.)
-
March 2023 temperature forecast contest
RodneyS replied to Roger Smith's topic in Weather Forecasting and Discussion
DCA _ NYC _ BOS __ ORD _ ATL _ IAH ___ DEN _ PHX _ SEA -1.2 -1.4 -1.3 -2.5 -0.6 1.3 -3.5 -1.8 -2.4 -
Wow, what a memorable winter storm! I'm talking, of course, about what happened today in the Winter Wonderland of Southern California. Here, it was business as usual; however, there may be some hope for March snow in the Mid-Atlantic, and if that doesn't work out, I'm working on an April 1st model that suggests that Easter here may be rocklng.
-
Speaking of warm, DCA broke the high temperature record for February 23rd today with a maximum of 81 (old record 78, set in 1874). That was the 4th 80-degree plus February reading in DC history, with the highest being 84 on February 25, 1930. IAD also broke the record today with a maximum of 80 (old record 77, set in 2017). That tied February 21, 2018 for the highest February reading in IAD history.
-
According to the profile, LittleVillageWx is a man who lives in Frederick, MD. He is threatening to be a wire-to-wire winner this season.
-
-
DCA finished January 2023 with the third warmest (of 153 years) January average temperature in DC -- 45.2 degrees. January 1950 is # 1 at 48.0 and January 1932 is # 2 at 46.8.
-
The IAD snow drought made it until Tom Brady's second retirement, and so February 1st is the new record for the latest day of any Dulles Airport winter season for the first measurable snow. I presume DCA also received measurable snow this morning-- BWI I'm not sure about. In any event, when the totals are announced, I will post an updated table -- not that it will change the relative standings, which show Little Village Wx with a comfortable lead.
-
February 2023 temperature forecast contest
RodneyS replied to Roger Smith's topic in Weather Forecasting and Discussion
DCA _ NYC _ BOS __ ORD _ ATL _ IAH ___ DEN _ PHX _ SEA 1.5 2.1 1.4 2.4 1.5 1.0 -1.6 -1.8 -1.6