Jns2183
-
Posts
5,838 -
Joined
-
Last visited
Content Type
Profiles
Blogs
Forums
American Weather
Media Demo
Store
Gallery
Everything posted by Jns2183
-
Central PA Fall Discussions and Obs
Jns2183 replied to ChescoWx's topic in Upstate New York/Pennsylvania
Ripping heavy finally Sent from my SM-S731U using Tapatalk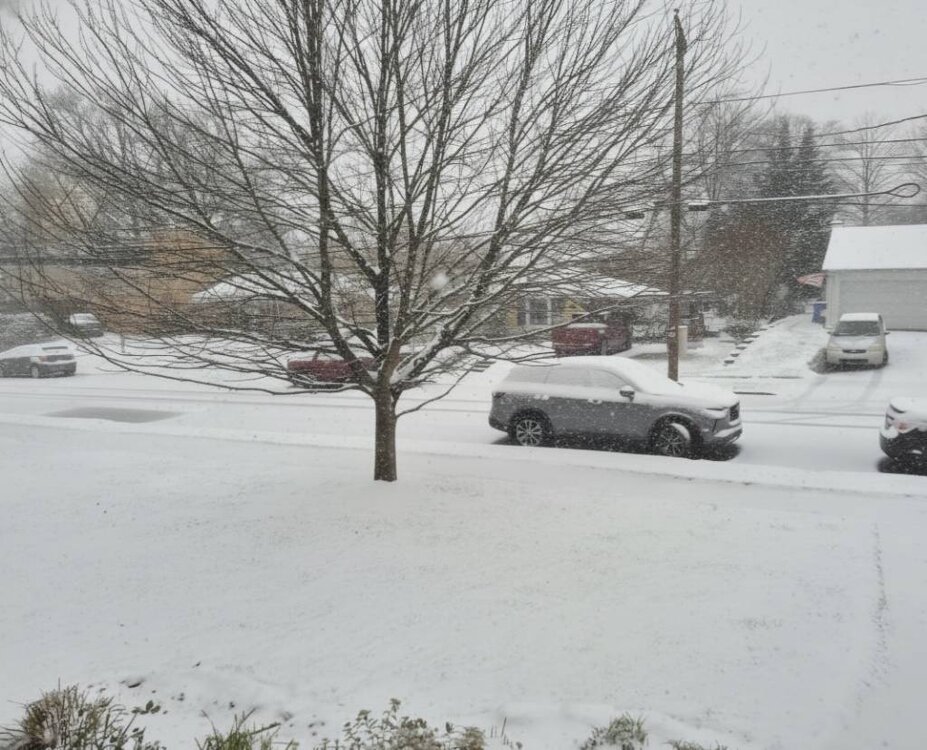
-
Central PA Fall Discussions and Obs
Jns2183 replied to ChescoWx's topic in Upstate New York/Pennsylvania
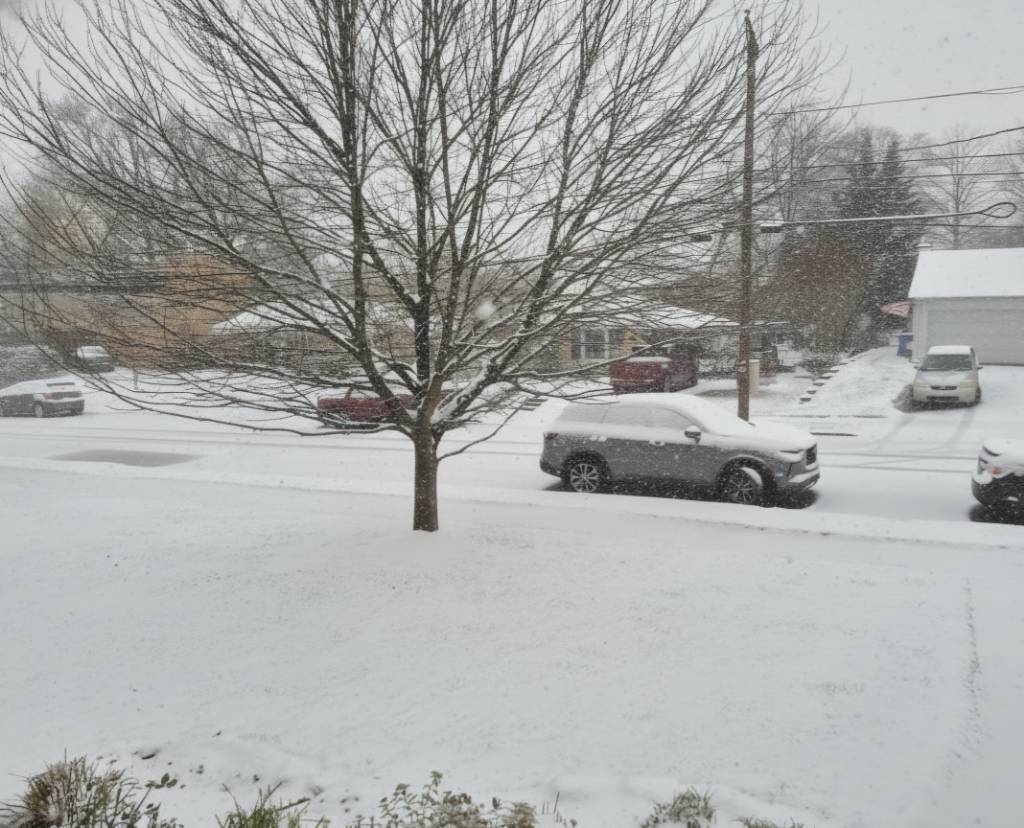
Big fat flakes, moderate snow. This batch here is the ball game. She should be done in 2-3 hours Sent from my SM-S731U using Tapatalk
-
Central PA Fall Discussions and Obs
Jns2183 replied to ChescoWx's topic in Upstate New York/Pennsylvania
In Camp Hill it's moderate snow still Sent from my SM-S731U using Tapatalk -
Central PA Fall Discussions and Obs
Jns2183 replied to ChescoWx's topic in Upstate New York/Pennsylvania
Where are you located again? Sent from my SM-S731U using Tapatalk -
Central PA Fall Discussions and Obs
Jns2183 replied to ChescoWx's topic in Upstate New York/Pennsylvania
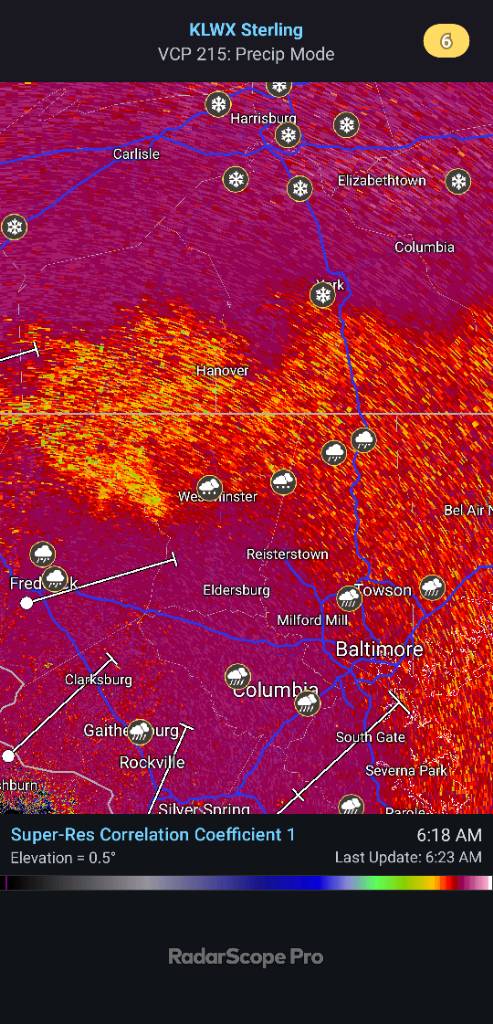
Updated line Sent from my SM-S731U using Tapatalk
-
Central PA Fall Discussions and Obs
Jns2183 replied to ChescoWx's topic in Upstate New York/Pennsylvania
Temperature has fallen from 32 to 28 currently Sent from my SM-S731U using Tapatalk -
Central PA Fall Discussions and Obs
Jns2183 replied to ChescoWx's topic in Upstate New York/Pennsylvania
The line Sent from my SM-S731U using Tapatalk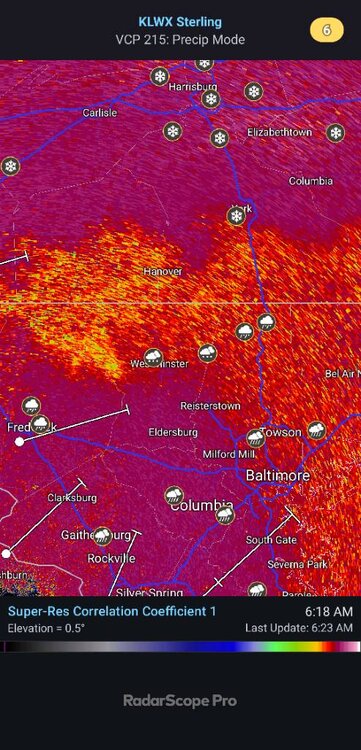
-
Central PA Fall Discussions and Obs
Jns2183 replied to ChescoWx's topic in Upstate New York/Pennsylvania
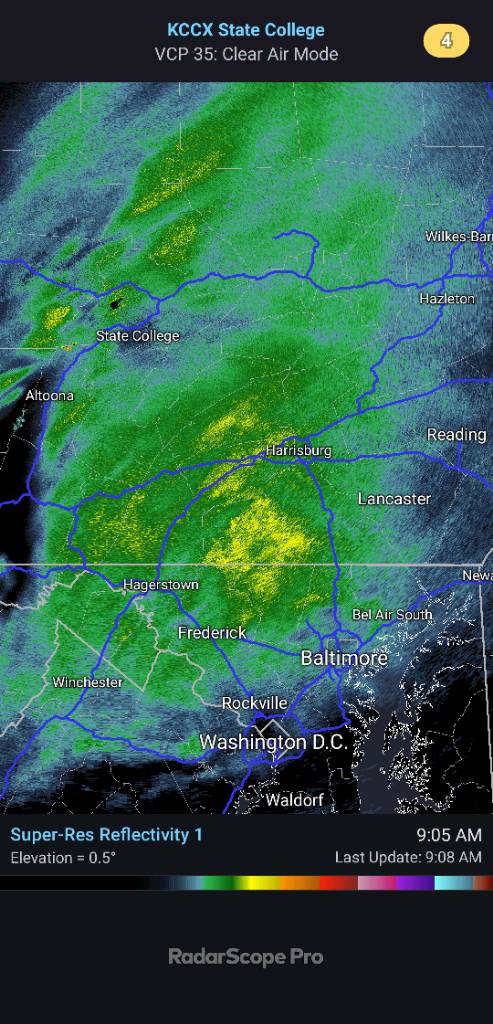
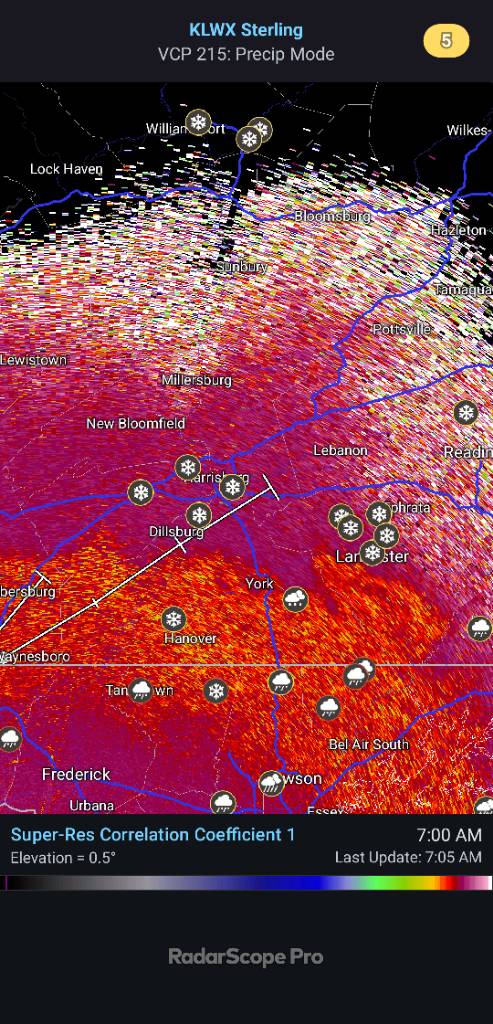
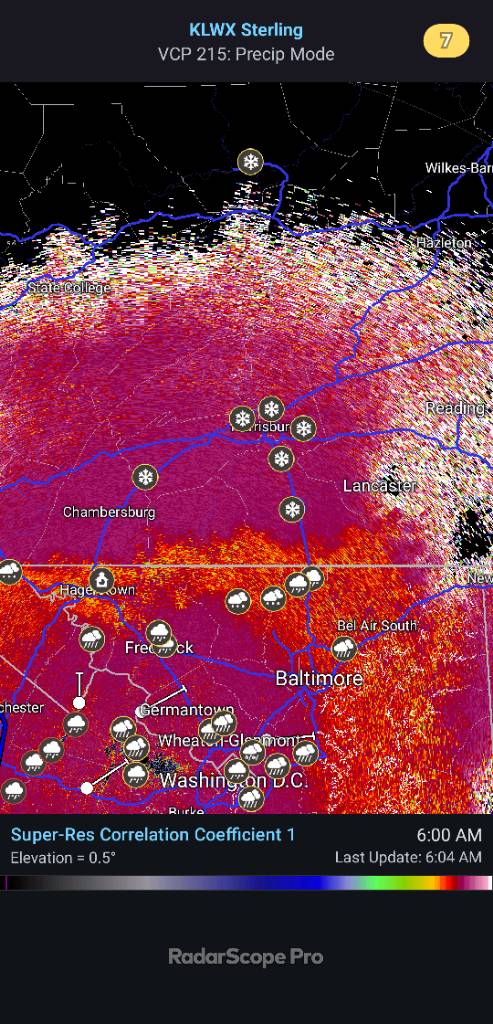
snow/sleet line is showing up well on sterling radar Sent from my SM-S731U using Tapatalk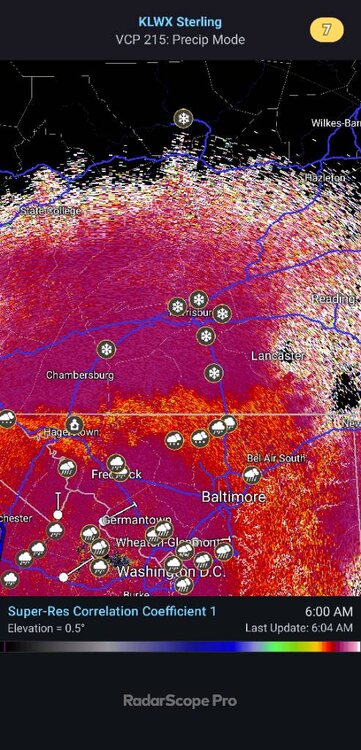
-
Central PA Fall Discussions and Obs
Jns2183 replied to ChescoWx's topic in Upstate New York/Pennsylvania
Where is your location Sent from my SM-S731U using Tapatalk -
Central PA Fall Discussions and Obs
Jns2183 replied to ChescoWx's topic in Upstate New York/Pennsylvania
The streets have caved Sent from my SM-S731U using Tapatalk -
Central PA Fall Discussions and Obs
Jns2183 replied to ChescoWx's topic in Upstate New York/Pennsylvania
She's ripping already. Good stuff Sent from my SM-S731U using Tapatalk
-
Central PA Fall Discussions and Obs
Jns2183 replied to ChescoWx's topic in Upstate New York/Pennsylvania
Fire going. Now trying to figure out a breakfast dish using last night's leftover thin spaghetti noodles. Maybe a frittata Sent from my SM-S731U using Tapatalk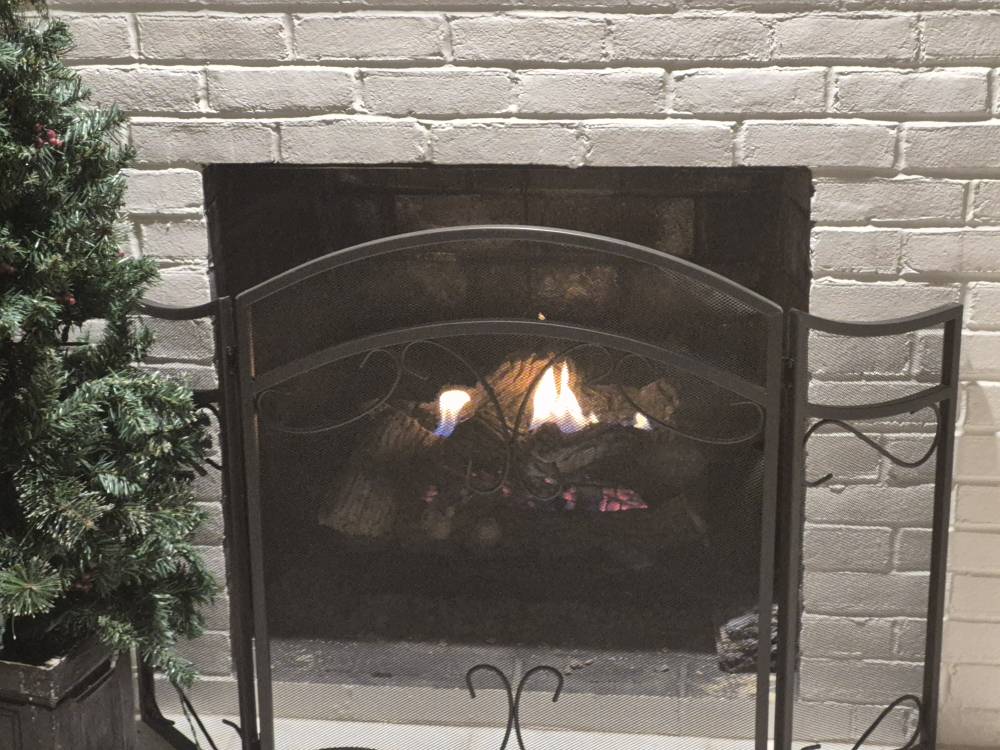
-
Central PA Fall Discussions and Obs
Jns2183 replied to ChescoWx's topic in Upstate New York/Pennsylvania
Cars are covered in camp hill Sent from my SM-S731U using Tapatalk -
Central PA Fall Discussions and Obs
Jns2183 replied to ChescoWx's topic in Upstate New York/Pennsylvania
From mping reports looks like it's snowing from state college to Shippensburg through Waynesboro. Sent from my SM-S731U using Tapatalk -
Central PA Fall Discussions and Obs
Jns2183 replied to ChescoWx's topic in Upstate New York/Pennsylvania
So many schools going with the 2 hr delay wait till 6am and see approach Sent from my SM-S731U using Tapatalk -
Central PA Fall Discussions and Obs
Jns2183 replied to ChescoWx's topic in Upstate New York/Pennsylvania
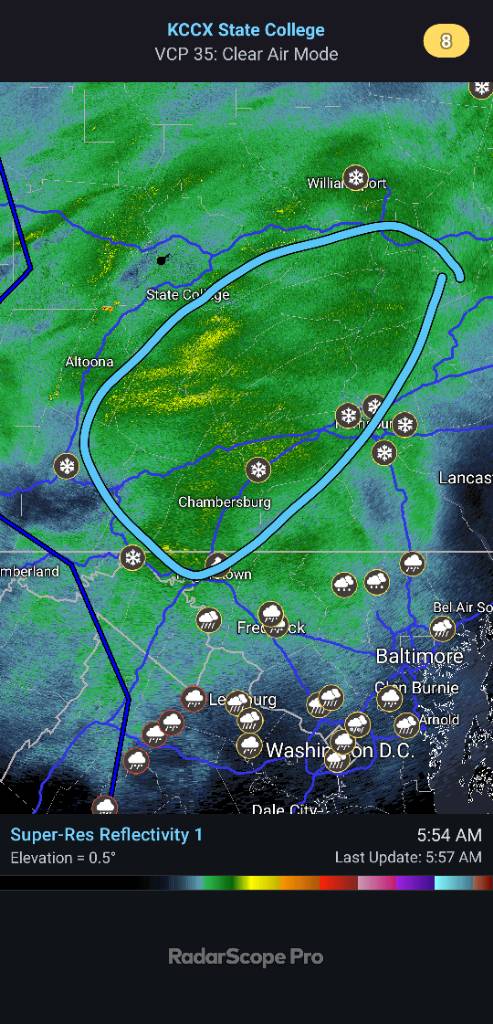
We got a halo. Game on Sent from my SM-S731U using Tapatalk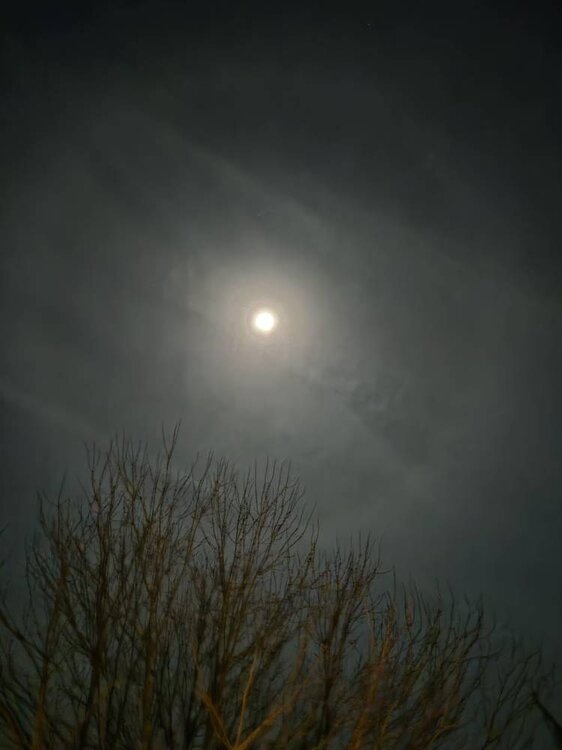
-
Central PA Fall Discussions and Obs
Jns2183 replied to ChescoWx's topic in Upstate New York/Pennsylvania
Down to mid 20s and happy Sent from my SM-S731U using Tapatalk -
Central PA Fall Discussions and Obs
Jns2183 replied to ChescoWx's topic in Upstate New York/Pennsylvania
I don't really know who we expected. Terry Smith was going to be absolutely unacceptable to a huge portion of the fan base and a good portion of large boosters. It's a situation where Franklin had to go, but there is no go to go guy. Im happy someone out of the blue because there isn't anyone I could think of Sent from my SM-S731U using Tapatalk -
Central PA Fall Discussions and Obs
Jns2183 replied to ChescoWx's topic in Upstate New York/Pennsylvania
For where? There is a whole lot of difference across the first two counties of depth in the state Sent from my SM-S731U using Tapatalk -
Central PA Fall Discussions and Obs
Jns2183 replied to ChescoWx's topic in Upstate New York/Pennsylvania
These things are such a crap shot I can't be mad by any choice for about 3 years. I've seen so many hires praised as amazing turn out to be shit and vice versa it's funny. Sent from my SM-S731U using Tapatalk -
Central PA Fall Discussions and Obs
Jns2183 replied to ChescoWx's topic in Upstate New York/Pennsylvania
If not him they are going to throw 10 million at Hartline which is insane Sent from my SM-S731U using Tapatalk -
Central PA Fall Discussions and Obs
Jns2183 replied to ChescoWx's topic in Upstate New York/Pennsylvania
Is penn State going to be blue balled by the Mormon church? Sent from my SM-S731U using Tapatalk -
Central PA Fall Discussions and Obs
Jns2183 replied to ChescoWx's topic in Upstate New York/Pennsylvania
This is like a 5-6hr pound town event Sent from my SM-S731U using Tapatalk -
Central PA Fall Discussions and Obs
Jns2183 replied to ChescoWx's topic in Upstate New York/Pennsylvania
Who here is setting alarm for 4am to wake up? Sent from my SM-S731U using Tapatalk -
Central PA Fall Discussions and Obs
Jns2183 replied to ChescoWx's topic in Upstate New York/Pennsylvania
It's suppose to start by 3-4am and be done by 12-1. I'm not feeling the timing plays much into it here Sent from my SM-S731U using Tapatalk