Jns2183
-
Posts
5,838 -
Joined
-
Last visited
Content Type
Profiles
Blogs
Forums
American Weather
Media Demo
Store
Gallery
Everything posted by Jns2183
-
I'd much rather do that then temp fate with Franklin and end up like Nebraska Sent from my SM-G970U using Tapatalk
-
Last time we had an offense that put fear into people Sent from my SM-G970U using Tapatalk
-
What's Joe Morehead doing Sent from my SM-G970U using Tapatalk
-
I bet we are ahead this year due to our lack of rain and very much not so lack of clouds Sent from my SM-G970U using Tapatalk
-
We must have the worst clouds to rain ratio in America. Sent from my SM-G970U using Tapatalk
-
Can we please get a thanksgiving megastorm somewhere close Sent from my SM-G970U using Tapatalk
-
We need to spike PSU water with lsd Sent from my SM-G970U using Tapatalk
-
Everyone is forgetting who Michigan plays tomorrow. For Penn State it's either going to be depressing as hell or hilarious beyond any recognition tomorrow. Sent from my SM-G970U using Tapatalk
-
I did not expect rain today Sent from my SM-G970U using Tapatalk
-
How is that rain sw going to totally miss us? Sent from my SM-G970U using Tapatalk
-
I can't wait for virga city where I'm stuck on a heavy evaporating snowband for hours Sent from my SM-G970U using Tapatalk
-
I'll plan for a seasonal total of 10" and be excited for anything above that Sent from my SM-G970U using Tapatalk
-
Fire Sent from my SM-G970U using Tapatalk
-
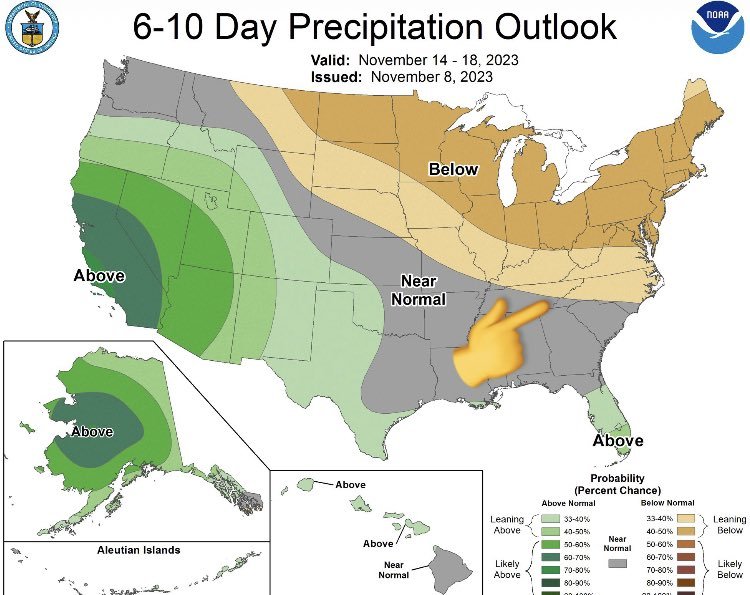
Maybe we got some week of thanksgiving Sent from my SM-G970U using Tapatalk
-
When will it rain Sent from my SM-G970U using Tapatalk
-
Important questions.....what whiskey? Ice/no ice? If ice, what kind? Sent from my SM-G970U using Tapatalk
-
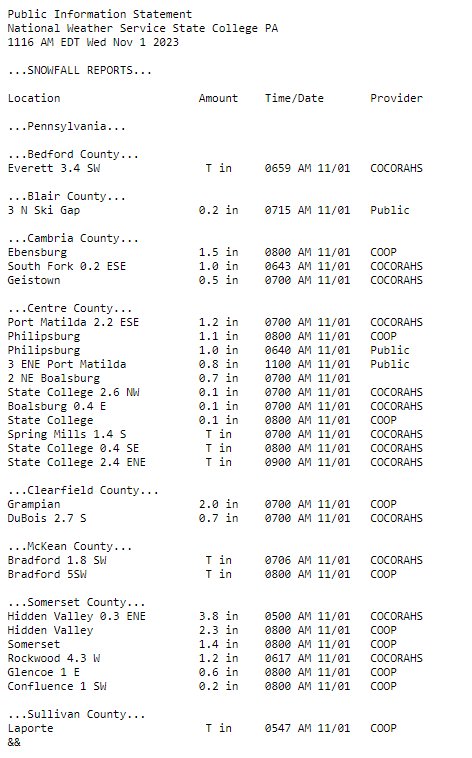
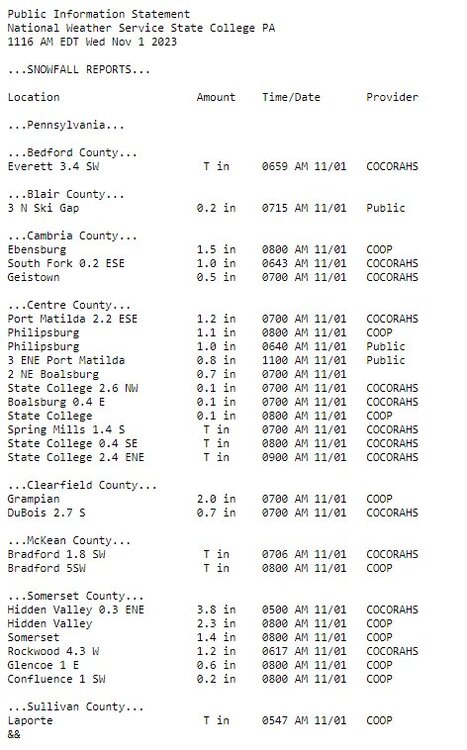
Snowfall amounts from last night/this morning Sent from my SM-G970U using Tapatalk
-
I guess @canderson shingles would be our snow Sent from my SM-G970U using Tapatalk
-
In Pittsburgh snow started Thanksgiving 11/23 and ended a week later with 30.3" Sent from my SM-G970U using Tapatalk
-
Johnstown ended that November with 9 days of snow totaling 23" Sent from my SM-G970U using Tapatalk
-
It went from like 56 to 16 on 11/25 with like 2" of rain and 4" of snow. State college went from 51 to 10 with like 8" of snow Sent from my SM-G970U using Tapatalk
-
We are overdue for a storm like this in late November or early December https://www.weather.gov/jkl/appalachianstorm1950 Sent from my SM-G970U using Tapatalk
-
The legendary Agostino Perrone! The man totally redefined upscale hotel bars. His hometown is up in the Italian Alps. I had the pleasure of going to a workshop lead by him a couple years ago. He's wonderful. What you are paying the massive premium for on these cocktails is the amazing attention to detail of every aspect of your experience, and basically a performance in the creation of the cocktail. He pioneered the Martini Cart in order to bring around to tables. He was a on the van guard regarding, and I know this sounds silly, how to use ice properly. The amount of dilution, the temperature, the salinity all are vital and can drastically change the taste. Best of think of the experience. Anyways at the Connaught bar I've heard wonderful things regarding the Magnetum and the Eclipse. The other bar there is Synergia, which will definitely be where he throws out some amazingly unique, wacy cocktails. Again, it's all about the complete experience there. The visuals, aromas, decor should all come together to enhance the actual drink. They sells experiences more than cocktails. Day dreaming and Sunthesis are the two I would try there. Sent from my SM-G970U using Tapatalk
-
Looks like Friday might be meh, with more clouds then sun, chance of showers from about 4/5 pm till 4/5 am Saturday. But Saturday looks better. Sent from my SM-G970U using Tapatalk
-
I don't see fuel oil becoming cheaper Sent from my SM-G970U using Tapatalk