

Roger Smith
-
Posts
5,392 -
Joined
-
Last visited
Content Type
Profiles
Blogs
Forums
American Weather
Media Demo
Store
Gallery
Posts posted by Roger Smith
-
-
GGEM has an exceptional look for this region, 15-25 inch potential with about 24h of continuous moderate to heavy snow potential as the coastal slowly develops in an ideal location, while the primary slumps southeast to eliminate dry slot and transient warmth. GFS is almost as good. ECM appears to be drifting into the same outlook. Based on that, first call from me:
widespread 17-23 inch totals, local 25-30.
mixing issues confined to central, southern DE, southeast MD, VA s/e of RIC.
-
 1
1
-
 1
1
-
 24
24
-
-
This seems like a good set of model signals with GFS very good, GEM perhaps a bit warmer solution than ideal, ECM now trending a bit suppressed, my guess is that a very large storm is likely and this divergence represents those developing signals coming into the mix -- in fact this could turn out to be a monster storm with the long interval of coastal development and signs that the center wants to set up very close to the Delaware coast. My hunch is we're looking at 20-30 inch amounts with this one.
-
 2
2
-
3
-
-
Won't be me starting any storm contest threads, the winter seasonal contest is probably basically this storm plus 5" anyway.
-
2
-
-
Predict the temperature anomalies (F deg) relative to defined normal period (expect this to remain 1981-2010 for a few more months yet) for these nine locations ...
DCA _ NYC _ BOS __ ORD _ ATL _ IAH ____ DEN _ PHX _ SEA
The deadlines and late penalties now in force are as follows:
enter by 0600z 1st, no late penalty
enter by 1800z 1st a late penalty of 1%
enter by 00z 2nd, late penalty of 2%
enter by 03z 2nd, late penalty of 3%
enter by 06z 2nd, late penalty of 4%
after 06z 2nd, late penalty increases to 1% per 2h interval. It increases further to 1% per hour at 06z 3rd.
__________________________________
These late penalties will be assessed unless participants supply a valid health-related reason for being late and also stipulate that they have seen no useful guidance since 0600z 1st. The late penalty is designed to offset advantages gained from later guidance rather than being punitive just for lateness alone.
-
Final scoring for Jan 2021
These scores are based on the final anomalies in the previous post.
FORECASTER _________________DCA_NYC_BOS__east_ ORD_ATL_IAH__cent_ c/e___DEN_PHX_SEA__west___TOTALS
DonSutherland 1 _______________ 70 _ 56 _ 48 __ 174 __ 96 _ 92 _ 94 __ 282 __ 456 __ 72 _ 84 _ 66 __ 222 _____ 678
RodneyS _______________________ 76 _ 86 _ 86 __ 248 __ 50 _ 62 _ 52 __ 164 __ 412 __ 64 _ 88 _ 96 __ 248 _____ 660
BKViking _______________________ 90 _ 96 _ 98 __ 284 __ 20 _ 66 _ 72 __ 158 __ 442 __ 44 _ 84 _ 88 __ 216 _____ 658
Roger Smith ____________________88 _ 80 _ 70 __ 238 __ 26 _ 98 _ 92 __ 216 __ 454 __ 74 _ 28 _ 86 __ 188 _____ 642
___ Consensus __________________88 _ 96 _ 88 __ 272 __ 28 _ 62 _ 66 __ 156 __ 428 __ 48 _ 84 _ 80 __ 212 _____ 640
wxallannj _______________________88 _100_ 88 __ 276 __ 28 _ 76 _ 48 __ 152 __ 428 __ 12 _ 98 _ 80 __ 190 _____ 618
hudsonvalley21 _________________76 _ 70 _ 62 __ 208 __ 48 _ 64 _ 72 __ 184 __ 392 __ 48 _ 78 _ 98 __ 224 _____ 616
Scotty Lightning ________________78 _ 76 _ 70 __ 224 __ 06 _ 62 _ 88 __ 156 __ 380 __ 46 _ 78 _ 64 __ 188 _____ 568
wxdude64 ______________________80 _ 74 _ 76 __ 230 __ 22 _ 54 _ 66 __ 142 __ 372 __ 26 _ 94 _ 58 __ 178 _____ 550
so_whats_happening __________ 100 _ 58 _ 38 __ 196 __ 46 _ 60 _ 42 __ 148 __ 344 __ 48 _ 92 _ 48 __ 188 _____ 532
RJay ___________________________98 _ 74 _ 50 __ 222 __ 56 _ 42 _ 58 __ 156 __ 378 __ 66 _ 48 _ 28 __ 142 _____ 520
Tom ___________________________ 66 _ 74 _ 76 __ 216 __ 00 _ 38 _ 64 __ 102 __ 318 __ 32 _ 94 _ 62 __ 188 _____ 506
___ Normal _____________________48 _ 56 _ 60 __ 164 __ 00 _ 42 _ 58 __ 100 __ 264 __ 36 _ 98 _ 64 __ 198 _____ 462
____________________________________________________________________________
EXTREME FORECAST REPORT
High score must go to either the extreme warm or cold forecast, or second most extreme, for a station to qualify.
ORD _ DonSutherland1 (+5.0) was a lot closer than anyone else to the confirmed outcome (+5.4).
ATL _ Roger Smith (+3.0) wins here as ATL finishes on +2.9 or higher.
IAH _ Don Sutherland (+1.8) has a win as IAH finished +2.1 ... Roger Smith (+2.5) has a loss by two points.
DEN _ Roger Smith (+4.5) took a win here (DEN confirmed +3.2).
(PHX narrowly missed out with third coldest forecast high score)
The results in total are records of 2-0 for DonSutherland1 and 2-1 for Roger Smith.
Four months qualified, all on the warm end of the forecasts.
__________________________________________
Congrats to DonSutherland1 and all the crew after quite a close first month generally speaking, narrow range of scores.
(note _ edit on March 3 was to correct small addition mistakes in scoring revealed by work on annual scoring after Feb)
-
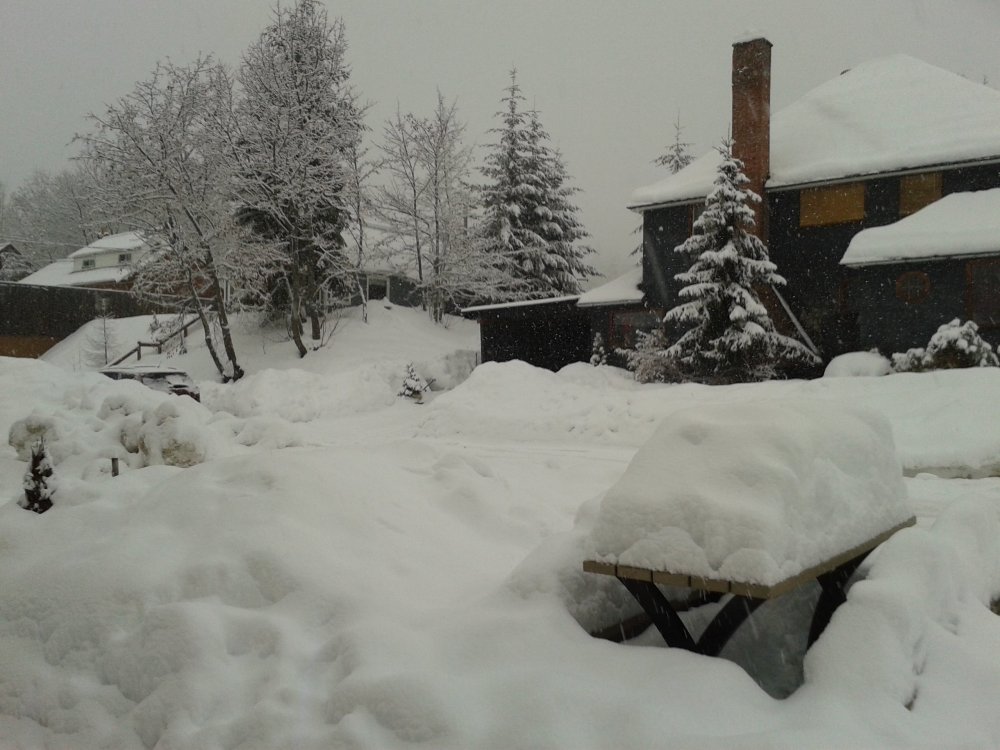
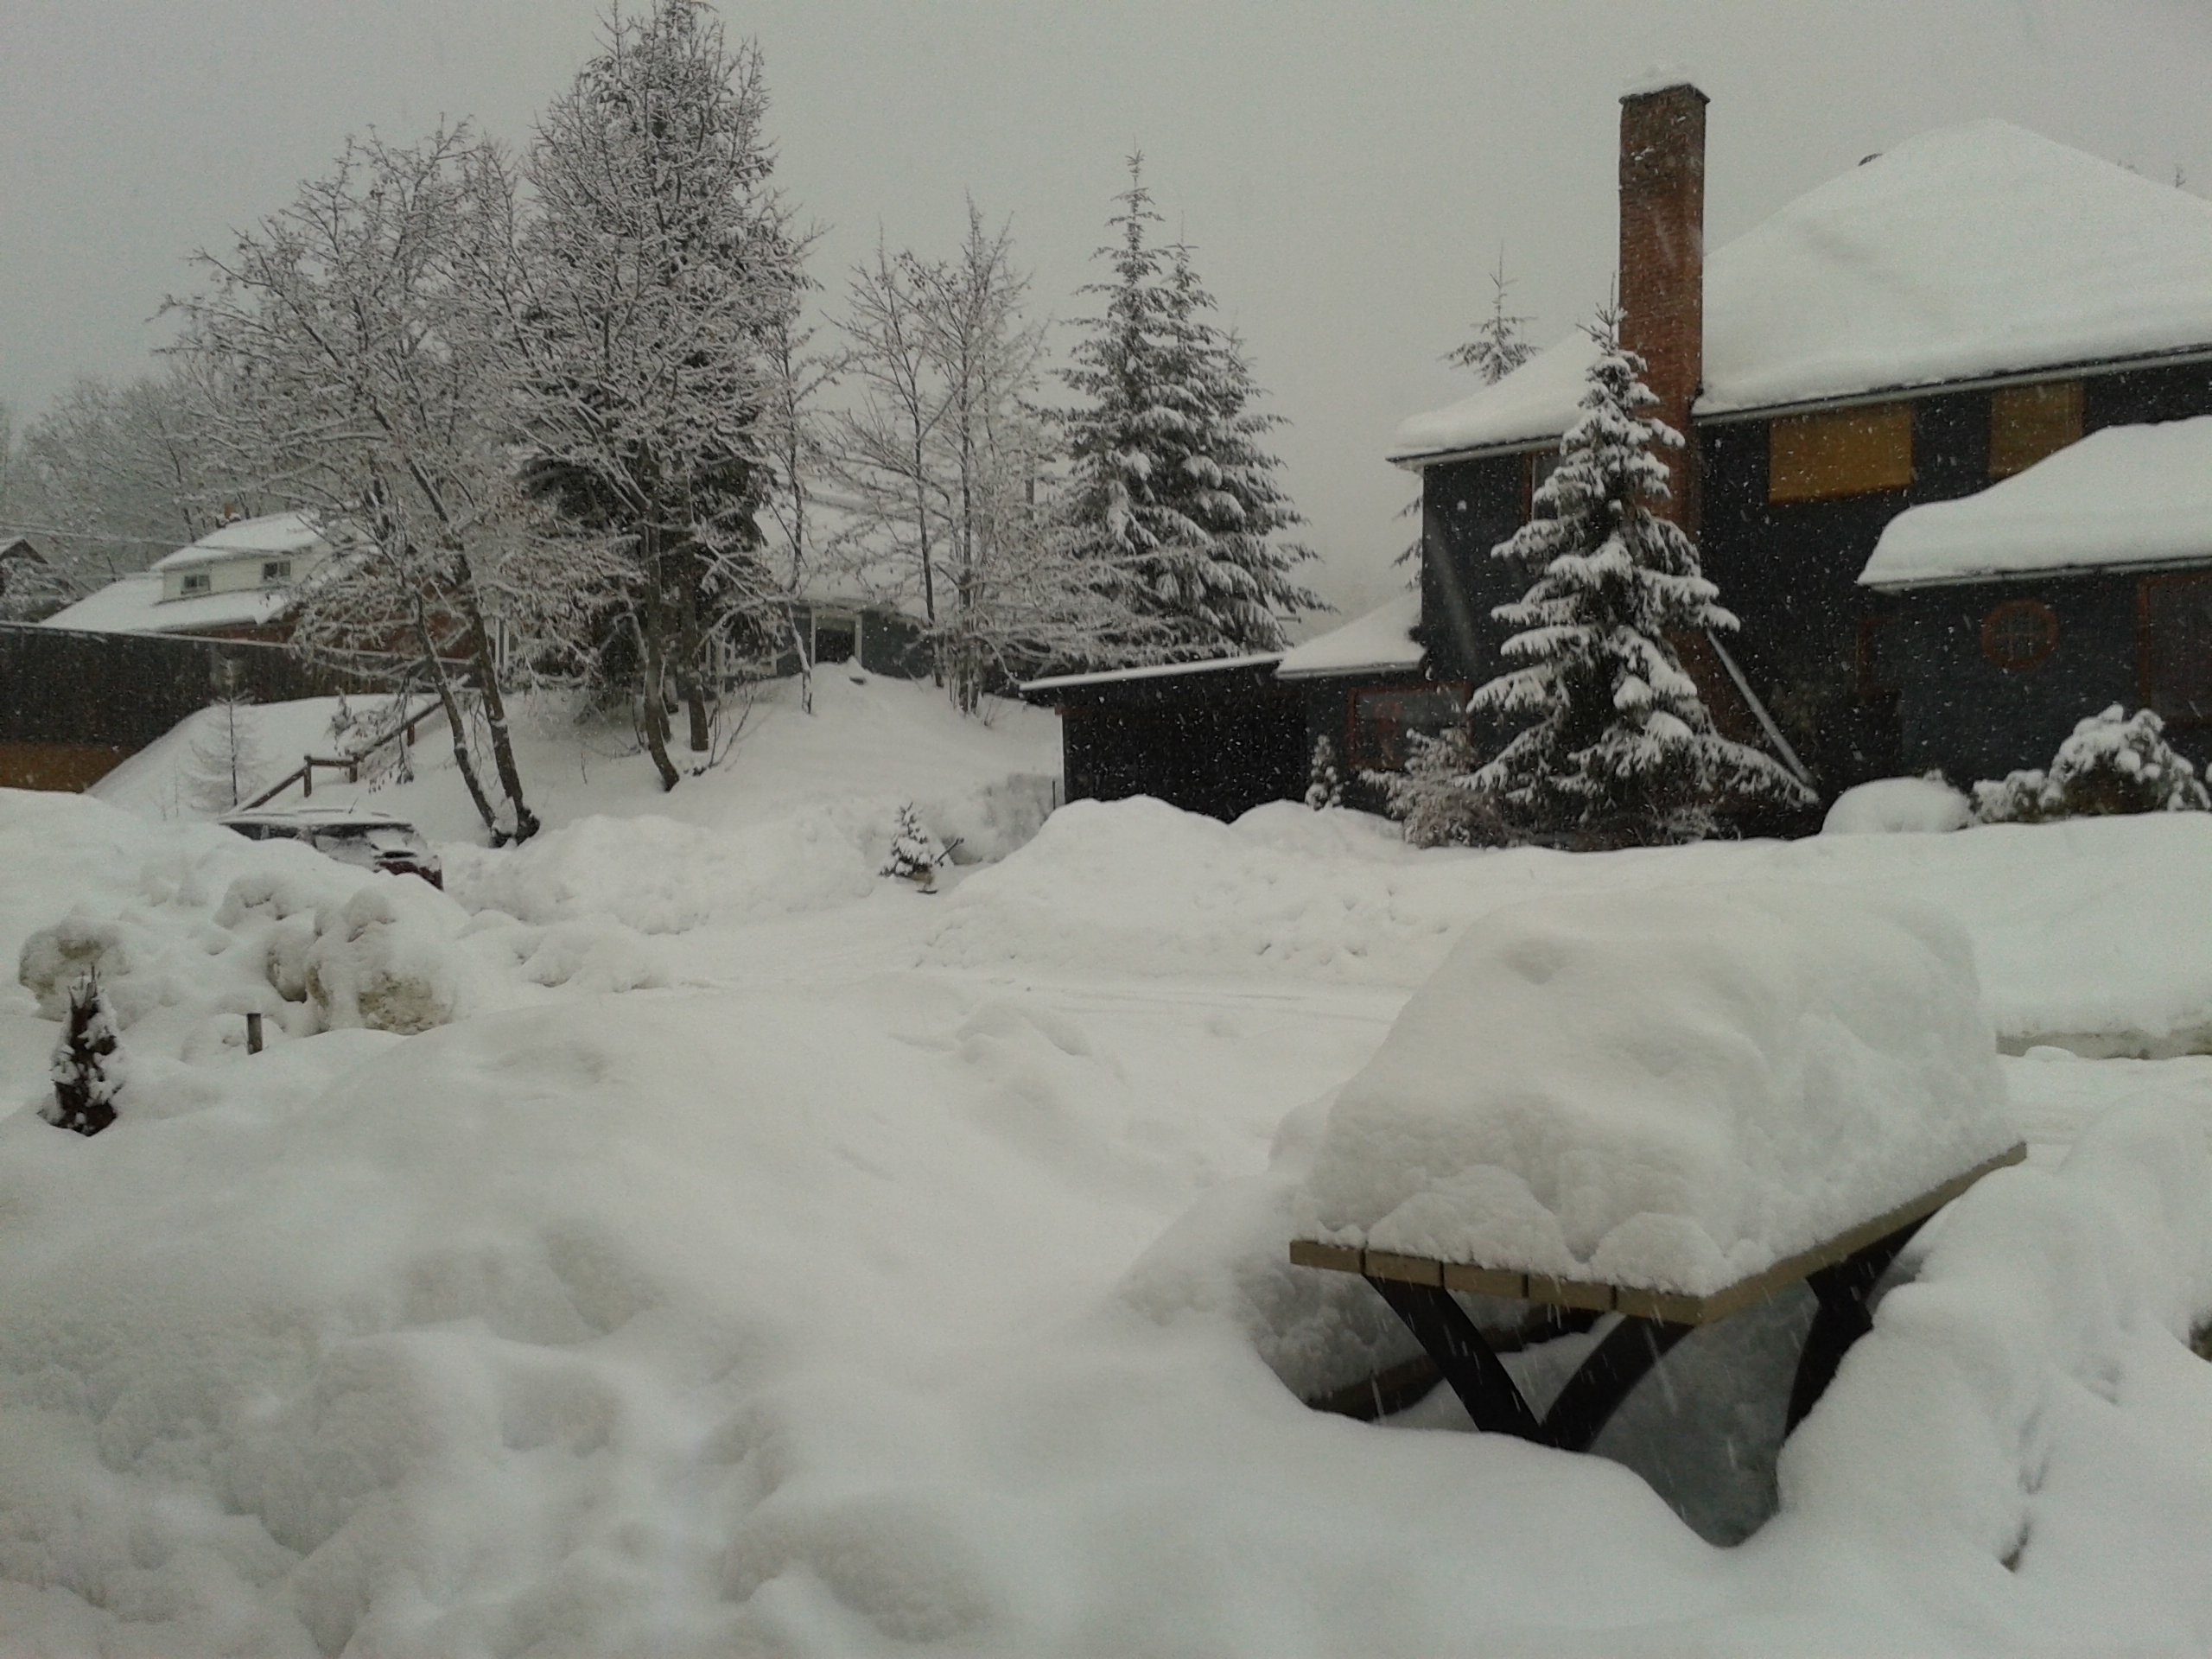
Can we switch to snow on the ground outside one's house, because that way, I win ...
-
3
-
-
Since we're comparing snow pictures ... I live about 20 paces left of this photo (taken a week ago, the trees have lost that snow cover from the windstorm last week, snow on ground is about the same today as then after a bit of a thaw and a bit more falling) -- this is a normal look for here in mid-January.

-
I think the first half of February will deliver the goods. There are some similarities to 2010, and if you recall, no sign of winter at all in January 2010, until the last few days anyway. Western Europe is in a very similar pattern to Jan 2010.
-
 2
2
-
-
Do you perceive two different kinds of cold regime down there, like the anticyclonic type and the advection from far north type?
This far north, we tend to do these two types simultaneously, either there's cold air of northern origin trapped over us, or we're in a mild Pacific flow.
This winter, it has been relatively mild (I'm only a few miles north of the 49th parallel here) but at my elevation a fairly decent snowfall. Quite a contrast locally, at my elevation 20-25 inches on the ground, down in the Columbia valley a few miles east of here, almost no snow, just partial cover and 2-4 inches where any at all.
We just had some very strong winds from that low that came in off the ocean Tuesday night, a few large trees close to us coming down at daybreak.
-
First and second editions of the anomaly tracker, for 10 and 20 days ... with final anomalies added on Feb 1st.
______________________ DCA _ NYC _ BOS __ ORD _ ATL _ IAH ___ DEN _ PHX _ SEA
11th _ (10d anom) ___ +4.7 _ +3.6 _ +4.2 __ +7.1 _ +2.9 _ --1.5 __ +3.6 _ --1.1 _ +3.5
21st _ (20d anom) ___ +4.7 _ +5.4 _ +5.7 __ +6.9 _ +1.7 _ --1.2 __ +4.1 _ +0.9 _ +3.4
11th _ (p20d anom)__ +2.5 _ +1.8 _ +2.0 __ +2.5 _ +1.0 _ --2.0 __ +0.5 _ --1.5 _ +1.5
11th _ (p27d anom) __ +1.5 _ +1.0 _ +1.0 __ +1.0 __ 0.0 _ --2.5 ___ 0.0 _ --1.5 _ +1.5
21st _ (p31d anom) __ +3.0 _ +2.5 _ +2.0 ___+4.5 _ +1.5 __ 0.0 ___ 0.0 _ +1.0 _ +1.5
Feb 1st _(31d anom)_ +2.6 _ +2.2 _ +2.0 ___+5.4 _ +2.9 _+2.1 __ +3.2 _ --0.1 _ +1.8
__________________________________________________________________________________
snowfalls to date ____ 2.6 __ 12.6 __ 23.1 __25.4 _DTW19.5_BUF44.0 _ 20.1 _ 0.5 _BTV34.5
____________________________________________________________________________________
11th __ A mild start to January except in the southwest and Gulf coast where slightly below normal.
The projections are based on the assumption of a modified cold pattern, not exceptionally cold, but somewhat below average
in most regions for the rest of the month to the 27th at least. Despite the widespread below average temperatures, not a lot of
snow on offer other than perhaps lake effect and a few transient 1-3" events.
21st __ The milder pattern continued anyway in the east, modified cold became modified mild with no snow on the ground near
the coastal plain. Similar comment for DEN and to a lesser extent (with no snow expected) PHX and SEA. Forecasts for the
southeast fared better though. The end of month forecasts are based on the assumption of near normal averages in
most places across the south now to 31st, trending to around -4 average anomalies closer to the Canadian border.
Snowfall contest amounts are updated above also. Many of those had added almost nothing until late January. Current totals
are valid end of day Jan 31st.
Provisional scoring will follow using the end of month projections generated.
27th _ ORD adjusted from +3.0 to +4.5 as cold end of month not as deep on current charts.
31st - 1st Feb _ Monthly final anomalies have been added.
-
Table of forecasts for January, 2021
Apologies, a bit late getting this together ... welcome back to the new contest year.
FORECASTER ___________________ DCA _ NYC _ BOS __ ORD _ ATL _ IAH ___ DEN _ PHX _ SEA __ bias
DonSutherland 1 ________________+4.1 _ +4.4 _ +4.6 __ +5.0 _ +2.5 _ +1.8 __ +1.8 _ +0.7 _ +3.5 __ +1.86
hudsonvalley21 _________________+3.8 _ +3.7 _ +3.9 __ +2.6 _ +1.9 _ +0.7 __ +0.6 _ +1.0 _ +1.9 __ +0.93
so_whats_happening ___________ +2.6 _ +4.3 _ +5.1 __ +2.5 _ +0.9 _ --0.8 __ +0.6 _ --0.5 _ --0.8 __ +0.24
RJay ___________________________ +2.5 _ +3.5 _ +4.5 __ +3.0 __ 0.0 __ 0.0 __ +1.5 _ +2.5 _ --1.8 __ +0.24
BKViking _______________________ +2.1 _ +2.0 _ +2.1 __ +1.2 _ +1.2 _ +0.7 __ +0.4 _ +0.7 _ +1.2 __ +0.44
wxallannj _______________________+2.0 _ +2.2 _ +2.6 __ +1.6 _ +1.7 _ --0.5 __ --1.2 _ --0.2 _ +0.8 __ --0.30
___ Consensus __________________+2.0 _ +2.0 _ +2.6 __ +1.6 _ +1.0 _ +0.4 __ +0.6 _ +0.7 _ +0.8
Roger Smith ____________________ +2.0 _ +1.2 _ +0.5 __ +1.5 _ +3.0 _ +2.5 __ +4.5 _ +3.5 _ +2.5 __ +1.06
wxdude64 ______________________ +1.6 _ +0.9 _ +0.8 __ +1.3 _ +0.6 _ +0.4 __ --0.5 _ --0.4 _ --0.3 __ --0.81
Scotty Lightning ________________ +1.5 _ +1.0 _ +0.5 __ +0.5 _ +1.0 _ +1.5 __ +0.5 _ +1.0 __ 0.0 __ --0.47
RodneyS ________________________+1.4 _ +1.5 _ +2.7 __ +2.7 _ +1.0 _ --0.3 __ +1.4 _ +0.5 _ +2.0 __ +0.13
Tom ____________________________ +0.9 _ +0.9 _ +0.8 __ --0.2 _ --0.2 _ +0.3 __ --0.2 _ +0.2 _ --0.1 __ --1.03
___ Normal ______________________ 0.0 __ 0.0 __ 0.0 ____ 0.0 __ 0.0 __ 0.0 ____ 0.0 __ 0.0 __ 0.0 ___ --1.30
____________________________________________________________________________________
____________________________________________________________________________________
Color coding shows warmest and coldest forecasts. Normal is colder than all forecasts at DCA, NYC, BOS.
New feature this year, "bias" is your average departure from consensus. (not an average of absolute difference,
but an average of the nine anomalies vs consensus -- could help you figure out your tendencies).
With eleven forecasters and consensus being the median, that will be the 6th ranked forecast.
------------------------------------------------------------------------------------------------------------------------------
Review of scoring rules
For most forecasts, the scoring is 100 minus two points per 0.1 deg error in outcome.
When an outcome is more than 5.0 deg above or below normal, a smaller decrease is applied, at either end of the scoring zone between 0.0 and the outcome, where equal portions near 0.0 and the outcome lose only one point per 0.1 error. Example, outcome is 7.0, zones from 0.0 to 2.0 and 5.0 to 7.0 lose one point, a forecast of 3.5 which would normally score 30 gets 50 points because it loses 30 points 3.5 to 5.0, and 20 more 5.1 to 7.0. You always score some points by being on correct side of normal. Back in March 2012 we had an outcome greater than 10.0 (DCA +12) and scored that on a totally sliding scale from 0.0 to +12.0.
The only other scoring rule is that the maximum raw score must be 60 or greater, when it is not, then all scores are adjusted on a "minimum progression" basis with the closest forecast scoring 60, and the rest eligible to score at intervals ... with eleven forecasts, there would be nine more scores at intervals of six, and then a bottom score of zero. However, any raw score that is higher than the minimum progression score is used instead. If the raw scores were clustered from 20 to 50, then in my example, 30 might be the lowest boosted score and the lower ones (24, 18, 12, 06, 00) would be higher raw scores instead.
These are by the way the scoring rules that I have been applying for about ten years now.
As to late penalties, I have been trying to balance fairness with fun, as we can see in the larger picture, this is not very easy to do. The late penalties kick in at 0600z of the 1st, and amount to one per cent reductions for each six hour interval (or fraction) that you are late, up to 36h (1800z 2nd, late penalty by then is 9%) and would increase by 1% per hour thereafter although we rarely get forecasts much later than 12-18 hours after deadline. I have been lenient in 2020 on health-related late situations. My philosophy on late penalties is not to be punitive but just to try to level the playing field in case guidance improves in some situations by the time a late entrant makes a forecast. If guidance improves, a 5% scoring reduction might offset the advantage gained. Anyone has the right to submit a late revision for one or more stations, and those would be scored by the relevant late penalty. It would not be applied to forecasts unchanged from on-time submission.
-
Thanks for the forecasts and continuing to support the contest -- the 2020 contest results are in, congrats to RodneyS who cruised in at the end despite a late challenge from DonSutherland1 and hudsonvalley21. RJay also beat consensus for the year.
Welcome back so_whats_happening, and good luck in 2021 everyone.
I will do a table of forecasts tomorrow afternoon so as previously announced, the actual on-time deadline is Jan 2 18z and anyone can feel free to edit their submissions to then, I haven't made any notes. Also if any other American Weather forum members want to get in on the contest, post away (no late penalties this month until 18z 2nd).
-
2
-
-
So in the final analysis, RodneyS had things entirely under control, even a perfect forecast from DonS would have fallen a few points short, but Don and hudsonvalley21 gave the leader a good run at the end, moving up more than 100 points (the margin going in was 352 and so RodneyS at 616 just could not be overtaken). RJay was edged out into fourth but also beat consensus.
Everyone has some sort of a win or else did consistently well, the nine station best scores were quite widely distributed, and so were the extreme forecasts.
The rest of us can look at our totals and see where it all went wrong, in my case, it would have helped not to be ten thousand points behind around April. I think from May to December I actually had more points than most, but too little too late. Apparently it's the west where I need to improve my game, for wxdude64 it's the opposite, west went okay, east-central not so great in 2020. But we're into a brand new year. I'm sure I can fall off a cliff in a different way every year, working on it.
Thanks for supporting the contest, I see that everyone regularly on hand here made an appearance in Jan 2021. Now all we need is some winter weather (I should say all you need is some winter weather, I've got lots, 10 inches of snow has fallen here in the past day and a half, still coming down at sunset here).
-
< < < < < ........ <<<< ---- ====== Annual Scoring (Jan-Dec) 2020 ====== ---- >>>> .......> > > > >
< < < < < ........ <<<< ---- ====== - - - - - - Final Reports - - - - - - ====== ---- >>>> .......> > > > >
Numbers in red denote highest cumulative scores for each of nine locations. Numbers in bold black type denote highest subtotals for regions.
These scores are now final ... subject to any adjustments as I check the math.
FORECASTER ______________ DCA_NYC_BOS__east__ORD_ATL_IAH__cent__ c/e __DEN_PHX_SEA__west ___ TOTAL
RodneyS ___________________796_ 830_ 930 __2556 __706 _744_820__2310 __4866 __750_805_802_ 2357 ____7223
Don Sutherland.1 ___________774 _852_886 __2512 __657 _730 _834 __2221 __4733 __616_836_800_ 2252 ____6985
hudsonvalley21 ____________715 _810 _909 __2434 __585 _724 _867 __2176 __4610 __665_838_821_ 2324 ____6934
RJay ______________________ 822 _843 _813 __2478 __622 _756 _789 __2167 __4645 __734_768_778_ 2280 ____6925
___ Consensus _____________720 _784 _911 __2415 __554 _734_880 __2168 __4583 __654_821_798_ 2273 ____ 6856
BKViking __________________ 717 _781 _868 __2266 __567 _689 _853__2109 __4375 __707_842_834_ 2383 ____ 6758
wxallannj __________________750 _852 _891 __2493 __507 _717 _856__2080 __4573 __650_767_752_ 2169 ____ 6742
Tom _______________________727 _762 _877 __2366 __490 _769 _836__2095 __4461 __619_822_731_ 2172 ____ 6633
Scotty Lightning ____________616 _606 _742 __1964 __478 _745_912__2135 __4099 __534_758_758_ 2050 ____ 6149
Roger Smith ________________644 _689 _794 __2127__607 _801 _800__2208 __4335 __ 562_560_602_ 1724 ____6059
wxdude64 __________________587 _631 _744 __1962__457 _626 _834__1917 __3879 __ 582_783_648_ 2013 ____5892
___ Normal _________________480 _498 _638 __1616 __390 _655 _742__1787 __3403 __486_618_ 718_ 1822 ____5225
Brian5671 _ (8/12) _________ 494 _502 _526 __1522 __323 _485 _545__1353 __2875 __318_478_542_ 1438 ____ 4313
JakkelWx _ (7/12) __________ 380 _395 _514 __1289__370 _405 _532__1317 __2606 __390 _422 _330_ 1142 ____3748
yoda _ (4/12) _______________192 _ 227 _200 __ 619 __152_250 _311 __ 713 ___1332 __209 _347_210 __ 766_____2098
rclab _ (1/12) ________________05 __ 00 __ 00 __ 005 __ 00 _ 11 _ 24 ___ 035 ____ 040 ___ 56 _ 88 _ 66 __ 210 _____ 250
dwave _ (1/12) ______________ 72 __ 75 __ 48 __ 195 __ 12 _ 25 _ 10 ___ 047 ____ 242 ___ 16 _ 34 _ 00 __ 050 _____ 292
Maxim _ (1/12) ______________00 __ 00 __ 00 __ 000 __ 00 _ 20 _ 46 ___ 066 ____ 066 ___ 32 _ 50 _ 34 __ 116 _____ 182
Rhino16 _ (1/12) _____________00 __ 05 __ 20 __ 025 __ 00 _ 13 _ 30 ___ 043 ____ 068 ___ 04 _ 52 _ 54 __ 110 _____ 178
==============================================================================
Extreme forecast standings January to December
81 of 108 forecasts so far have qualified for an extreme forecast award for the warmest forecast(s), 57 for warmest and 24 for coldest.
FORECASTER ____ Jan _ Feb _ Mar _ Apr _ May _ Jun __ Jul _ Aug _ Sep _Oct _Nov _Dec ___ Final Standings (Dec subject to adjustments)
Roger Smith ______ ---- __ ---- __ 1-0 __ 4-2 __ 1-0 __ ----- __ ---- __ 4-0 _ 1-0 _ 0-1 _ 6-0 _ 0-2 ___ 17-5
RodneyS _________ 2-0 __ 3-0 __ 0-1 __ ---- __ 2-0 __ 2-0 __ 0-1 __0-1 _ 4-1 _ ---- _ ---- __ 2-0 ___ 15-4
RJay _____________ ----- __ ----- __ 3-0 __ ---- __ ----- __ 1-0 __ 3-0 __ ---- _ 3-0 _ 2-0 _ ---- __ 1-0 ___ 13-0
Brian 5671 _______ 4-0 __ 1-0 __ 3-1 __ 1-0 __ 1-0 __ ---- __ 1-1 __ ---- _ ---- _ ---- __ ---- __ ---- ____ 11-2
DonSutherland1___0-0 __ 1-0 __ 1-0 __ 1-0 __ ---- __ 2-0 __ 2-0 __1-0 _ ---- _ 0-1 _ 2-0 __ 2-0 ___ 12-1
Scotty Lightning __ 2-0 __ 0-0 __ ---- __ 1-0 __----- __ ----- __ 1-0 __1-0 _ 0-1 _ 2-0 _ ---- __ 1-0 ____ 7-1
Normal ___________ 1-0 __ 0-1 __ ---- __ 1-0 __ ---- __ 2-0 __ ---- __ ---- _ 0-1 _ 1-0 _ ---- ___1-0 ____ 6-2
Tom ______________ 1-0 __ 0-0 __ ---- __ ---- __ 1-0 __ ----- __ ---- __ ---- _ 1-0 _ 1-0 _ ---- ___ 1-0 ____5-0
yoda ______________ 0-0 __ 1-0 __ ---- __ ---- __ ---- __ ----- __ ---- __ ---- _ 1-1 _ 2-0 _ ---- ___ ---- ____ 4-1
RClab _____________ 2-0 __ ---- __ ---- __ ---- __ ----- __ ----- __ ---- __ ---- __ ---- _ ---- _ ---- ___ ---- ____ 2-0
wxdude64 ________ ---- __ ---- __ ---- __ 1-0 __ ---- __ ----- __ ---- __ ---- __ 1-0 _ ---- _ ---- ___ ----- ____ 2-0
Jakkelwx __________ ---- __ ---- __ ---- __ ---- __ 1-0 __ ---- __ ---- __ ---- __ 1-0 _ ---- _ ---- ___ ----- ____ 2-0
wxallannj __________ ---- __ ---- __ ---- __ ---- __ ---- __ 1-1 __ ---- __ ---- __ ---- _ 1-0 _ ---- ___ ----- ____ 2-1
hudsonvalley21 ____ ---- __ ---- __ ---- __ ---- __ ---- __ ----- __ 1-0 __ ---- __ ---- _ ---- _ ---- ___ ----- ____ 1-0
BKViking ___________ ---- __ ---- __ ---- __ ---- __ ---- __ ----- __ ---- __ ---- __ ---- _ ---- _ ---- ___ 1-0 ____ 1-0
================================================================================
BEST SCORES -- Totals for January to December
Forecasters are listed in same order as annual points standings.
Ties are possible which is why some locations have more than total of months best scores, also, if Normal or consensus
achieve a top score, the actual forecaster with high score gets an award also. From Oct to Dec, high scores are always given
among regular annual entrants when "occasional" entrants take high score awards. (* marks these)
FORECASTER ____________ DCA_NYC_BOS__east__ORD_ATL_IAH__cent__c/e__DEN_PHX_SEA__west___Months
RodneyS _________________ 2 ___ 1 ___ 2 ____ 2 ____ 4 ___ 0 ___ 2 ___ 4 ____ 3 ____ 1 ___ 3 ___ 3 ___ 3 _____ 4 _ Jan, Feb, May, Sep
DonSutherland.1 __________1 ___ 3 ___ 2*____2 ____ 4 ___ 1 ___ 2 ___ 2 ____ 2*____1 ___ 2 ___ 1 ___ 3 _____ 3 _ Mar, Apr, Dec
hudsonvalley21 ___________0 ___ 1 ___ 1 ____ 1 ____ 0 ___ 1 ___ 3 ___ 1 ____ 2 ____ 0 ___ 1 ___ 0 ___ 0 _____ 1*___Oct*
RJay _____________________ 3 ___ 2 ___ 0 ____ 3 ____ 1 ___ 3*___0 ___ 2 ____ 2 ____ 3 ___ 1 ___ 1 ___ 0 _____ 2 _ Jun, Jul
___ Consensus ____________0 ___ 0 ___ 2 ____ 0 ____ 0 ___ 1 ___ 0 ___ 0 ____ 0 ____ 0 ___ 1 ___ 0 ___ 0 _____ 0
BKViking _________________ 0 ___ 0 ___ 1 ____ 0 ____ 0 ___ 1 ___ 1 ___ 1 ____ 0 ____ 1 ___ 0 ___ 0 ___ 1 _____ 0
wxallannj _________________0 ___ 0 ___ 0 ____ 1 ____ 0 ___ 2*___ 0 ___ 0 ____ 0 ____ 0 ___ 0 ___ 1 ___ 1 _____ 0
Tom ______________________1 ___ 2 ___ 3 ____ 2 ____ 1 ___ 0 ___ 1 ___ 1 ____ 1 ____ 0 ___ 2 ___ 0 ___ 1*_____0
Scotty Lightning __________ 1 ___ 0 ___ 0 ____ 0 ____ 0 ___3*___ 1 ___ 1 ____ 0 ____ 2 ___ 2 ___ 2 ___ 1 _____ 0
Roger Smith ______________ 2 ___ 3 ___ 3 ____ 2 ____ 2 ___ 3 ___ 1 ___ 1 ____ 1 ____ 2 ___ 1 ___ 1 ___ 1 _____ 2 __ Aug.Nov
wxdude64 ________________0 ___ 1 ___ 1 ____ 0 ____ 0 ___ 1 ___ 0 ___ 0 ____ 0 ____ 1 ___ 0 ___ 0 ___ 0 _____ 0
_____ Normal _____________ 0 ___ 0 ___ 0 ____ 0 ____ 0 ___ 2 ___ 1 ___ 2 ____ 1 ____ 1 ___ 1 ___ 1 ___ 0 _____ 1 ___ Apr
Brian5671 ________________ 2 ___ 1 ___ 1 ____ 1 ____ 0 ___ 2 ___ 1 ___ 0 ____ 1 ____ 0 ___ 1 ___ 2 ___ 0 _____ 0
Jakkelwx _________________1 ___ 1 ___ 1 ____ 1 ____ 1 ___ 0 ___ 0 ___ 0 ____ 0 ____ 0 ___ 0 ___ 0 ___ 0 _____ 0
Yoda _____________________0 ___ 0 ___ 1 ____ 0 ____ 0 ___ 1 ___ 0 ___ 0 ____ 1 ____ 1 ___ 1 ___ 0 ___ 1 _____ 1 ___ Oct
RClab ____________________0 ___ 0 ___ 0 ____ 0 ____ 0 ___ 0 ___ 0 ___ 0 ____ 0 ____ 1 ___ 1 ___ 1 ___ 1 _____ 0
____________________________________________________________________________________
* includes one win in this category among regular entrants only (Yoda had higher score).
... this rule only applies in fourth quarter of season. ... not retroactive.
--------- ----------- ========================================= 00000 ============================ --------- -------
Results are now final but some details could change, check back for final adjusted scoring.
-
+2.0 _ +1.2 _ +0.5 _ +1.5 _ +3.0 _ +2.5 __ +4.5 _ +3.5 _ +2.5
-
Nice to see everyone (just about) is planning to continue, I did mention a more lenient deadline as is our custom in early January, so anyone has the opportunity to edit these up to whatever deadline I eventually set (assume it will be no earlier than Jan 2 18z) ... and I'm going to post during the day tomorrow because I haven't had any time to look at guidance (believe it or not, I do look at it)
")
-- and happy new year, still back in 2020 here in Pacific time zone, can't wait to escape it.
(and any late lookers, you don't need to post anything until morning of Jan 2nd, if you would prefer to wait)
-
Apologies, I'm a bit late getting this thread posted. Will set a more firm deadline for entries on the morning of Jan 2nd once we see how things are going with contest entries.
As in past contests, predict the anomalies for these nine locations in F deg, I have to wait and see what the NWS plans to do about possible 1991-2020 averages coming into play, they may not be used in 2021. If anyone knows, post the info.
DCA __ NYC __ BOS ____ ORD __ ATL __ IAH ____ DEN __ PHX __ SEA
Check the December thread for updates on contest results for 2020.
Happy new year, let's hope it's an improvement over the one fading out. (Roger over and out)
-
1
-
-
When the front comes through around midnight or 0100h, TRW+ 60/59 followed by about a half hour of rain showers turning to ice pellet showers then snow, each lasting a few minutes, temps within an hour or two 30 deg, falling further to 20 by morning, flash freeze conditions turning untreated side roads into icy disaster areas, clear blue skies by sunrise, snappy cold WNW winds 30G50, wind chills around 8-10 F. No temperature rise on 25th, falling further in the evening to around 10 F.
-
Always remember, it was 80 degrees at Christmas in 2015 ...
-
I think something like this happened in 1965 (I was in NJ for Christmas and New Years that year) and then it was close to 70 deg again on New Years eve. Only reason for mentioning the analogy is that you had that memorable snowstorm in late January of 1966. That was on a similar track (NNE) a bit further east than the event being discussed here. That was more or less a mild winter with the one big event.
-
Confirmed scoring for December 2020
Scoring is based on the latest end of month projections listed in the previous post.
ORD raw scores are boosted by "max 60" progression as highest raw scores were 45. Boosted scores have the ^ symbol. Some lower ORD scores are raw scores that were higher than the progression values.
FORECASTER _______DCA_NYC_BOS_east__ORD_ATL_IAH_cent_c/e___DEN_PHX_SEA_west __ TOTAL
DonSutherland 1 _____ 86 _ 96 _ 88 __ 270 __ 60^_ 76 _ 78 __ 214 _ 484 __ 90 _ 72 _ 84__ 246 ____ 730
hudsonvalley21 ______ 92 _ 98 _ 96 __ 286 __ 42^_ 88 _ 84 __ 214 _ 500 __ 80 _ 66 _ 70 __ 216 ____ 716
___ Consensus _______ 90 _ 98 _ 90 __ 278 __ 33^_ 86 _ 92 __ 211 _ 489 __ 82 _ 74 _ 44 __ 200 ____ 689
RJay _________________96 _ 94 _ 76 __ 266 __ 30^_ 84 _80 __ 194 _ 460 __ 98 _68 _ 60 __ 226 ____ 686
BKViking _____________94 _ 94 _ 82 __ 270 __ 18^_ 96_100__ 214 _ 484 __ 86 _ 70 _ 28 __ 184 ____ 668
wxallannj ____________ 88 _ 96 _ 78 __ 262 __ 36^_ 70 _ 88 __ 194 _ 456 __ 82 _ 76 _ 54 __ 212 ____ 668
Tom ________________100 _ 92 _ 98 __ 290 __ 12^_ 88 _ 96 __ 196 _ 486 __ 60 _ 90 _ 32 __ 182 ____ 668
RodneyS _____________68 _ 84 _ 92 __ 244 __ 60^_ 84 _ 78 __ 222 _ 466 __ 26 _ 90 _ 34 __ 150 ____ 616
Scotty Lightning _____ 76 _ 76 _ 84 __ 236 __ 24^_ 96 _ 90 __ 210 _ 446 __ 28 _ 88 _ 24 __ 140 ____ 586
Roger Smith _________ 80 _ 84 _ 90 __ 254 __ 48^_ 92 _ 64 __ 204 _ 466 __ 04 _ 38 _ 72 __ 114 ____ 580
___ Normal __________ 66 _ 66 _ 74 __ 206 __ 08^_ 84 _ 80 __ 172 _ 370 __ 38 _ 92 _ 24 __ 154 ____ 524
wxdude64 ___________ 64 _ 70 _ 78 __ 212 __ 06^_ 66 _ 68 __ 140 _ 344 __ 56 _ 86 _ 14 __ 156 ____ 500
______________________________________________________
EXTREME FORECAST REPORT _ Dec 2020
This has worked out differently from my previous report, maybe you didn't see that anyway, but as of now, with estimates or final values unlikely to change much, these would be the extreme forecast situations ...
DCA, NYC, BOS and IAH did not qualify, our consensus was good at all four locations (BOS high score was third coldest forecast).
ORD and SEA go to warmest forecasts, DonS and RodneyS share ORD, and DonS also wins SEA on his way to high score for the month of December, with hudsonvalley21 close behind.
PHX (+0.4) is a win by RodneyS and Tom (+0.9), our low forecasts, with Normal also getting a win (higher score than either of those).
(contest forecasters cannot take a loss to normal)
ATL (+0.8) ends up as a win-loss situation, with Scotty Lightning sharing a win (with BKV +0.6) with second highest forecast (+1.0), Roger Smith a loss with +1.2.
DEN also in the same position with RJay (+3.0) taking a win (result is +3.1), my overly ambitious +7.9 goes for a loss.
-------------------------------------------
These scores are now finalized, as is the annual report. (Things went a lot faster than I expected because several stations came in at my earlier estimates so they didn't need adjustments).
___________________________________________________
Annual update -- final contest scoring -- will wait for final results here but as I mentioned in the contest announcement post this month,
RodneyS had a large enough lead that no forecasts submitted could have gained enough points when compared with his forecasts, and
now the results make it appear that the lead will remain about the same. Some movement is likely in the chase pack 2nd to 6th, that will
be the main suspense of the final scoring I think.
-
I guess the long and the short of explaining the phenomenal amounts might be this -- the storm was weak enough to allow undisrupted banding, but strong enough to pump in mid-level moisture from a warmish Atlantic, with orographic uplift factors generally favorable to enhancement in the frontogenic band.
Now that they have extended historical weather maps back into the mid-19th century, I've had an opportunity to check out postulated charts vs large storm events in the period when Caswell's Providence journal overlapped the first years of the Toronto observations (after 1840). Now obviously some of those maps are fairly tentative and based on insufficient data. But it struck me that some fairly heavy snowfall events looked relatively tame and I was reminded of that when this one came along.
Tame, but working with the colder air masses (inland especially) of that historical era, and a storm track that more frequently ran along the coast than in modern climate terms. That was quite a cold high for so early in the winter.
20-20 hindsight of course, I was as surprised as anyone to hear the actual numbers from BGM, ALB and VT-NH.
There's also an energy peak in the background, mark down Jan 1-3 and Jan 14-16, this peak will occur again, depending on the shape of the upper level flow steering patterns somebody may get a repeat performance (it may be in a different part of the country though).
-
(will edit if later data change this total) ...
10.5" two-day total at NYC Central Park appears to be the 14th largest December two-day total in 152 years of records (since 1869). Scanning a data base that I have developed with much assistance from Don Sutherland, these two-day storms (assuming they were all overnight or one-day one-storm totals, maybe one or two are not but anyway) had more than 6 inches in December (search included any that began or ended in December only using 1st or 31st, but no examples found -- there was 9" on Jan 1st 1869 with no data for 1868 so that would qualify if any measurable snow fell on Dec 31 1868).
I have listed the two-day totals in order of magnitude. I have also listed any events that had a heavier two-day total than 5.8" (all are shown, even if neither day is over 6 inches which is where I stopped ranking single days, so this is also a list of the top 36 2-day snow events as well as the top 30 daily amounts, two of which belong to the second listed event). The two-day event in 1904 could be listed as a one-day 7.0" total in some data sets (the division of these various events mostly between 1895 and 1912 are more consistent with the reported daily precip amounts). If so that would move any values under 7.0" to one lower rank position ( higher rank number for those already in the 20s).
Rank __ Date(s) _________ TOTAL (2d amts) ____ Rank (Dec only) of heavier daily amount (if in Dec)
1. __ Dec 26-27 1947 ____ 26.4 (26.1+0.3) ______ 1st
2. __ Dec 26-27 2010 ____ 20.0 (12.2+7.8) ______ 6th (and 17th)
3. __ Dec 26 (1d) 1872 __ 18.0 (one day) _______ 2nd
4. __ Dec 20-21 1948 ____ 16.0 (15.8 +0.2) _____ 3rd
5. __ Dec 11-12 1960 ____ 15.2 (3.6+12.6) ______ 5th
6. __ Dec 5-6 2003 _______14.0 (6.0+8.0) ______ t13th
7. __ Dec 21-22 1959 ____ 13.7 (3.4+10.3) ______10th
8. __ Dec 15 1916 _______12.7 (one day) ________4th
9. __ Dec 24-25 1883 ___ 12.3 (7.3+5.0) ________ 19th
10. __ Dec 30 (1d) 2000 __ 12.0 (one day) _______ 7th
11. __ Dec 24 (1d) 1912 __ 11.4 (one day) _______ 8th
12. __ Dec 26 (1d) 1933 __ 11.2 (one day) _______ 9th
13. __ Dec 19-20 2009 ___ 10.9 (9.1+1.8) _______ 12th
14. __ Dec 16-17 2020 ___10.5 (6.5 + 4.0) ______ t27th
15. __ Dec 20 (1d) 1874 __ 10.0 (one day) ______ 11th
16. __ Dec 13-14 1917 ____9.5 (8.0+1.5) _______ t13th
17. __ Dec 19-20 1945 ____ 8.3 (8.0+0.3) _______t13th
t18. __ Dec 25-26 1909 ___ 8.0 (7.0+1.0) _______t20th
t18. __ Dec 3-4 1957 _____ 8.0 (0.5+7.5) _______ 18th
20. __ Dec 5 (1d) 1926 ___ 7.9 (one day) _______16th
21. __ Dec 19-20 1995 ____7.7 (5.5+2.2) _______ -- --
t22. __ Dec 17-18 1932 ___ 7.2 (6.7+0.5) _______t24th
t22. __ Dec 27-28 1990 ___ 7.2 (0.6+6.6) ______ 26th
24. __ Dec 24-25 1966 ____7.1 (6.7+0.4) _______t24th
t25. __ Dec 12-13 1904 ___7.0 (4.2+2.8) ________ -- -- (could show up as 7.0 12th or 13th one-day in some data)
t25. __ Dec 26 (1d) 1890 _ 7.0 (one day) _______t20th
t25. __ Dec 4 (1d) 1911 ___ 7.0 (one day) ______t20th
t25. __ Dec 15-16 1896 ___ 7.0 (0.2+6.8) ______ 23rd (daily record listed as 7.0 for 16th but 2d total actually, the 6.8 still beats 2020 though)
29. __ Dec 23-24 1963 ____ 6.6 (6.0+0.6) ______t29th
30. __ Dec 25 (1d) 1902 __ 6.5 (one day) ______ t27th
31. __ Dec 25-26 1969 ____ 6.3 (2.1+4.2) ______ -- --
32. __ Dec 23-24 1961 ____ 6.2 (2.8+3.4) ______ -- --
33. __ Dec 5 (1d) 2002 ____ 6.0 (one day) _____t29th
34. __ Dec 22-23 1896 ____ 6.0 (2.7+3.3) ______ -- -- (same note as 1904 above except 6.0" one day)
t35 __ (hon mention 5.8" on 14th 2003 and 9th 2005)
__________________________________________________
once again, thanks to Don Sutherland for providing me with the data base and supplementary info for some 1890s to 1912 era two-day breakdowns.
any errors would be in my analysis, have checked these over for years and amounts though.
Noting that half of these events occurred between 21st and 27th of December. On that note, merry Christmas.
-
2
-
-
The 40" event around BGM and 30" generally from there to central NH could pay some dividends for your region eventually. That snow pack is going to be there until there's two weeks of thaw (maybe late Feb to Mar) so any time good synoptics show up, any arctic highs ahead of snowfalls should be beefed up over the inland northeast.
From this GFS run, would tag the period Jan 3-5 as promising, there's deep winter cold showing up for several days before that and a strong low diving southeast into the plains states at end of the run (Jan 2). Would have to suspect that might recurve around the Carolinas into a powerful nor'easter.
The Christmas Day event looks at this point like a flash freeze, near 60 on the 24th, near 20 on the 25th. Probably a region wide dusting from that, 1-3" max potential. Will be more interesting for the temperature drop.
-
4
-

Jan 31 - Feb 1 Event - STORM MODE THREAD
in Mid Atlantic
Posted
You know things are going well when
(a) you wonder if the 4 inch QPF would be all snow or just mostly snow
(b) you wonder why that guy in BC always underpredicts snowfalls