
tamarack
-
Posts
16,514 -
Joined
-
Last visited
Content Type
Profiles
Blogs
Forums
American Weather
Media Demo
Store
Gallery
Posts posted by tamarack
-
-
Great summary. Some comparisons:
Total snowfall: 86.9" 98% of average (88.4")
The average ratio was 13.75:1, easily the highest of our winters (avg is just above 10:1). Even without the Jan 25-27 storm (19.6"/0.77" LE), the 12.1 to 1 ratio would be highest.
Days with 1"+: 131 (123 consec.) About a week above average
Days with 10"+: 74 (69 consec.) About a week below average
Days with 20"+: 29 (17 consec.) Total was average, consec. 5 days BN
Peak depth: 28" on Jan 26 during the 19.6" fluff bomb (25:1 ratio). Settling was rapid. Average is 29", median 26".
SDDs: 1,526 203 BN but slightly above the median.
That 19.6" storm is 10th biggest in our 28 winters here. 2nd biggest for 25-26 was 8.5", modest but well-timed (Dec 23-24) for the grandkids' sledding.
-
 1
1
-
-
6 hours ago, vortex95 said:
Yah, but maybe we can get a grazing PRE like Arthur from July 2014!
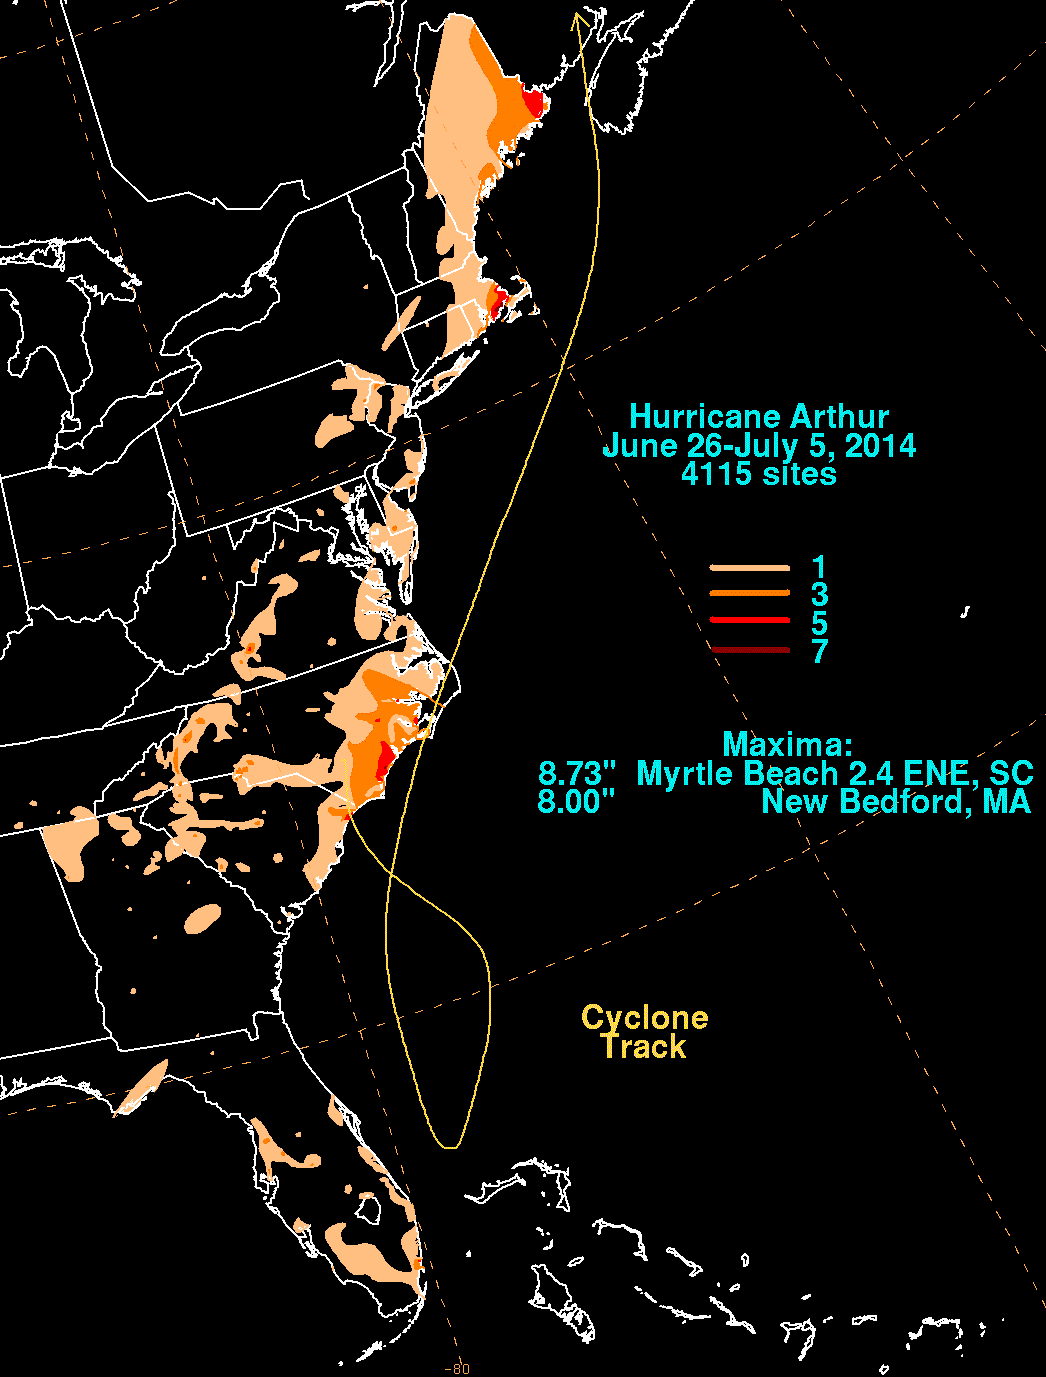
Got a nice drink (2"+) from Arthur with little wind. 200 miles east, Public Lands' Cutler tract had lots of trees flattened.
Had 0.09" overnight, event total 0.16".
From Tuesday thru yesterday, each subsequent QPF was lower than the previous one, finally fixing on <0.1" for both yesterday and last night - both verified. -
5 hours ago, Layman said:
This whole thing has largely missed my area. I don't mind at all!
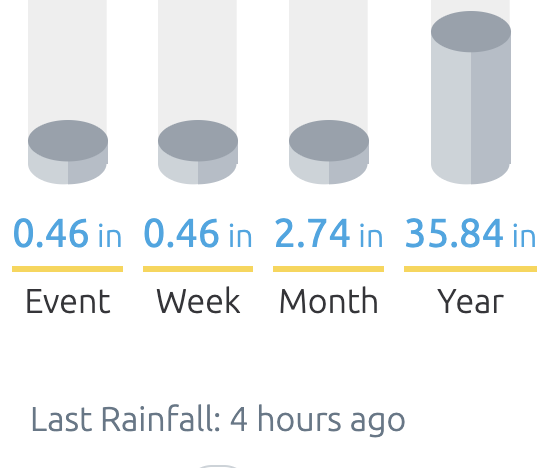
"Event": 0.07" Week: 0.07" Month: 2.11" Year: 21.82" (79% of average)
-
1
-
-
13 hours ago, JACKASS said:
On the subject of lobster, does anyone here actually go to Red Lobster?!
Some years back my sister-in-law gave us a gift card for Red Lobster. Unfortunately, the 3-4 RLs in Maine had closed - couldn't compete with the locals.

We had to go to northern Mass to use the card; combined it with a Bible conference in Concord, NH so didn't need a special trip.GYX overnight forecast (<0.1") was on target (sadly) - 0.07". Radar isn't very promising, either.
NNJ where I grew up got pounded, 3-7". We'd lived in the hills, avoiding flood damage, but the Pompton/Passaic river system flooded frequently. Unfortunately, the Passaic took the lives of two 10-year-olds yesterday.-
2
-
-
14 hours ago, DavisStraight said:
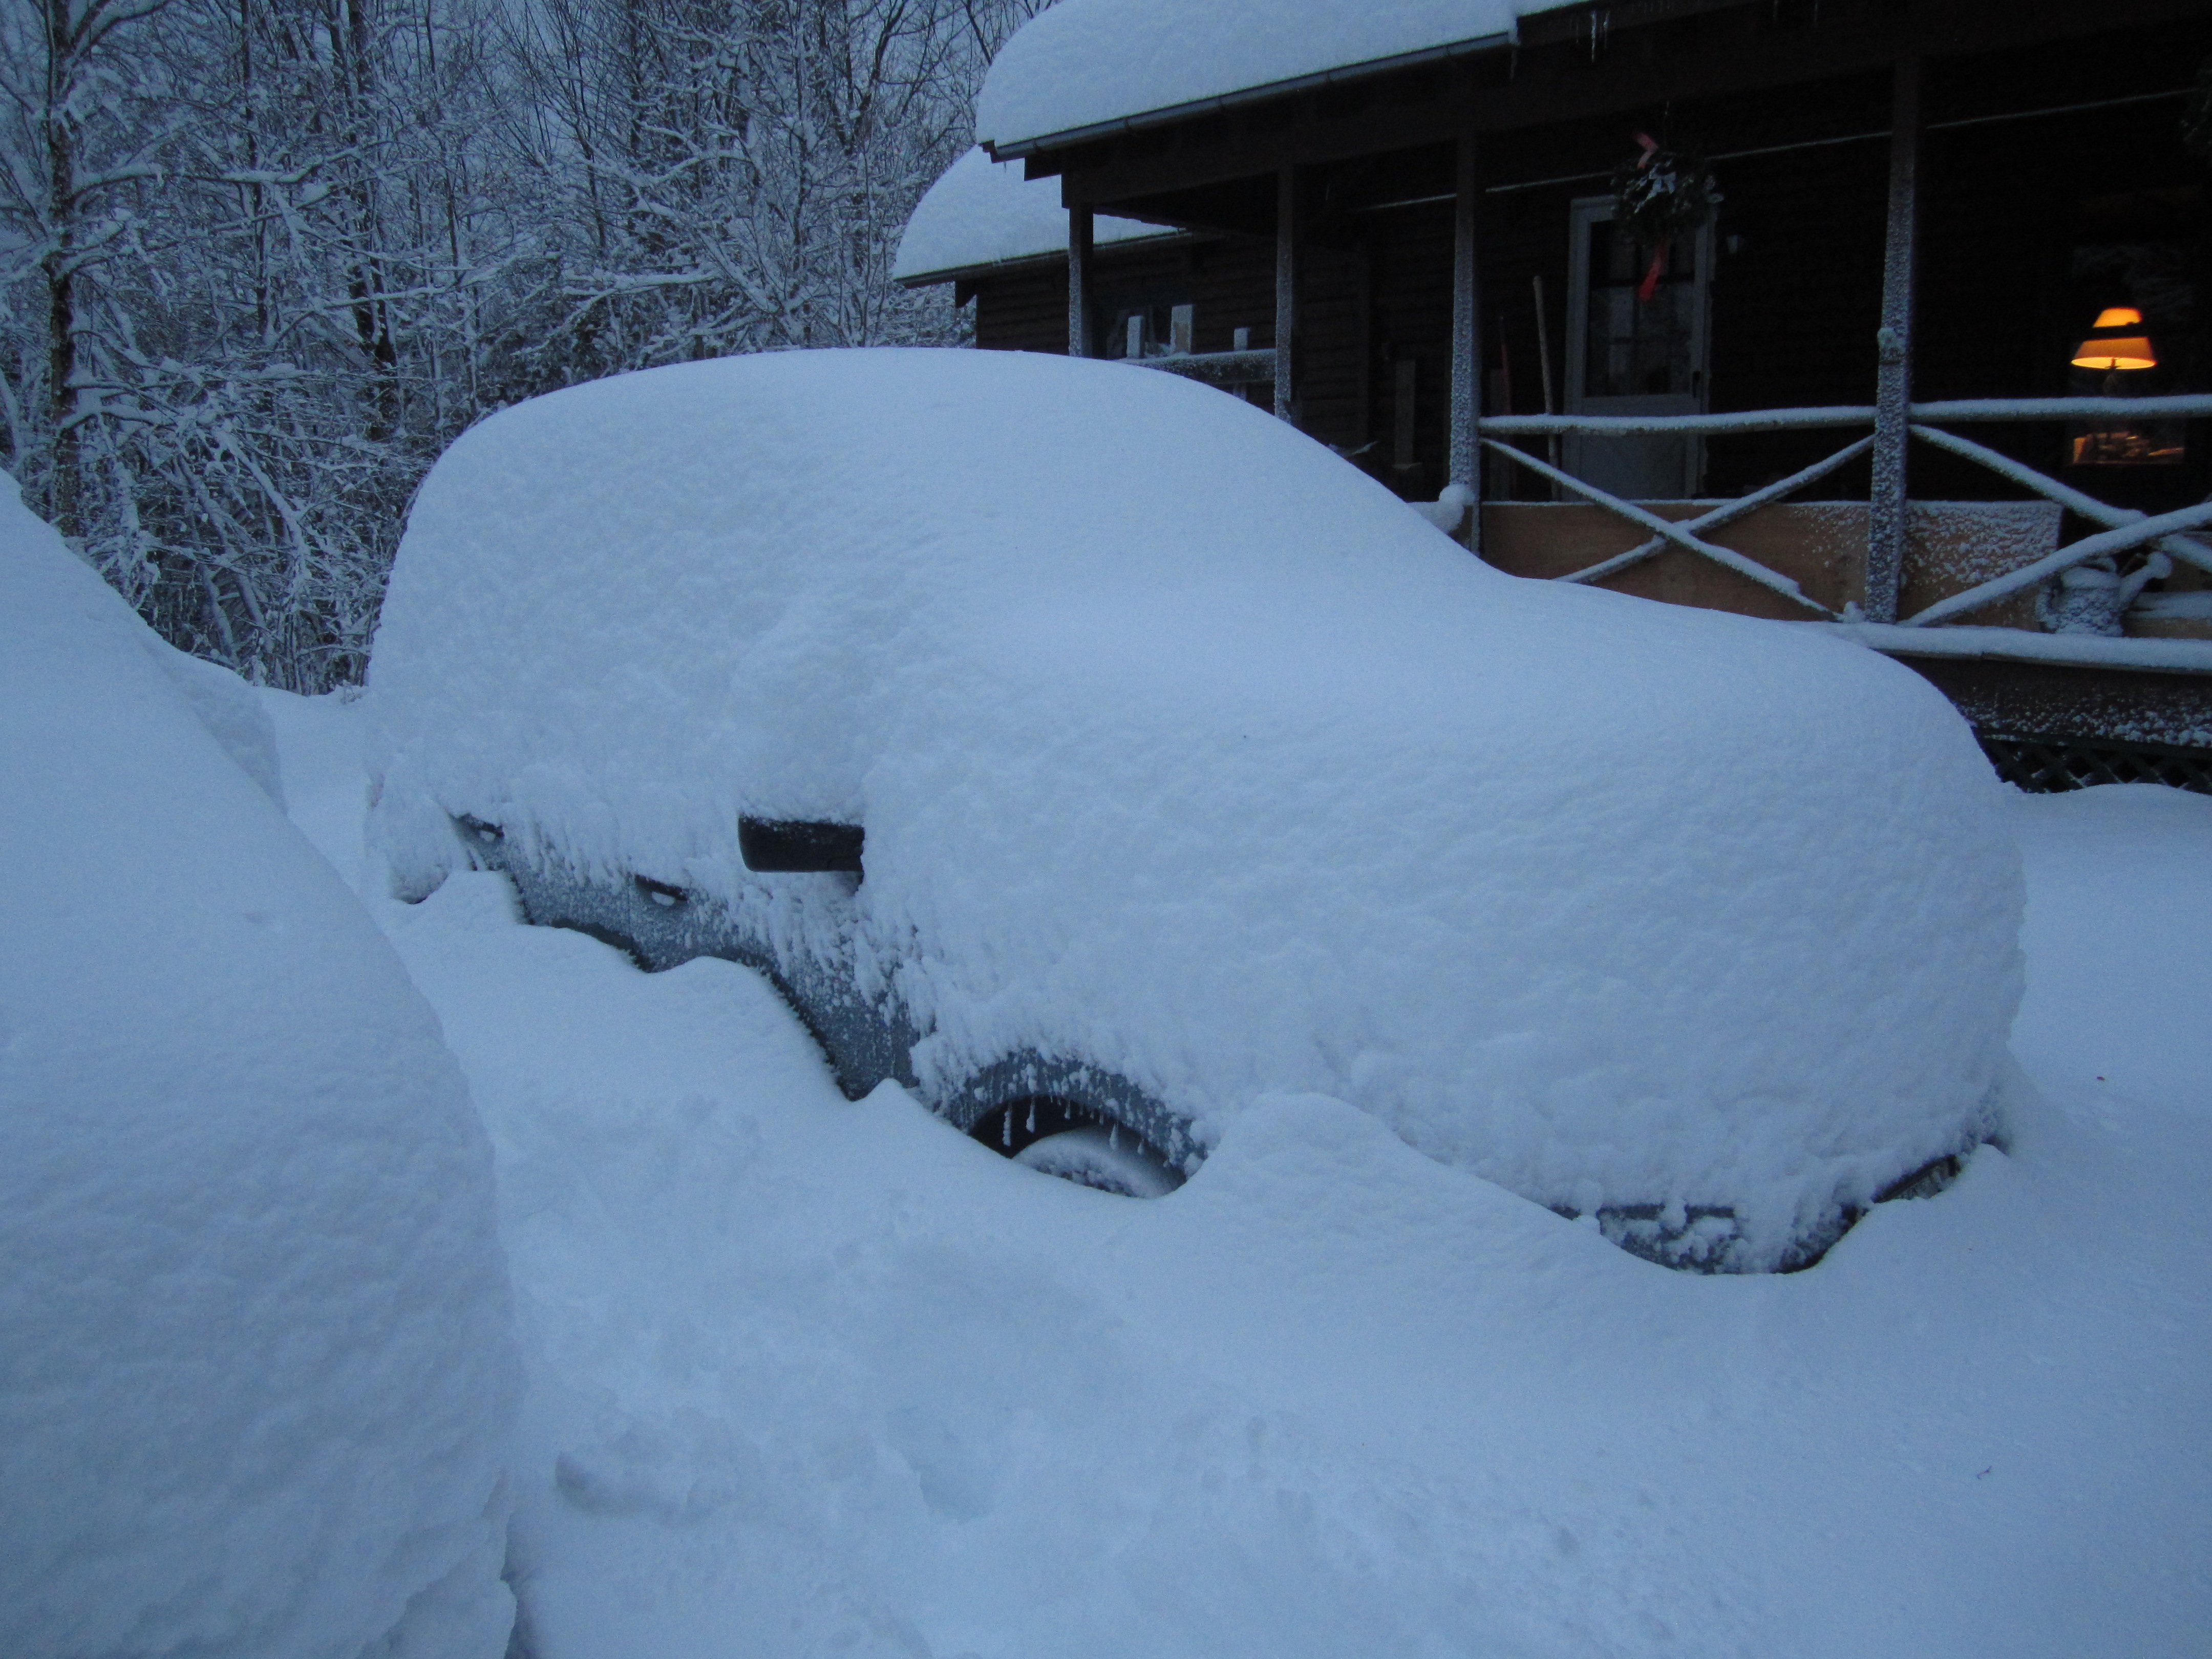
The reason why I got a wood stove back 20 years ago or so.
Shortly after moving to Maine in 1973, I read that more than half the world's people used wood as a heat source, and I thought that to be sort of quaint. At our NNJ home in NNJ, we had a fireplace, but it was more for atmosphere than heat.
We moved from a Fort Kent apartment to our first house (tiny 2-story) in mid-May 1977 and couldn't wait to add a woodstove. I'd installed a Jotul 602 the day before the move. We've run woodstoves as a major heat source ever since - no chimney fires (yet).-
2
-
-
Still waiting. Looks like we get about 1/4" at best.
That 10" event is beyond my experience - tops was 8.90" on 27-28, 1971 at NNJ, PRE dropped 3.8" during daylight on the 27th then Doria 5.1" in the wee hours of 8/28.
PWM had 9.62" on 10/21/996, also 2.78" the day before. I'm confident there was a 10/24 in there someplace.-
1
-
-
5 hours ago, vortex95 said:
I did not want to bring up the "feels like" temp, as that is out of control as to abuse, but it can be of use b/c "the door swings both ways!" Once you get below 57 or 58 dew point, the heat index is actually lower than the air temp! I would bet not many mets know or actively realize this. I did not know until about 10 years ago!
I've spoken to ppl deployed in the Middle East, they can get perspective! After in that sauna for a few months, coming home, 95 feels great!
Acclimation I think is underrated. When I moved to DC, it took me a few summers to get used to the more 90 temps and the more persistent high dew point, which get into the upper 70s more common here. By my 3rd summer, I not longer noticed it. I adapted. However, the flip side is that I am not as tolerant to cold. This past winter was by far the coldest here since I moved here, and I noticed!
I think from the general public POV, they think MT is "cold." Most have zero idea what continental climate is like, and MT is the best state for temp swings in the CONUS. It is the only state in the Lower 48 that has had sig snow at lower elevations (I am taking Great Falls proper) in August (happened in 1992).
It's even worse for AK. Ppl are shocked to learn AK highest temps is 100 F, and that they get a lot tstms (all squeezed into J-J-A). Some locations get 30 days w/ thunder, more than a lot of New England! And of course, tornadoes. We had that one earlier this month, but I would bet good $$ there are 3-5 tornado in AK each year, just it is so large and sparsely populated, it precludes detection.Acclimation can occur without moving a bit. Sometime next month or early September we'll have a morning in the mid-upper 30s and it will feel quite chilly. In January that would be shirtsleeve weather. The early heat this month hit hard due to tall dews and not having had much real heat before that. With several weeks of mostly CoC since then, another big heat next month will take some more acclimation. Could happen - we've had only 2 heat waves here, each 3 straight 90+, and one came last year. In 28 summers, we've had 90+ on 23 days. June leads with 9 and August is 2nd with 7. Only 3 in July and 2 each for May/September.
30 thunder days in AK? That's twice my average here and last year we had a mere 5. Go far NW for SVR?
-
1
-
-
1 hour ago, Lava Rock said:
wtf, we're going to get porked hard.
Tenth to a quarter? (thru Fri) Would like to bust low.
-
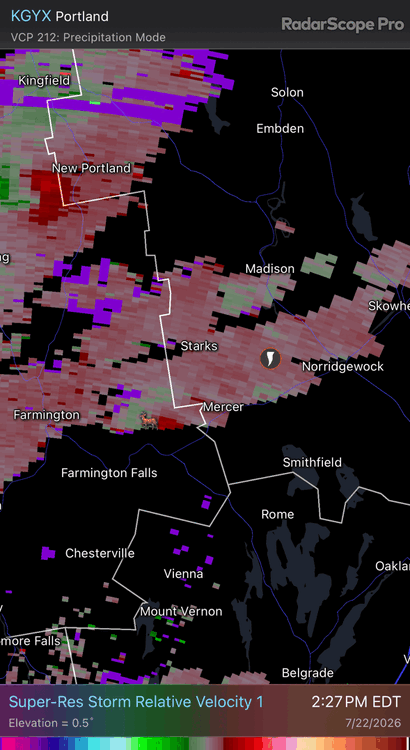
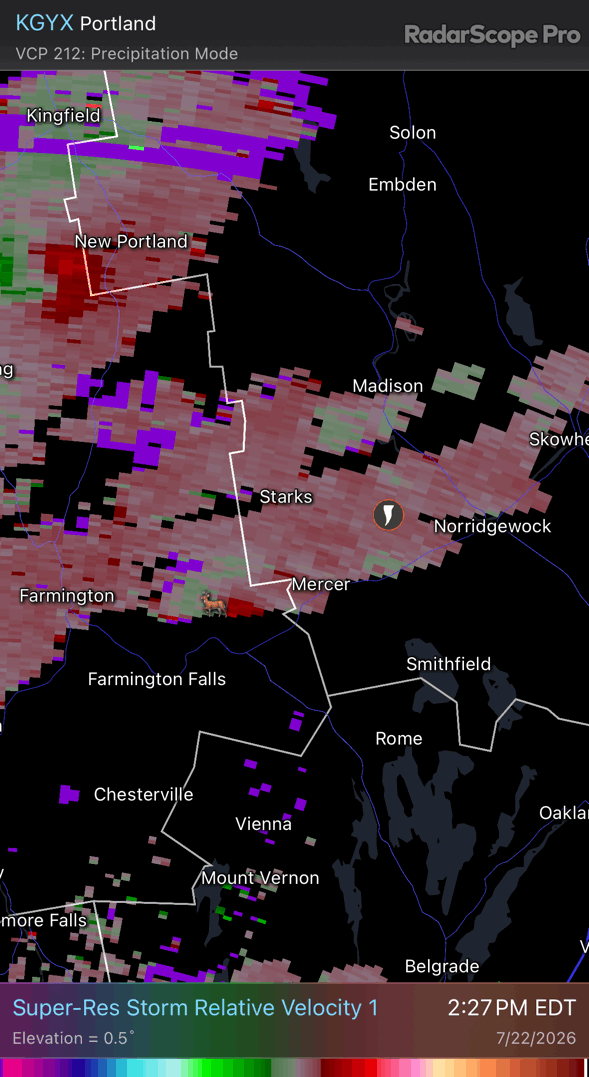
1 hour ago, ineedsnow said:
found a spot 14 on this map.. and yes I know it wont even be close for some that will say this is my call
")
.thumb.png.8d9871b0ab89a80c63d2637dd7f6c644.png)

-
1
-
-
54 minutes ago, ineedsnow said:
 no cool? what do you call the last couple weeks? dews near or over 70 for weeks? why didn't you tell us you moved to Florida?
July 1-4: 85/66 +10 (Dews 70+)
July 5-27: 76/53 -1 (7 mornings in the 40s)-
 1
1
-
-
45 minutes ago, Lava Rock said:
feels like we're going to get porked up here. anything <1" won't do much. We dry.
If you get <1", we're likely to get <1/2". Precip maps only go to Thurs aft - maybe something that evening?
Another CoC day here, 5th consecutive mostly sunny day - rare in July/August when most days are PC. Avg temps 23-27: 77/48.
-
1
-
-
7 minutes ago, dendrite said:
Mins on this day in 2001. Yes that’s a 45° at BED.
Someone get grandpa off the internet.
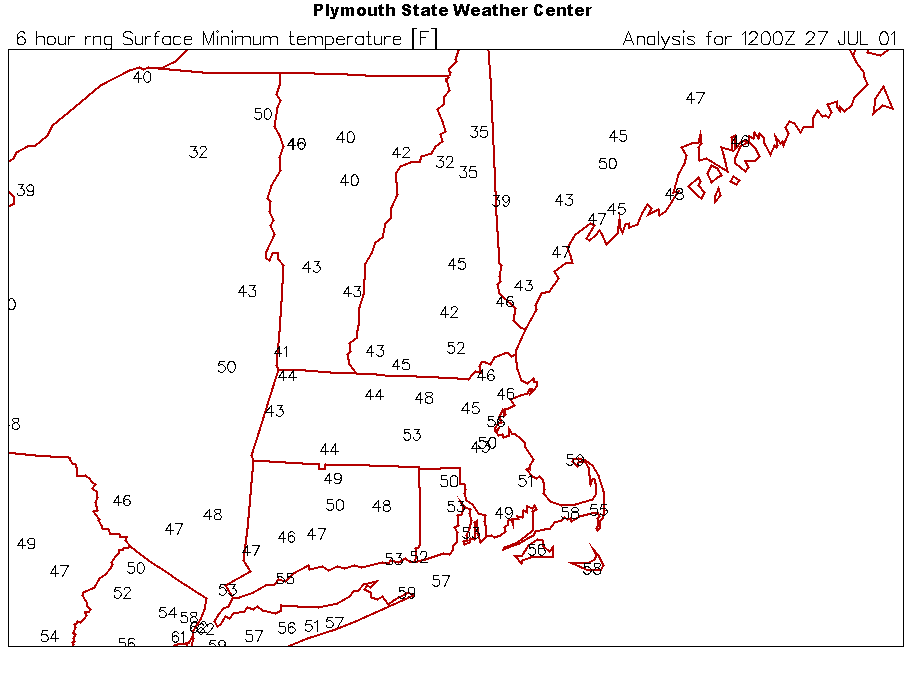
Frost at HIE - cool. We had 40/39 on 27-28 that year. Farther back/north, we lost half our pumpkins on July 31, 1978 in Fort Kent, and the next door neighbor's beans were torched - their garden was 2-3 feet lower than ours, probably had 31 while we only got down to 32.
-
2
-
-
14 hours ago, ineedsnow said:
the good news is July should average below normal for some now.. what a change
Yesterday's 76/47 (-4) dragged the monthly departure down to +0.8. My guess is 0.0 to +0.5 as the final figure. Rain thru yesterday is 2.04"; avg for July is 3.98". I think we're too far north/east to catch up.
-
1
-
-
27 minutes ago, forkyfork said:
if this nino happened 50 years ago this month would be -4
Maybe, but the 30-year norms of 50 years ago were about 2F lower than the 1991-2020s.
-
1
-
1
-
-
2 hours ago, kdxken said:
53° / 51° another cool start to what it looks like a beautiful day. Mild up beginning the second week of August? Hartford now stands at 0.4 above average for the month. What happened to the hottest month ever?
Heat/humidity lasted 4 days, 5th and following has been slightly BN. 78/46 here yesterday.
-
1
-
-
12 hours ago, Damage In Tolland said:
There’s posters here ( ACATT) as an example .. that think this is chilly and below normal and that the month of July is and will finish BN. It’s hard to understand or fathom , but just look at their posts
I lean ACATT by preference (not forecasting) but think we'll finish July AN, thanks to its first 4 days. 7/1-4 was 10.3° AN while the next 19 days have run 0.6° BN and I think the remainder will be close to norms here.
Enter August 2, 1975!
PWM: 103 BGR: 102 BHB: 100 at water's edge. All 3 all-timers.
Since my first swim in Maine salt water (August 1952), Hot Saturday is my only time of swimming in actual warm salt water here, just south of Otter Cliffs in Acadia.-
1
-
-
15 hours ago, FXWX said:
I'm at ~1,200 ft in Burlington CT and twice say lightning flashes over Rutland VT... About 135 miles away.
And I thought that seeing lightning in Rangeley while driving on US 1 in Searsport (100 miles apart) was amazing, but it was small potatoes compared to that.
-
17 hours ago, dendrite said:
Congrats @tamarack
The real fun was about 15 miles to our northeast i n Somerset County. We had a quick 0.20" 1:15-1:25 PM and with the 0.49" overnight, the garden was nicely watered (though July remains BN thru today).
-
1
-
-
8 hours ago, ineedsnow said:
Some good news! Average temps have maxed out and we start trending downward again!

We have a long "plateau" here, and since our averages are "live" (every daily entry affects them), the numbers here are as of today. Our daily mean warms above 65 on July 1 (June's warmth added a full week of 65+) and that lasts thru August 10. Today's average is 66.04, the only day (currently) above 66, so it's all downhill from here. Given the short/mid forecasts, I think this summer will end without any 66+.
Last night's 0.49" brought the month to 1.94". Average thru 7/22 is 2.82". Might cut the deficit a bit if the storms hit us this afternoon, but not much chance for 0.88" and it's dry for the next 4-5 days.
-
12 hours ago, vortex95 said:
Thanks. That's the challenge, is there systemic bias in either direction enough to make it statistically significant, or does it all work out in the end? And then we have the notion that precision always equals accuracy! One line I will always recall, "we have very good models today that can give very precise-looking output that can be precisely wrong!"
I saw Fox Brook in the HYDCAR text product. They don't give any more info for stations in the decode format at least.
The forester with whom we contracted in 2011 for forest inventory and modeling once commented, "All models are wrong, but some are useful."
When Maine Public Lands contracted an inventory in 1999 (different contractor), the DOD had yet to remove the GPS scramble for non-military users. We had the foresters run their GPS units for 30 minutes on both the first and last of the 12-point cruise lines, with the goal of having the hundreds of scrambled hits averaging close to true location. We assumed the hits were truly random rather than biased.
-
2
-
-
2 hours ago, moneypitmike said:
The season is not record hot/cold until it's over. Let's' see how the remainder plays out.
Agree. July is running 2.4 AN so far. If the month finishes at that mark, JJ 2026 would be 5th warmest of 29, respectable but no record.
Looking at the rest of July, I'm guessing we'll be 1-2° AN at the finish.-
1
-
-
0.21" brings the month to exactly 1.00". Yesterday's gloomy clouds made for a high of only 63. With a low of 47, the mean was 11° BN. Looks like July 2026 won't set a new warmest month, though I expect it to finish AN (currently 2.7 AN).
-
Still at cloudy 65°, not a great sign of convection to come.
-
1
-
-
15 hours ago, vortex95 said:
Good point. Yes, it does matter to an extent. But each site is different.
The below sounds pedantic and getting into the weeds, but I have found an appreciation of the details working w/ numbers, calcuations, and statistics, their rules, and how it applies to the sciences.
We know the history of BOS wx measuring issues -- temp, precip, and snowfall.
So this is not an isolated or new issue. And then you have the base issue of ASOS temp considered ok as long as it is within +- 2 F.
The point is marginal of error or uncertainty in measurement is rarely given in the mainstream. Output/results are often treated as absolute fact. This is not a good scientific practice. For example, If a number is known to be accurate to the ones place (whole number), expressing it with a decimal (like a tenth) introduces false precision. This implies you know the value more precisely than you actually do. So since ASOS is only reliable within +-2 F, see the problem here? And then you have individual site calibration issues at times independent of the sensor base accuracy. These wx sensors in the field are not high quality super precise like sensors used in a lab.
And a larger issue not directly related to precision/accuracy, artificial heat sources are becoming more of an issue w/ time, both on a local and large scale where many of these climate locations are, so biased warm is not an unreasonable assumption a lot the time.
Yes I know this complicates things, but if you are going to say that an avg temp over a long period of time is exceeded a previous record by tenths of a degree when you have issues like the above, we can't just ignore the limits of measurements and rules of what is precise/accurate. It gets worse when you see temps calculated out to the hundredths of a degree (global avg temp, as one example) That is two orders of magnitude above conventional sensor precision!
If the variance within that -/-2 F, once one has hundreds/thousands of observations, the averages should be valid to tenths at least. (Unless there's a consistent bias toward either + or -.) Works that way in forest inventory, at least.
Coldest I could find outside mtn location in New England is 47 at Fox Brook ME.
There's probably about 10 Fox Brooks in Maine. My guess is the one on T17R12, immediately west from the town of Allagash.
-
1
-
.png.7cbc1c2ac1060647836c5b396b418330.png)
Ju-ply 2026 Obs and Disco - Kicking it off with heat, humidity, and ... severe?
in New England
Posted
July 2026 numbers:
Avg max: 76.6 0.3 AN Hottest day, 87 on the 2nd
Avg min: 55.6 0.7 AN Coolest day, 46 on the 24th
Mean: 66.6 0.5 AN
Precip: 2.20" 1.72" BN Wettest day, 0.67" on the 22nd.
After having 6 days with thunder in June, we had only one in July, tying 2010 and 2023 for the lowest.
July '26 temps were +10 during the first 4 days and -1 on the next 27.
The month had 2 noteworthy events, first being the HHH of 1-3, upper 80s (avoiding 90+ thanks to the trees) with low 70s TD. 2nd was the brief squall on the 16th. It dropped 1/4" in 5 minutes with gusts approaching 50 mph and cut the power, causing our on-demand generator to run for 7.4 hours.