

psuhoffman
-
Posts
27,419 -
Joined
-
Last visited
Content Type
Profiles
Blogs
Forums
American Weather
Media Demo
Store
Gallery
Everything posted by psuhoffman
-
There is some similarities but some key differences. the pac pulls back way more then that on all guidance. Actually it pulls back too much on some long range guidance and the western ridge gets a bit too far west if anything. That block is centered too far SW with a trough over Greenland. The look across Europe and North Atlantic is not similar at all. Overall that doesn’t look as much like what the long range guidance is spitting our right now as some other years Imo.
-
Lol gfs gets a storm trapped off the mid Atlantic for 48 hours and finally cools the column enough to give @Ji his digital snow.
-
That’s the plan and USUALLY how this pattern progresses. Not always. Always risk. Btw not shocked the GFS folded to everything else wrt losing the cutters into the block idea. Also not shocked we will still have temp issues though. The para GFS seems to be crushing it compared to the old op version. The new fv3 system really is a huge upgrade and ncep just needed time to fine tune it. Maybe over time they may close the gap with the ECMWF.
-
Top current analog to next weeks pattern is late January 1958. That would probably again force more patience then most have or want to have (it was another 2 weeks before things really got good)...but the end result of that pattern was a win.
-
I am not really factoring in the SSW just going by typical progression of what we see now. Maybe the SSW screws it up but I’m not versed enough in that to say. There was a SSW early in 2009/10 (then another in Feb 2010) and that never disrupted the -NAO. The pac took a dump on us for most of January but the AO/NAO remained tanked. The blocking that set in after the Feb 2018 SSW rolled straight through to May. But I’ve seen examples of this wax/wane pattern you are talking about also. We are still early enough that we could still cash in on another tanking of the AO in Feb into Mar if that’s how it goes down. That would be 1960 like. And yea I know some people just groaned but it’s December and people are acting like it’s February probably because of last year being so awful and missing a good threat in Dec. I get it patience is low. But snow in our area is an anomaly and you take it WHENEVER it comes!!!
-
By recent standards I think it was a great December in the NW 1/3 of the region. I had about 12” up here. That’s a great December even by my standards. I’m 1/3 to median snowfall with my 3 snowiest months to come.
-
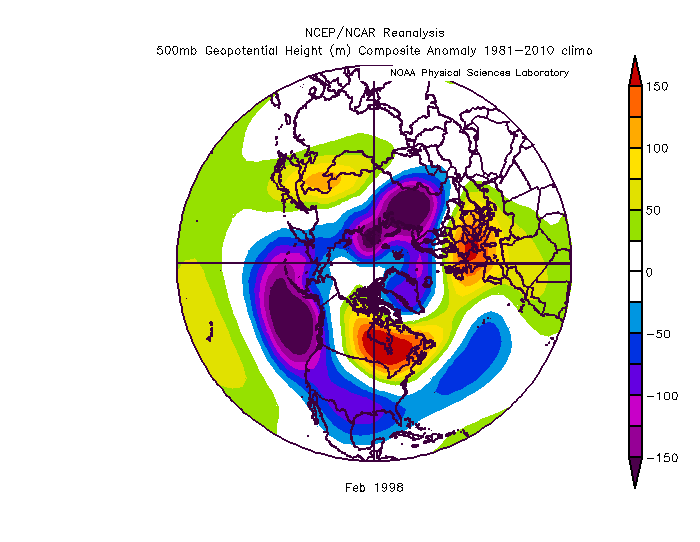
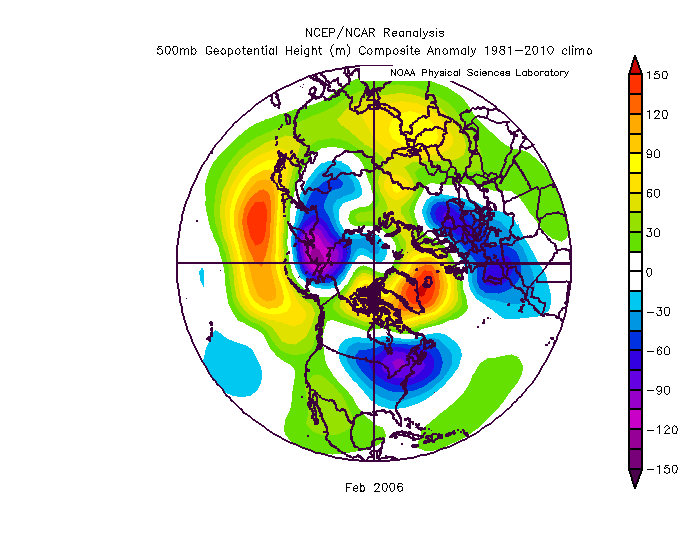
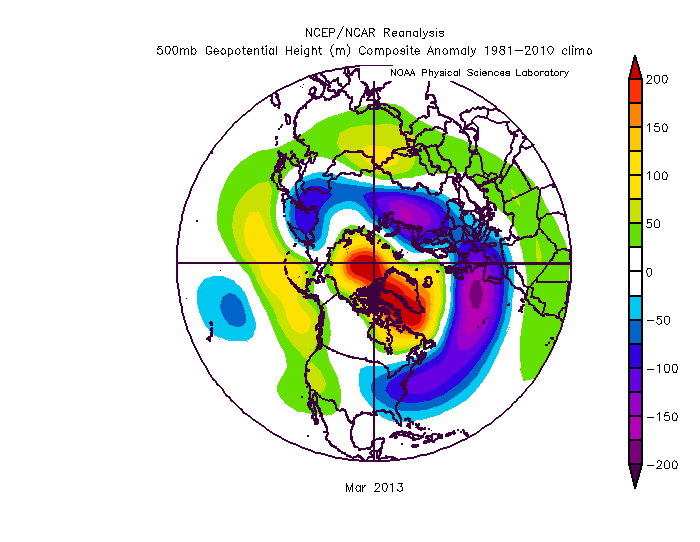
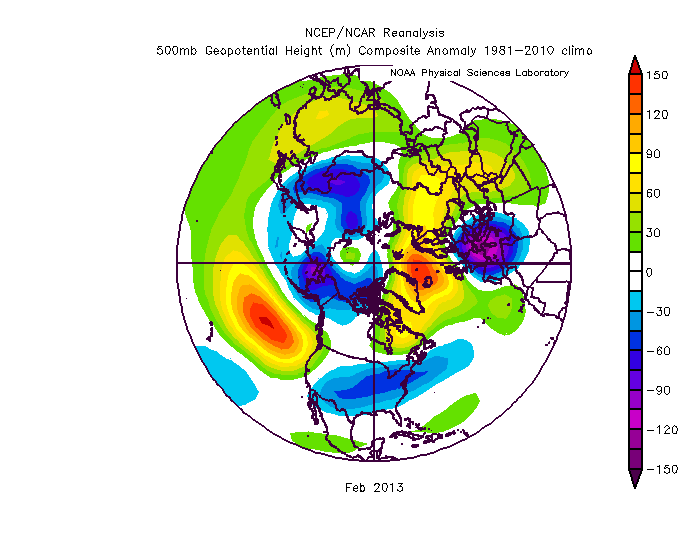
BTW I did not include 2013 and 2006 (even though they are being tossed around) in my comps because I don’t think they are as good matches. Feb 2013 the blocking was centered way too far NE for what we want and the PAC was an absolute floating dumpster fire level awful. March 2013 the pattern did get legit good and I know no one wants to hear that...but it was part bad luck and part just being a little too late. We got 2 perfect bowling balls that month but temps were marginal on the coastal plain (which is often a March issue) and both failed to come together perfectly to overcome that. You move both those storms to Jan/Feb and DC would have had 12” and 6” storms from those 2 systems. 2006 again the blocking was centered a bit east of ideal AND the pac was a lot worse then the base state has been so far this year. The result was an eastern trough centered too far north for our purposes. And yet we did still manage one MECS. But it wasn’t a great period overall. The look right now on all guidance (supported by a natural evolution of the base state we have seen so far in the Atlantic and Pac) looks a lot more like the evolution in 2009/2010/2016/2018. Obviously 2018 was significantly later in winter then the other 3 so you have to adjust for that.
-
One last point wrt this pattern and expectations. The fact that guidance doesn’t show some big blizzard RIGHT NOW isn’t a reason to worry. At this stage in the development of our recent severe blocks nothing was showing up either. Go back to a few days before the blocks formed in Feb 2018, Jan 2016, Dec 2010, Dec 2009...nothing was showing up on the radar then either. It wasn’t for at least another week after the block developed before we were tracking a discreet threat. But 2/4 ended up EPIC and the other 2 we did at least get several snows and at least 1 warning event from. So while this “could” fail history says we probably get at least some snow from a pattern like this and there is a very good chance it’s a lot of snow...by our standards...but we have to be patient.
-
But it isn’t snowing. sorry Ji hacked my computer
-
FWIW the para GFS last few runs looks much more like the euro and CMC in the long range with systems tracking south of us. Snow is still a long shot until after the 15 or so due to lack of cold but it’s interesting the para gfs has aligned with the euro in the long range a lot more often and has been killing the GFS on synoptic features in the medium to long range imo. It even picked up on this Sunday system before the euro. It did run too cold but it was the closest to reality of all the globals and that’s not the first time this cold season. This upgrade looks pretty significant.
-
When my worst case is we end up with a mediocre instead of great patter (AFTER) a week of a great pattern...we’re doing pretty good.
-
Is the Jan 20 HECS going to delay the start of the civil war?
-
@frd we will see what tonight’s EPS weekly says but the last run and the extended GEFS runs this week linger blocking straight through into February. My biggest fear isn’t the high latitudes it’s the pacific. But not the fear others have. I’m actually more worried if the N PAC vortex pattern breaks down we resume a more canonical Nina look. This here from the GEFS extended would be problematic. We would be fighting a SE ridge in that look. We want that N PAC trough to stick around to direct that ridging into the west coast more and keep it from popping out there in the central PAC. ETA: it’s way far out and not worth really worrying about yet. Just saying if we fail that’s my most likely reason. EETA: that look isn’t the worst. It’s not a shutout look. But it’s a look that mutes our chances to cash in a but. Storms might try to amplify west...or we could see a typical Nina miller B pattern with that look that makes it harder to cash in here. Still there a better look then we had all last year just pointing out what my bigger fear then the blocking is.
-
Their ability to predict the high latitudes that far out is very low. The reason I had confidence in the blocking coming now is it made sense wrt progression of features I could already see and had faith in not in fantasy land ranges. It’s normal for blocking to wax and wane and sometimes a relax is when our best chances come. We don’t want a full break down but I’m not worrying about that yet. Guidance has spooked us many times breaking down blocking at long range only to have it simply be a relax or in some cases not even a relax. History strongly suggests when we see blocking of this magnitude develop it lingers quite a while. I would ride that for now.
-
@Ji we gonna do our normal “thing” again where the first week of a blocking regime you whine constantly about “what good is a block when it’s still not snowing” and I say wait we typically do better on the backside of blocking regimes not the front. Just asking. I’m ready.
-
Pretty sure this temp profile will work fine
-
Deepest trough in the northern Hemisphere showing up over the eastern US. And a tiny spec of “Barney” for the first time in how long...
-
@Ji btw I am not saying I don’t dream bigger or a bigger result isn’t very plausible. There are some signs the Nina isn’t driving this bus. Maybe we cash in big. But I personally don’t like to set my bar that high and be disappointed all the time.
-
But we are still within a rather hostile pac background state and a healthy Nina to boot so maybe we need to be realistic. For me I feel like getting a good result “for a Nina” should be the goal. At least one nice region wide warning level storm and to beat median snowfall. That’s pretty rare for a Nina. History says when we get blocking in a Nina we get some snow and avoid a total dud winter but only 1996 had big results by non Nina standards. But 1996 is out there as “possible” but setting the bar at a 1/100 year type outcome for a Nina is kinda setting yourself up to be disappointed Imo. But you do disappointed well...it’s your defining characteristic so I guess roll with it!
-
Oddly the pattern better matches Feb 2010 then Dec 2010 on profs wrt blocking and trough location imo
-
It’s not way out at day 15 anymore. Guidance has actually been speeding up the progression. It gets even better after this
-
That or the wave after are my guess
-
@Ji the last 2 weeks we had a bad track because of the WAR. If we get a legit NAO block that issue will go away
-
Dude it snowed 15 days ago and I had snow-cover for a week. It hasn't been a warm winter. Its been a poor storm track winter I’m not talking about December. I’m talking about what’s coming. That 920 mb vortex cruising into the Bering is about to flood us with pac puke. That’s going to take some time to recover from.
-
The storm in front slides east instead of north which opens a crack for that to cut. Still I doubt it cuts to that extreme in reality. That was odd. And it’s 14 days away so I wouldn’t worry at all. In 6 hours we get a different solution.


