PhiEaglesfan712
-
Posts
1,412 -
Joined
-
Last visited
Content Type
Profiles
Blogs
Forums
American Weather
Media Demo
Store
Gallery
Everything posted by PhiEaglesfan712
-
2024-2025 La Nina
PhiEaglesfan712 replied to George001's topic in Weather Forecasting and Discussion
If this is right, then a January 2011 redux is almost certainly going to happen. However, I am very skeptical of any of this coming to fruition. -
2024-2025 La Nina
PhiEaglesfan712 replied to George001's topic in Weather Forecasting and Discussion
No "cold oval" for late January: Hopefully, this means a return to cold weather during the first week of February. -
E PA/NJ/DE Winter 2024/25 Obs/Discussion
PhiEaglesfan712 replied to JTA66's topic in Philadelphia Region
Even if we don't get a Christmas miracle this year, we'll always have 1998. On the morning of Dec. 22, temps were in the mid-60s before dropping drastically throughout the day. That set the stage for an unexpected snowstorm on Dec. 23-24.
-
2024-2025 La Nina
PhiEaglesfan712 replied to George001's topic in Weather Forecasting and Discussion
Yeah, here are the subsequent Jan PNAs for non-Nino high PNA Dec, following warm Nov: 2021 +0.19 (Dec 2020: +1.58) 2006 +0.43 (Dec 2005: +1.38) 1986 +0.97 (Dec 1985: +1.39) Based on these analogs, the PNA should be slightly positive (between 0 and 1). By the way, all of these years had warmer Januarys, and delayed cold until February. -
2024-2025 La Nina
PhiEaglesfan712 replied to George001's topic in Weather Forecasting and Discussion
If the pattern supports a shift to cold, shouldn't it look something like this, and not a cold oval over the heart of I-95? -
2024-2025 La Nina
PhiEaglesfan712 replied to George001's topic in Weather Forecasting and Discussion
More realistic forecast (no cold oval):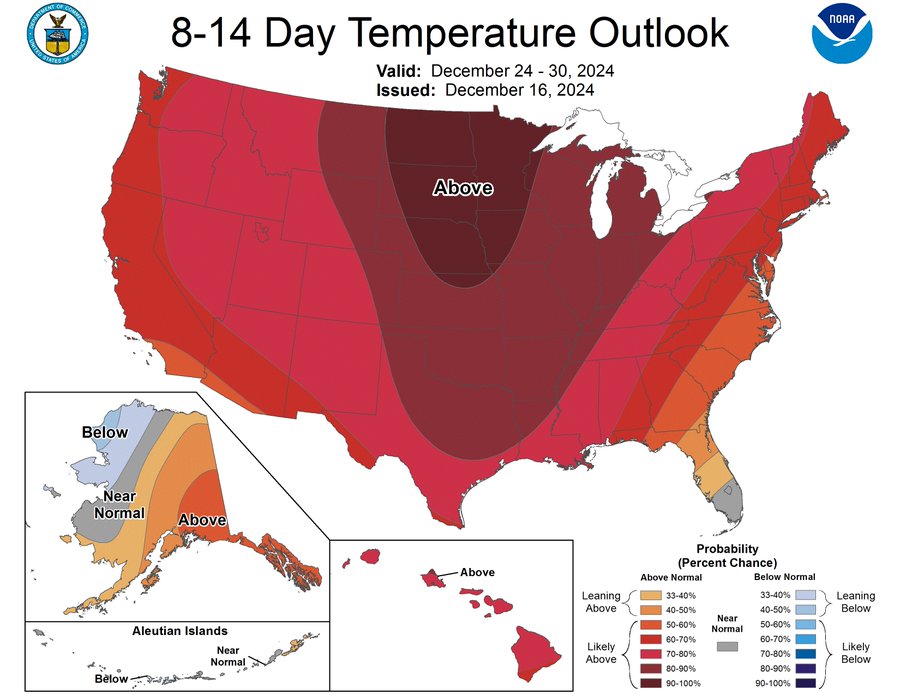
-
2024-2025 La Nina
PhiEaglesfan712 replied to George001's topic in Weather Forecasting and Discussion
Yeah, that "cold oval" isn't going to happen, lol. -
2024-2025 La Nina
PhiEaglesfan712 replied to George001's topic in Weather Forecasting and Discussion
PHL's last snowfall of over a foot was Jan. 22-23, 2016. In fact, we can't seem to get past 8 in. since then. Places west got foot plus totals on Jan. 31-Feb. 2, 2021, while places east got foot plus totals on Jan. 28-29, 2022. Talk about bad luck. -
2024-2025 La Nina
PhiEaglesfan712 replied to George001's topic in Weather Forecasting and Discussion
Yeah, I also pointed out the one month gap between 2021 and this year. November 2024 = October 2021 (torch month) December 2024 = November 2021 (cool month) January 2025 = December 2021 (another torch month)? February 2025 = January 2022 (cool and snowy month)? -
2024-2025 La Nina
PhiEaglesfan712 replied to George001's topic in Weather Forecasting and Discussion
There were 7 Junes colder than 1992 and 2009 where I lived from 1974-2024 (including 2023). 1992 and 2009 are in red, colder years in blue. 70.3 72.2 75.2 68.6 72.6 69.1 70.6 72.0 68.7 72.0 73.0 68.8 73.8 74.6 72.3 74.7 72.2 75.7 71.3 74.4 78.1 74.3 73.0 71.1 71.5 72.9 72.6 75.2 73.9 71.3 71.8 74.8 72.8 73.8 76.4 71.1 78.2 75.4 73.6 74.6 74.5 74.8 74.2 74.6 72.7 73.9 75 75.1 74.4 70.6 77.4 -
E PA/NJ/DE Winter 2024/25 Obs/Discussion
PhiEaglesfan712 replied to JTA66's topic in Philadelphia Region
Not really, 1989 turned cold well before December started. This year was very warm in November. It reminds me more of 2005 or 2020. Both years were colder than average and snowy in February. December 2005 and December 2020 were +PNA, like this December. -
2024-2025 La Nina
PhiEaglesfan712 replied to George001's topic in Weather Forecasting and Discussion
I'm not asking for a Top 10 cold month. I realize that JFM 2014 and JFM 2015 won't come around too often. One cold month, like February 2021 or January 2022, once in a while would be nice. Heck, we even got our coldest June since 1985 in 2023. June 2023 was probably are coldest temperature departure to average this decade. Thing is, we haven't had a sustained cold month (-1F to average) since then. -
E PA/NJ/DE Winter 2024/25 Obs/Discussion
PhiEaglesfan712 replied to JTA66's topic in Philadelphia Region
I'd argue we've been in a secular -PDO phase since mid-1998. The +PDO phase in the mid-2010s was a cyclical one, which pretty much coincided with the 2014-16 el nino. Other than that, we've been -PDO most of the time for the past 25+ years. My guess is that we'll flip to a secular +PDO state with the next el nino, either in 2026-27 or 2027-28. The last time we flipped from secular -PDO to secular +PDO was in mid-1976, and we got a nice stretch of winters that followed. 1949-1976 -PDO 1976-1998 +PDO 1998-present -PDO -
2024-2025 La Nina
PhiEaglesfan712 replied to George001's topic in Weather Forecasting and Discussion
I'm very skeptical of a cold January. The only time we had both a cold December and January after 2010-11 was 2017-18, and even that one warmed up during the 2nd half of January, leading into the February torch. The warm November/+PNA non-el nino cool December composites (1985-86, 2005-06, 2020-21) are saying warm January and cool February. In fact, all 3 years had below normal snow in January, and 10+ in snow in February at PHL: 1986: Jan 32.8F, 3.4 in snow; Feb 32.1F, 11.5 in snow 2006: Jan 40.7F, 0.4 in snow; Feb 35.0F, 12.0 in snow 2021: Jan 35.7F, 3.0 in snow (all of Jan 31); Feb 34.2 F, 14.3 in snow My gut feeling tells me we're in for an extended warm pattern. -
2024-2025 La Nina
PhiEaglesfan712 replied to George001's topic in Weather Forecasting and Discussion
Warm November/+PNAs for non-Nino cool December composite: -
2024-2025 La Nina
PhiEaglesfan712 replied to George001's topic in Weather Forecasting and Discussion
I've been saying 2005 is the best fit. 2020 and 1985 might also be good analog years. All had a warm November before turning cold in December. -
E PA/NJ/DE Winter 2024/25 Obs/Discussion
PhiEaglesfan712 replied to JTA66's topic in Philadelphia Region
I think the back half of the winter will be cold, but I highly doubt we're going to get historical cold like we did after that event. Boy did the bottom fall out of the thermometer: 1979-01-09 26 17 21.5 -12.4 43 0 0.00 0.0 0 1979-01-10 31 16 23.5 -10.3 41 0 0.00 0.0 0 1979-01-11 25 18 21.5 -12.2 43 0 T T 0 1979-01-12 27 16 21.5 -12.1 43 0 0.21 2.1 T 1979-01-13 39 26 32.5 -1.0 32 0 0.53 T 2 1979-01-14 43 26 34.5 1.1 30 0 0.02 0.0 0 1979-01-15 29 21 25.0 -8.3 40 0 0.00 0.0 0 1979-01-16 45 26 35.5 2.2 29 0 0.00 0.0 0 1979-01-17 35 24 29.5 -3.7 35 0 0.09 0.9 0 1979-01-18 32 13 22.5 -10.7 42 0 0.00 0.0 T 1979-01-19 21 10 15.5 -17.7 49 0 0.00 0.0 T 1979-01-20 34 20 27.0 -6.1 38 0 1.50 0.4 T 1979-01-21 56 34 45.0 11.9 20 0 1.32 0.0 0 1979-01-22 39 30 34.5 1.4 30 0 0.00 0.0 0 1979-01-23 41 22 31.5 -1.6 33 0 0.00 0.0 0 1979-01-24 55 34 44.5 11.4 20 0 1.18 0.0 0 1979-01-25 46 31 38.5 5.3 26 0 0.02 0.2 0 1979-01-26 43 32 37.5 4.3 27 0 0.01 0.1 T 1979-01-27 46 32 39.0 5.8 26 0 0.00 0.0 0 1979-01-28 40 30 35.0 1.7 30 0 0.14 1.3 T 1979-01-29 45 35 40.0 6.6 25 0 0.00 0.0 0 1979-01-30 41 31 36.0 2.6 29 0 0.00 0.0 0 1979-01-31 34 28 31.0 -2.5 34 0 0.09 0.9 0 1979-02-01 29 23 26.0 -7.6 39 0 T T 1 1979-02-02 37 24 30.5 -3.2 34 0 0.00 0.0 T 1979-02-03 36 19 27.5 -6.3 37 0 0.00 0.0 0 1979-02-04 43 22 32.5 -1.5 32 0 T T 0 1979-02-05 26 15 20.5 -13.6 44 0 0.00 0.0 0 1979-02-06 29 12 20.5 -13.7 44 0 0.00 0.0 0 1979-02-07 25 21 23.0 -11.4 42 0 0.59 7.6 T 1979-02-08 29 13 21.0 -13.5 44 0 T T 7 1979-02-09 19 8 13.5 -21.2 51 0 T T 4 1979-02-10 18 -1 8.5 -26.4 56 0 T T 3 1979-02-11 14 -2 6.0 -29.1 59 0 0.00 0.0 3 1979-02-12 16 2 9.0 -26.2 56 0 0.43 4.8 2 1979-02-13 15 5 10.0 -25.4 55 0 0.00 0.0 7 1979-02-14 14 2 8.0 -27.6 57 0 0.04 0.4 6 1979-02-15 23 12 17.5 -18.3 47 0 0.05 0.3 6 1979-02-16 24 8 16.0 -20.0 49 0 0.10 0.2 6 1979-02-17 13 2 7.5 -28.7 57 0 0.00 0.0 6 1979-02-18 14 0 7.0 -29.5 58 0 0.02 0.4 6 1979-02-19 30 12 21.0 -15.7 44 0 1.03 13.9 12 1979-02-20 35 1 18.0 -18.9 47 0 0.00 0.0 20 1979-02-21 37 18 27.5 -9.6 37 0 0.34 0.0 16 1979-02-22 48 30 39.0 1.6 26 0 0.00 0.0 9 1979-02-23 43 30 36.5 -1.1 28 0 0.23 0.0 6 1979-02-24 43 37 40.0 2.2 25 0 1.84 0.0 2 1979-02-25 44 37 40.5 2.4 24 0 0.71 0.0 T 1979-02-26 41 36 38.5 0.2 26 0 1.02 0.0 0 1979-02-27 39 35 37.0 -1.6 28 0 0.04 T 0 1979-02-28 54 28 41.0 2.2 24 0 0.00 0.0 0 -
E PA/NJ/DE Winter 2024/25 Obs/Discussion
PhiEaglesfan712 replied to JTA66's topic in Philadelphia Region
I feel like we're going to get a warm January and a backloaded winter: -
E PA/NJ/DE Fall 2024 Obs/Discussion
PhiEaglesfan712 replied to Rtd208's topic in Philadelphia Region
Let's make it 10 straight, and hopefully the Bills beat the Lions to give us some help.- 1,105 replies
-
- 1
-

-
- tropics
- heavy rainfall
- (and 5 more)
-
E PA/NJ/DE Fall 2024 Obs/Discussion
PhiEaglesfan712 replied to Rtd208's topic in Philadelphia Region
All I know is that it's going to be warm by December 29, when I'm at the Linc for the Cowboys game.- 1,105 replies
-
- 1
-
-
- tropics
- heavy rainfall
- (and 5 more)
-
2024-2025 La Nina
PhiEaglesfan712 replied to George001's topic in Weather Forecasting and Discussion
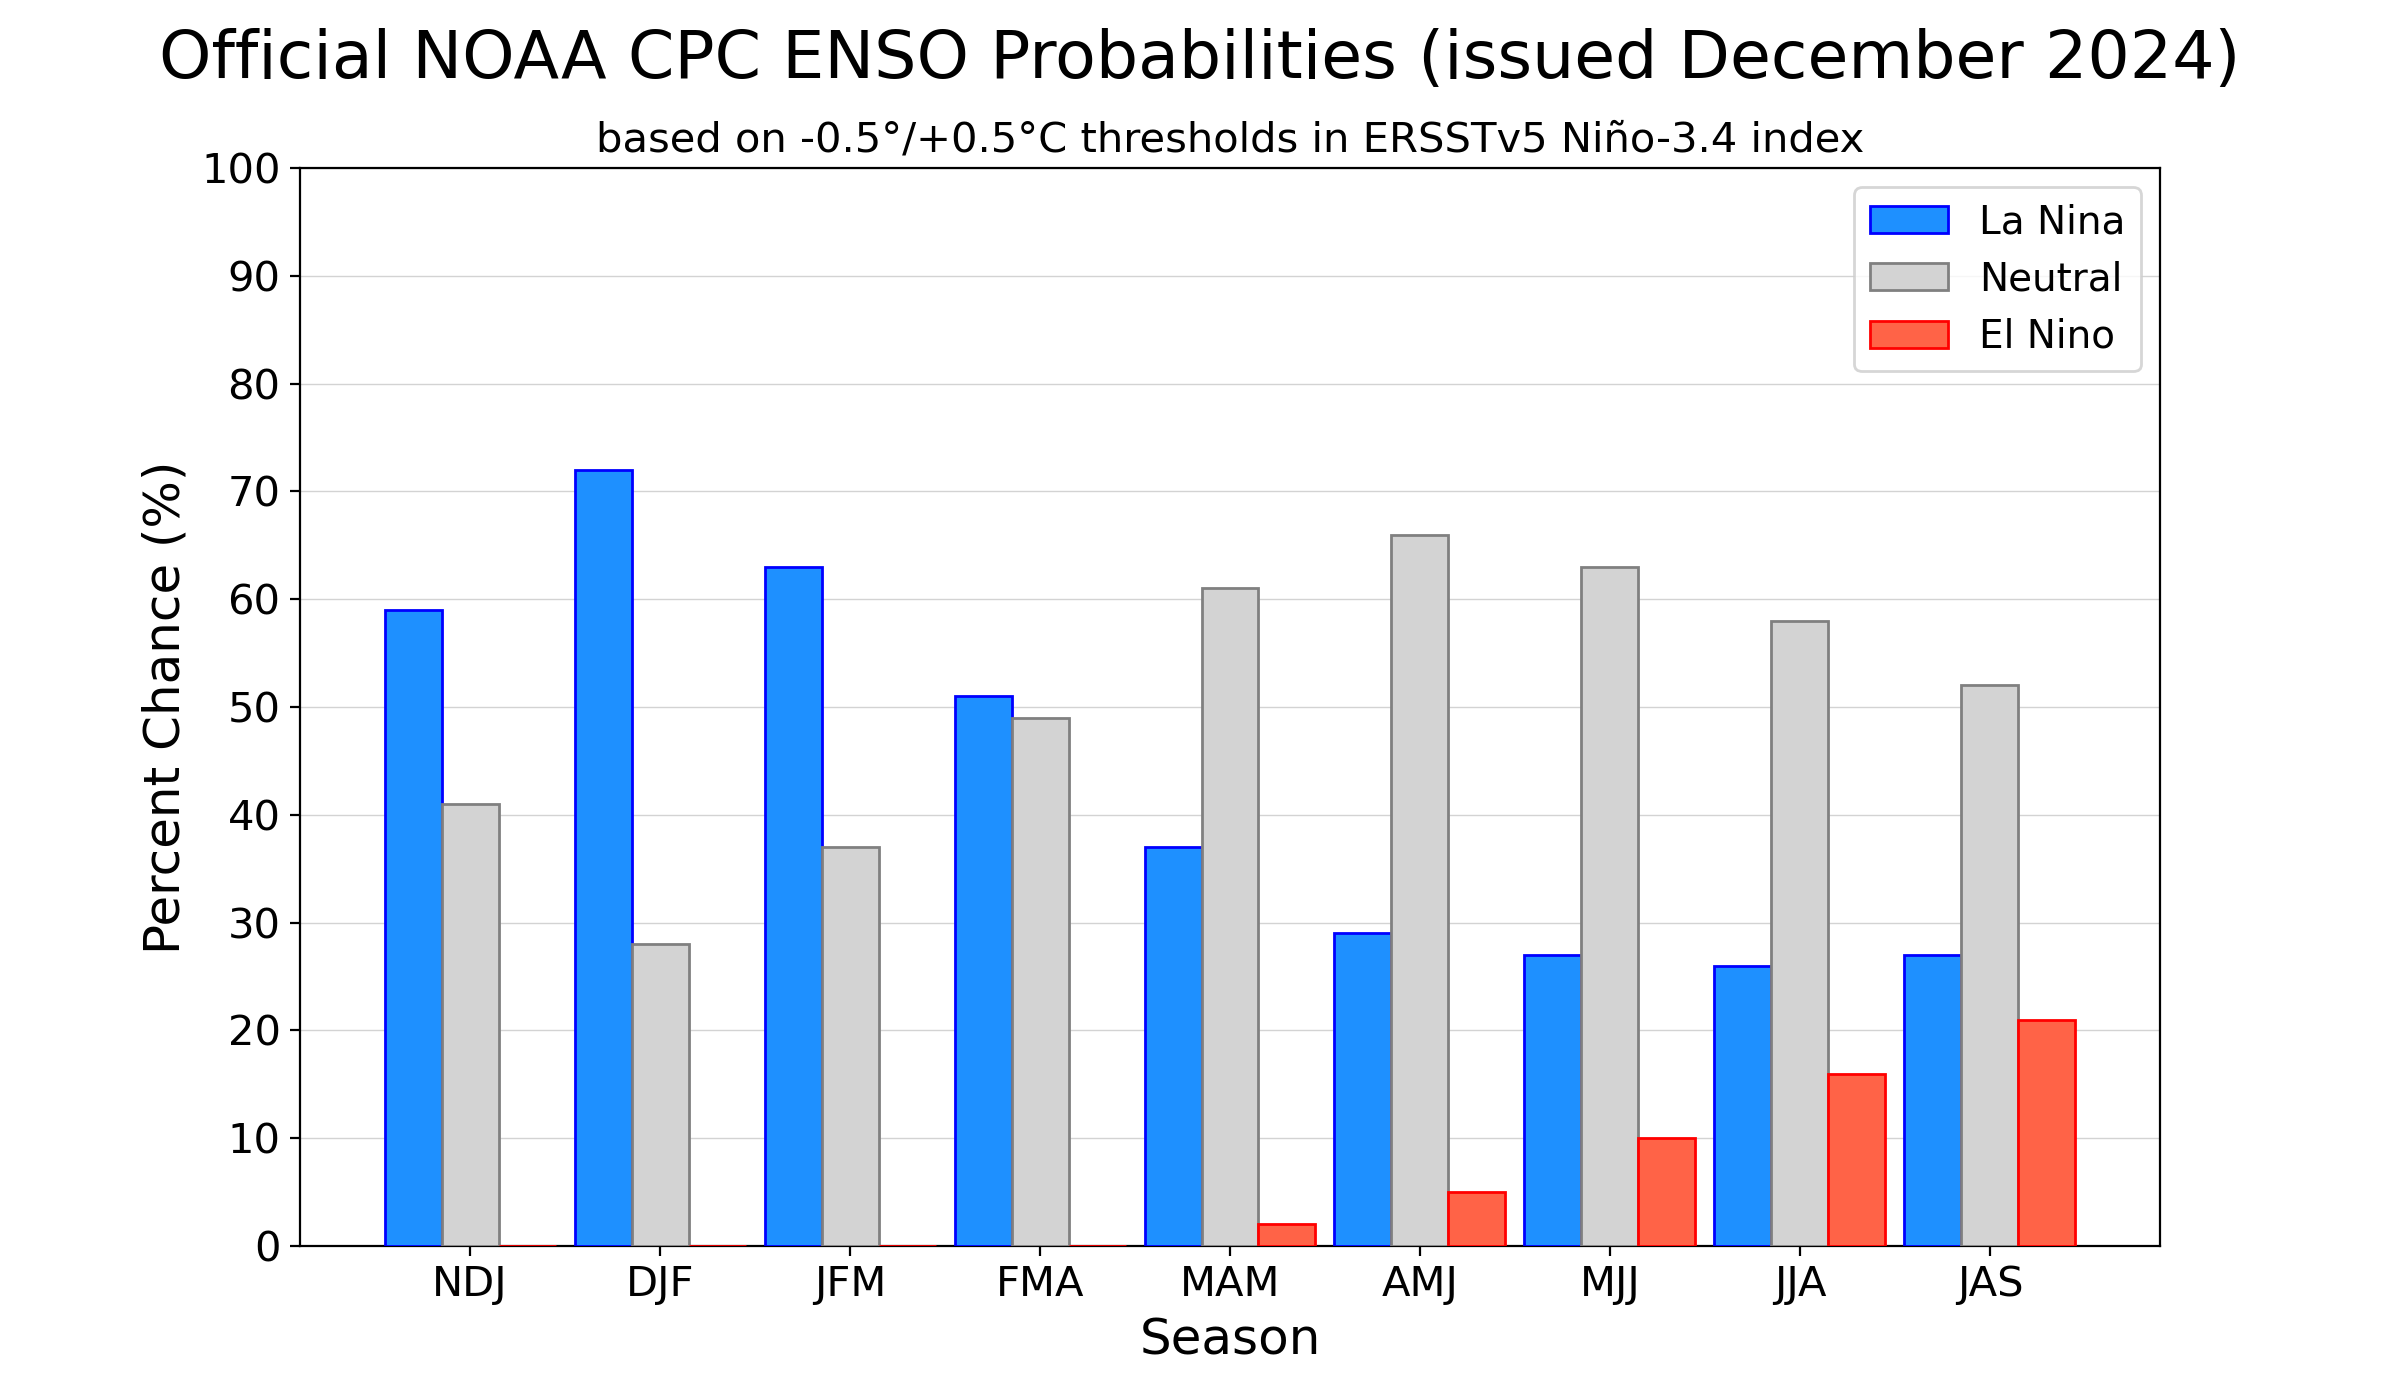
High probability of an ENSO neutral year in 2025-26:
-
2024-2025 La Nina
PhiEaglesfan712 replied to George001's topic in Weather Forecasting and Discussion
September was still cool where I lived, so the unrelenting warmth was really only October and November. The most recent fall with that temperature profile was 2020. There really wasn't a torch that winter, but we did have a notable snow shut-off the 2nd half of December and almost all of January. February was the cold and snowy month that winter. -
2024-2025 La Nina
PhiEaglesfan712 replied to George001's topic in Weather Forecasting and Discussion
12-13 torched more in December than in January. Also notable is that November 2012, with the aftermath of Hurricane Sandy, was below average temperaturewise for most of the East. This is opposite of what happened in 2024. 05-06 seems to be the best fit so far this year. November temperature/precip profile (as well as the beginning of December), active late hurricane season, and possible late la nina almost fits this year perfectly. However, if we don't get a la nina, don't discount 92-93. That would be the only time in the last 50+ years where a strong el nino didn't transition to a la nina. But I think you're probably right about next year. 93-94 and 13-14 look like early leads for a 2025-26 analog. -
2024-2025 La Nina
PhiEaglesfan712 replied to George001's topic in Weather Forecasting and Discussion
Possible backloaded winter: -
E PA/NJ/DE Fall 2024 Obs/Discussion
PhiEaglesfan712 replied to Rtd208's topic in Philadelphia Region
Now, why couldn't this happen during our cold pattern?