
DarkSharkWX
-
Posts
675 -
Joined
-
Last visited
Content Type
Profiles
Blogs
Forums
American Weather
Media Demo
Store
Gallery
Posts posted by DarkSharkWX
-
-
-
16 minutes ago, Ralph Wiggum said:
yeah warmer SSTs mean more warm ocean influence but also more moisture. so that does mean whenever we do get a big storm, they are getting bigger in snowfall totals because of the increase moisture source(from GOM and atlantic ocean)
-
2 minutes ago, Terpeast said:
A suppressed OTS look is what we want to see at range. I think it trends closer to the coast over time.
My bigger concern is the airmass.
yeah would much rather it look suppressed/OTS now than having it hitting us right now, if we get the canadian high to trend stronger our cold air worries should lessen
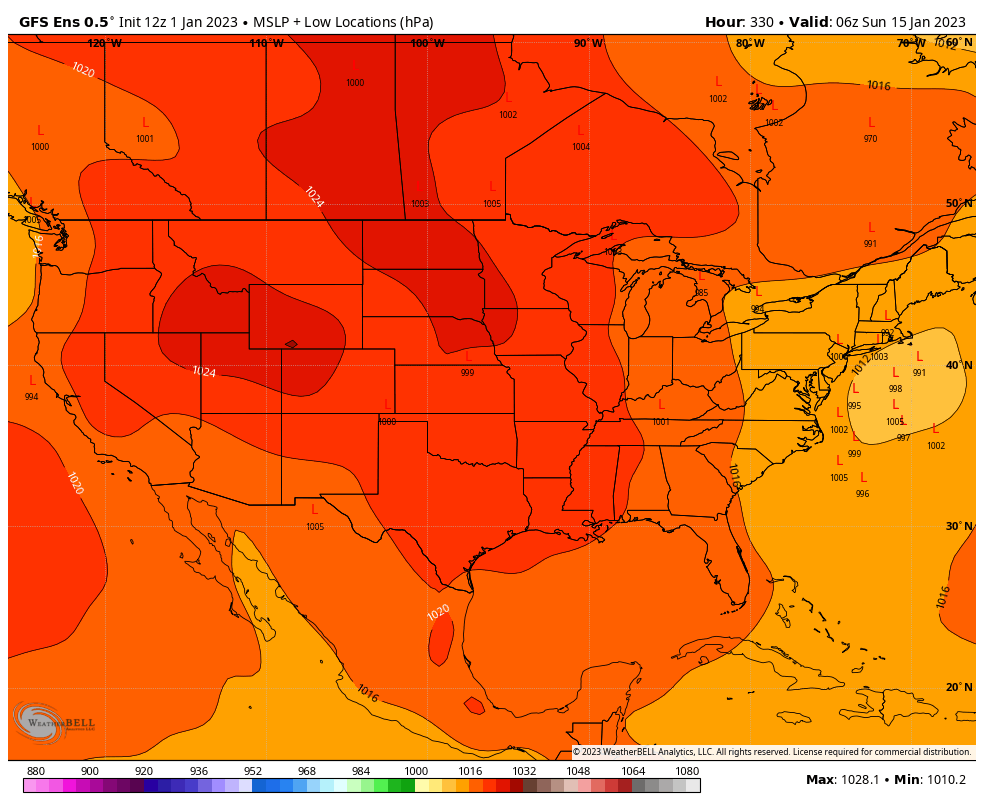
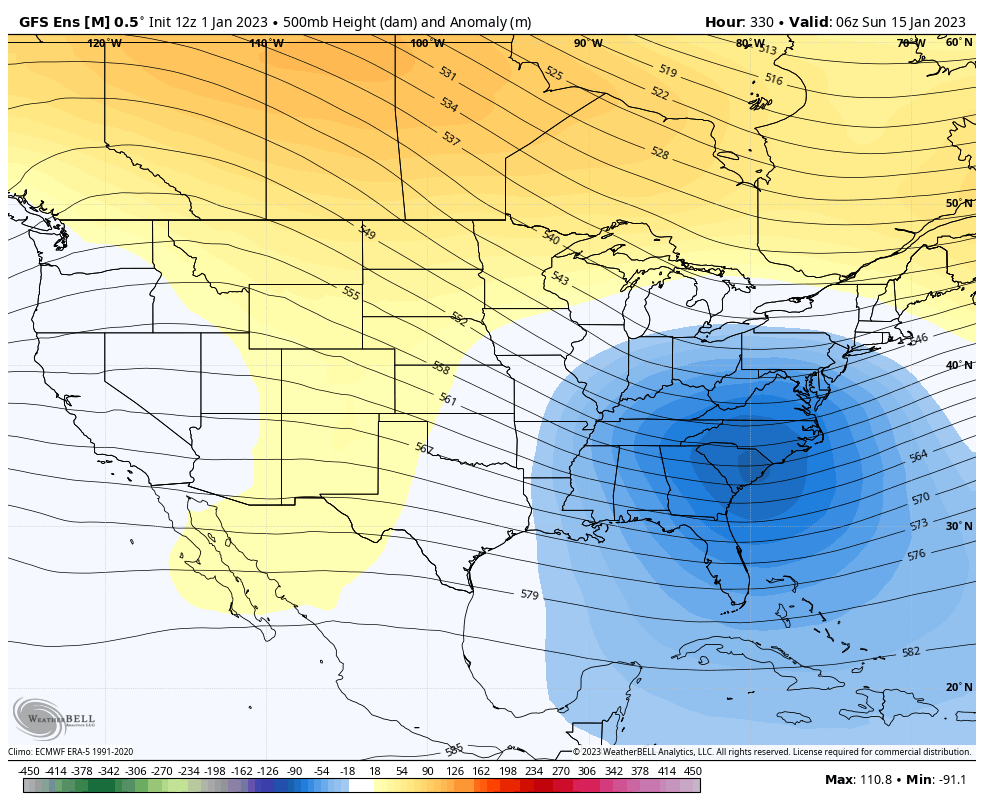
500mb look is not bad at all, just the airmass thats the main worry atp, some members have a 50/50 low(on MSLP) but it doesnt show here
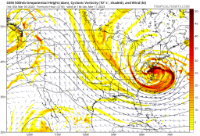
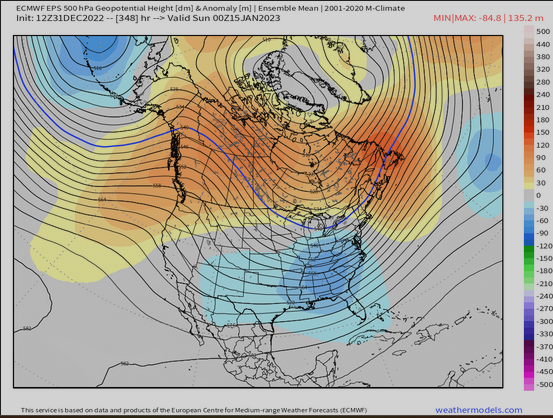
also see some similarities with the Jan 2019(EPS attached below) with the energy sliding under the Canadian block, aleutian low and trough over GOA(obv this system is different, not implying this system will be like that storm or anything of that sort)

-
 1
1
-
-
4 minutes ago, psuhoffman said:
Depends what the expectations are whether it’s worth it. The worst season I’ve had here in 18 years was 14”. Most seasons at least break 20. Median is about 35” and mean is 40. My snow climo is closer to coastal southern New England or NW NJ. That’s enough for some.
What year was your lowest?
-
16 minutes ago, Cobalt said:
Pretty surprising to have this substantial of a signal out at D14 for a coastal, as depicted by the GEFS. In the short term, I think our issue with the 6-10th threats simply hinges on how long it will take to flush out the PAC puke, and I can remember a similar thing happening 2 years ago (Jan 1-15th 2021), where it took weeks for things to become less marginal in the East after a longstanding Alaskan low. Hopefully the further we distance ourselves from the recent influx of Pacific air, the more favorable things will become (before the inevitable Feb -PNA fest)

Some signal for a 50/50 low as well
-
happy new year everyone! here's to another year of tracking
-
5
-
-
44 minutes ago, Maestrobjwa said:
Whoa holllllldup...I'm reading an article that said the first of the 2010 twin blizzards was a Miller B? Huh...
2 storm systems phased together and then a near-stationary UL ridge over maritime provinces of canada prevented it from going NE and instead it moved east. this also made the storm stall off the coast before eventually moving OTS
-
1
-
-
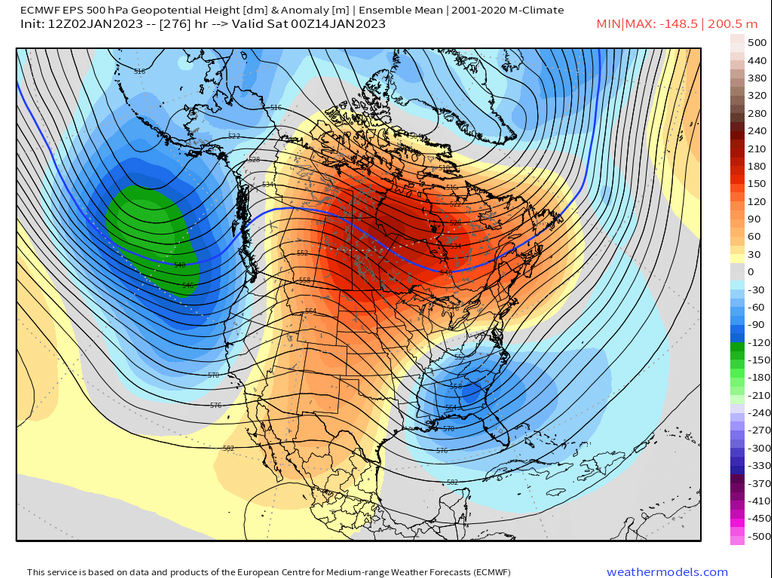
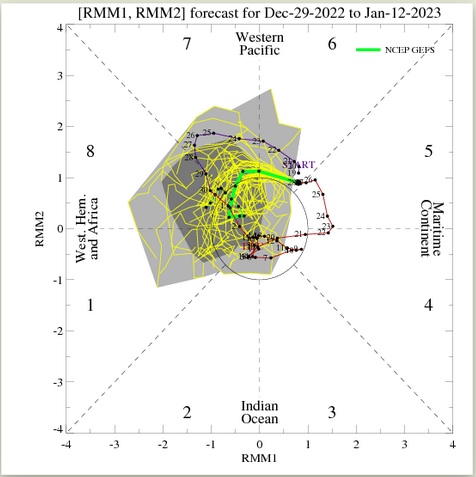
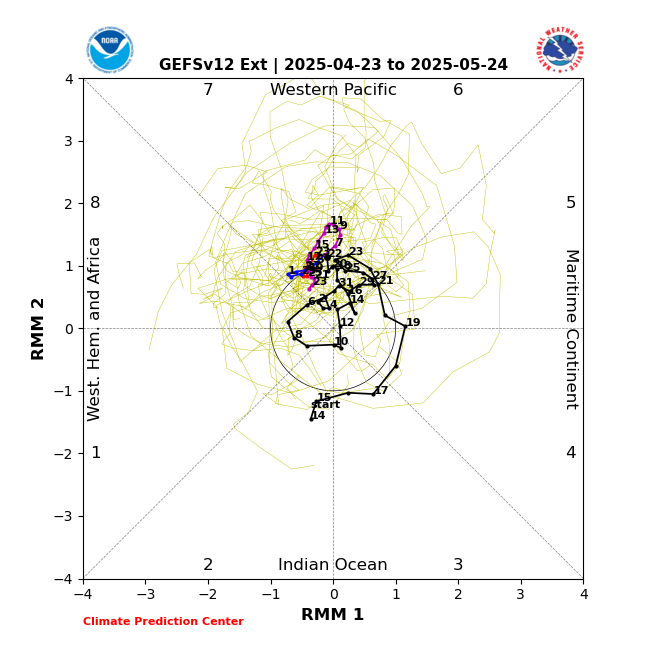
EPS looks good as well likely reacting to MJO going in favorable phases
-
4
-
 2
2
-
-
12 minutes ago, Ralph Wiggum said:
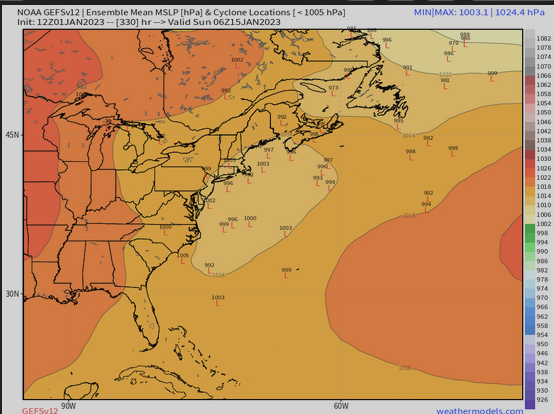
Been afk for a while. Just wanted to say, I endorse this look on the 12z GEFS

I assume more ensembles/models will start to adjust to this look more in the LR with the MJO going into phases 8/1
-
1
-
-
1 minute ago, Ralph Wiggum said:
Bro, 16 weenies?!?! That's gotta be close to a record

Pretty sure one of George001's post got like 40-50 lmao
-
1
-
 2
2
-
-
-
15 minutes ago, psuhoffman said:
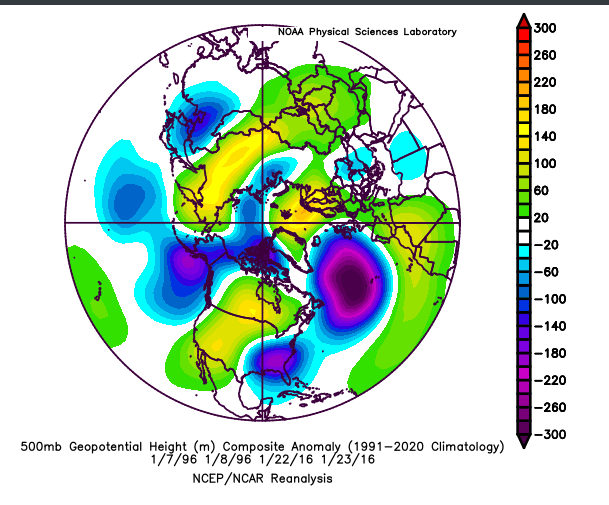
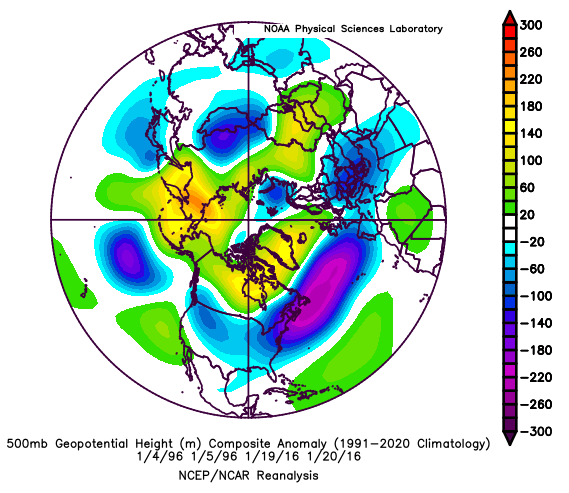
Adding to my last thought, I’d also like to see us snow from a domestic airmass with no epo help. Below is the composite of our 6 biggest snowstorms of the last 50 years.

One problem we’ve had repeatedly recently is we only get cold enough to sustain snow with epo help. Some have started to excuse our fails with “of course it failed look at the epo, or no cross polar flow” but that ignores the fact that historically 90% of our snow did not occur in an arctic airmass with cross polar flow.
That’s actually not a good longwave pattern to get storms to amplify into the box we want. Fact is a lot of our big snows happened in a look many would say is a “hostile” pacific (look above) because that’s actually the best longwave pattern to get a system to dig and amplify along the east coast. That’s why often a big snow was followed by a big warmup. Cold isn’t sustainable in that look. Conversely a lot of our really long truly cold periods didn’t include a big snowstorm or if they did it came at the end. A very negative epo has 2 problems. If it’s west based anything that amplified will cut. If it’s more east it can overwhelm the CONUS and just squash everything to the south.
The TLDR version: we’ve been too quick to just dismiss things with “pac puke” when a lot of our past snow came in a pac puke pattern. It’s just pac puke didn’t used to be sooooo warm that it was automatically a shut the blinds pattern.
Maybe there was an -EPO prior to the storm allowing cold air to seep in? But yeah, most of our KUs have happened w/o -EPO and it isn't necessary for us to get them. One thing that all of them clearly have is a Canadian high, 50/50 low, and a ridge over the Rockies. HL blocking/-EPO isn't fully necessary to get a good storm(as proven by 1996 and 2016).
-
3
-
-
40 minutes ago, jayyy said:
Most of the events we see come from workable looks and not epic looks, tbh. Epic setups at 500 (PNA NAO AO EPO, etc) leaves NYC buried more often than us. Our area seems to like setups that produce sneaky events - overperforming on WAA, clippers that slow down and bomb out, etc. Give me a sneaky low riding along a cold front that just passed south of us a day or two earlier over trying to thread the needle on a Miller B or having to bank on enough ridging out west to allow a storm to bomb out in the right spot. Idk why, but we seem to do best when we least expect it. Our latitude likes simple.
Give me some help in the pacific and a high up north and I’ll gladly roll the dice.Here is all of the 500h pattern for the major snowfalls our area has had since 2009-10 winter(excluding the major KU storms, and storms that only gave major snowfall to far far northern areas and/or high elevations). Just goes to show that we dont need a perfect pattern to score good snowfall in our area, some help from atlantic/pacific can be used well(as you said)
edit: oops accidently added december 13th instead of jan 13th
-
1
-
1
-
-
Euro extended/weeklies, GEFS, and GEFSX has MJO going through Phase 8. An -EAMT event would retract the jet back and since its overextended rn, form a +PNA. Along with the NPJR, MJO p8 would further enforce +PNA and blocking(along with +SCAND). While I'm still skeptical about it, this is an encouraging signal to see, and changes in the modeling will probably occur sooner or later if this signal continues to stay
-
6
-
-
19 minutes ago, Eskimo Joe said:
Is that for all three terminals, or just DCA?
For IAD, ~85% of all snow falls past Jan 1st(3.1" falls in November and December, 17.9" falls in January, February, March, April)
For BWI, ~87% of all snow falls past Jan 1st(2.6" falls in November and December, 16.7 falls in January, February, March)edit: oh mb you meant after Jan 15; ~72% for IAD and ~74% for BWI
-
3
-
-
5 minutes ago, AtlanticWx said:
Using snowfall for analogs doesn't really have weight imo, previous snowfall doesn't change the current pattern so even if you had 10" of snow in December, I don't see the weight it would have on the future patterns. Using teleconnections for analogs makes sense though
Yeah, pretty sure DCA had no measurable snow before Jan in 2014-15, 2015-16, and 2021-22, and then things started to ramp up after the start of the New Year
-
id be interested to see this for IAD or Damascus(even though there isn't much data for Damascus). i'd expect the same downward trend, but maybe its decreasing less/more, etc.
-
1
-
-
18 minutes ago, CAPE said:
Basically a jet extension (a) favors a ridge in the W US, a +PNA. A combo of extended and poleward shift (e) also favors a +PNA. A -PNA is mostly associated with jet retractions/equatorward shifts.

Fig. 5.
Composite mean 250-hPa wind speed (m s−1) is shaded in the fill pattern, 250-hPa geopotential height is contoured in black every 120 m, and 250-hPa geopotential height anomalies are contoured in solid red and dashed blue every 30 m for positive and negative values, respectively, 4 days following the initiation of (a) a jet extension, (c) a jet retraction, (e) a poleward shift, and (g) an equatorward shift regime. Composite anomalies of mean sea level pressure are contoured in solid and dashed black every 2 hPa for positive and negative values, respectively, and 850-hPa temperature anomalies are shaded in the fill pattern every 1 K, 4 days following the initiation of (b) a jet extension, (d) a jet retraction, (f) a poleward shift, and (h) an equatorward shift regime. The numbers in the bottom right of each panel indicate the number of cases included in each composite. Stippled areas represent locations where the 250-hPa geopotential height anomalies or 850-hPa temperature anomalies are statistically distinct from climatology at the 99% confidence level.
Full paper-
https://journals.ametsoc.org/view/journals/wefo/34/1/waf-d-18-0106_1.xml#fig5
Another presentation about the NPJ if anyone is interested in it:
https://www.weather.gov/media/sti/nggps/Presentations 2017/08 NGGPS17_PImeeting_Bosart.pdf -
when the jet retracts we should at least get a transient +PNA, +SCAND showing up as well which indicates that Atlantic should get fixed soon, how long this favorable pattern lasts depends on how long jet stays in favorable place. def not a bad look below with +PNA over Rockies, ridging over Canada and Arctic w/ Aleutian low and +SCAND which puts pressure on PV

-
1
-
-
-
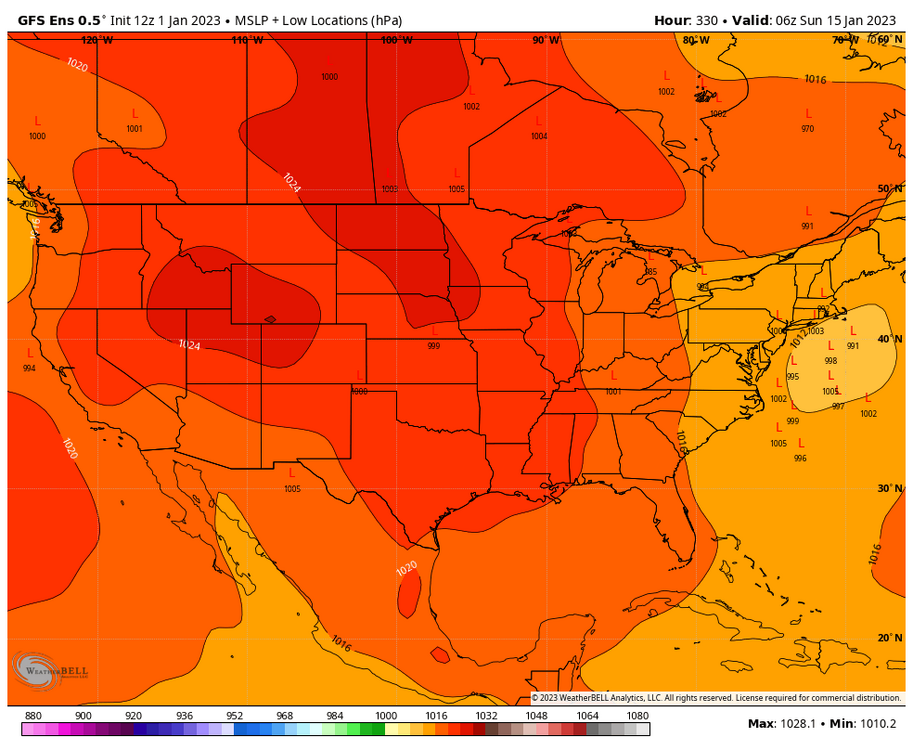
GFS fantasy run
-
 2
2
-
-
7 minutes ago, Terpeast said:
Thank you.
And did you use ChatGPT by any chance?
yeah lmao, chat gpt is pretty good with stuff like this(as long as it is given proper set of directions/data), i just changed a few parts
-
1
-
-
20 minutes ago, Terpeast said:
Couple of things.
First, for the models to work well, they use pressure as a vertical coordinate system instead of height. Instead of 2,000 feet 4,000 ft 10,000 ft and so on, you have 900mb 800mb 700mb all the way up to 10 mb. It’ll be too complicated for the models/equations otherwise.
Second, geopotential height patterns tells you where the warm air masses and cold air masses are. The higher the geopotential height at the 500mb pressure surface (think coordinate system), the warmer the airmass. The lower the geopotential height is, the colder the air mass.Now, when you have a cold and warm airmass butting up against each other, there is wind… and the stronger the temperature gradient between the air masses, the stronger the wind is. And it is that wind that controls the flow and track of storm systems.
Took me three paragraphs to explain it. Maybe someone else can do it in one.
Paraphrased:
Models use pressure as a vertical coordinate system(500mb, 750mb, etc.) rather than height(10000 ft, 20000 ft, etc.) to work well. Geopotential height patterns at the 500mb pressure surface show where warm and cold air masses are located, with higher geopotential heights indicating warmer air masses and lower geopotential heights indicating colder air masses. When cold and warm air masses meet, wind is produced, with the strength of the wind being determined by the strength of the temperature gradient between the air masses. This wind controls the flow and track of storm systems.-
1
-
-
5 minutes ago, cbmclean said:
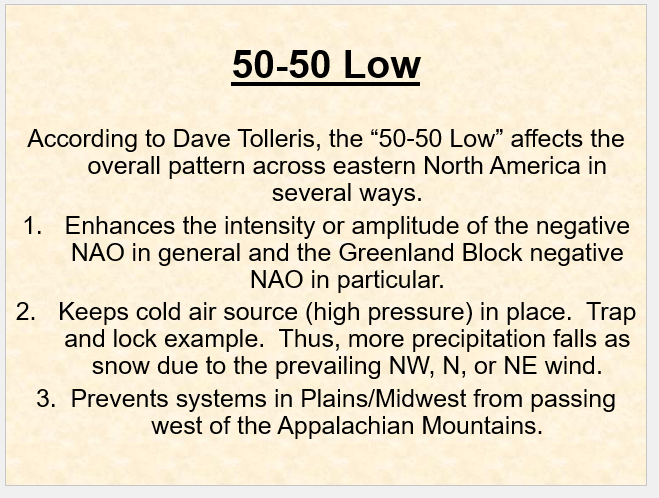
Thank you for taking the time to explain this. Can you help me understand how blocking works? I am particularly trying to understand why a 50/50 low makes a -NAO more effective as a blocking agent.
Here is a PPT that explains the significance of a 50/50 low(shows examples and explains more in detail), it prevents storms from cutting inland, strengthens the block, and locks high pressure in place
-
1
-


January Mid/Long Range Disco 2
in Mid Atlantic
Posted
I'd much rather be tracking storms than long range patterns, finally something to track/look at lmao