

CentralNJSnowman
-
Posts
103 -
Joined
-
Last visited
Content Type
Profiles
Blogs
Forums
American Weather
Media Demo
Store
Gallery
Everything posted by CentralNJSnowman
-
February 2026 OBS & Discussion
CentralNJSnowman replied to Stormlover74's topic in New York City Metro
That’s pretty interesting. There may be some seasonality or other cyclical factors so you may only get a clear picture of the ongoing rate of erosion over a period of multiple years -
February 2026 OBS & Discussion
CentralNJSnowman replied to Stormlover74's topic in New York City Metro
Heavy here (monroe township) too. Looks like 1/2” down already. Was not really expecting this. -
February 2026 OBS & Discussion
CentralNJSnowman replied to Stormlover74's topic in New York City Metro
12z GFS says we do it again next Monday -
Yeah - I just got in from two hours of shoveling and snowblowing...and probably have another two hours to do later in the day. How much snow do you think we have so far?
-
No real idea how much we have here but I saw a report of 22” in freehold, which is pretty nearby and I would definitely believe that. My neighbor has been shoveling his driveway for an hour and has really made significant progress.
-
Looks like still to come from 6am
-
The guy who posted the ‘yikes’ lives pretty far west in NJ. That run was bad for his area.
-
I’m near you (Monroe) and it started sticking to my street about 10-15 minutes. Things just feel the start of a blizzard. I have a good feeling about this.
-
Kind of surprised at the quantity of rain here in central nj. Seems like we’ve had about 1/4” already and probably hours more till the temp drops and the white rain begins. not sure if that’s good (more moisture than expected) or bad (more of the moisture is being wasted)
-
It really shouldn’t. No accumulations forecasted till afternoon and not much till very late afternoon
-
Mount holly upped my area to 18-25”
-
And then she added "And by the way...I doubt the snowstorm will be that big either"
-
That's beginning to feel like it might be the most likely mode of 'failure' at this point. Canadian showed a pretty sharp East/West cutoff in NJ. Fingers crossed that it doesn't play out that way.
-
Not 1996. Might have been 2006.
-
Feels like with most storms after the fact, there tends to be a lot of confusion (and maybe a bit of revisionist history) about which model 'got things right'. That's probably due in part to all the models waffling back and forth at different time ranges. With this storm, there should be absolutely no question...if ends up being a non-event, the Euro nailed it. If it ends up being a major snowstorm for our area, the GFS nailed it. Neither of them have really varied much at all (while the others have all moved somewhat from run to run).
-
Not sure that it being late February is the main impediment to getting a 35” storm on the Delmarva.
-
Presidents' day Snow potential
CentralNJSnowman replied to WeatherGeek2025's topic in New York City Metro
I fully acknowledged that his measurements are more accurate than my estimates. I'm just curious where my estimates were way off, because I'm surprised how low the totals were. We're in the same town and trust Sacrus to be pretty accurate. I suspect it's mostly from the December 14 storm, where there was 8" on my car but appeared to be WAY less than that anywhere on the ground. -
Presidents' day Snow potential
CentralNJSnowman replied to WeatherGeek2025's topic in New York City Metro
I've got us with about 5 inches more than that for the season, but that's purely from eyeballing after each storm, so your number is probably more accurate. Curious where the discrepancy is coming from though. How much did you measure for December 14 and January 25? -
February 2026 OBS & Discussion
CentralNJSnowman replied to Stormlover74's topic in New York City Metro
I'll take the under -
Agreed that it's probably over as a threat for anything but minor amounts in a small portion of the sub-forum Disagree that the thread should be closed. Part of the point of doing this is to learn from it, so there's some value in posting the remaining model suites and especially posting what actually happens
-
Use of the NBM seems really problematic. Everyone has been looking at the weirdly high outputs and twisting themselves into pretzels coming up with logic about how there must be a few ensemble members throwing off the entire weighted average, when the NBM seems higher than any of the components that it "blends". I'm pretty sure that some of the totals the NBM has split out the past couple of weeks would have required outliers of 200+ inches. There was some discussion in the Mid-Atlantic subforum a few days ago about how there's an adjustment being made to account for recent under forecasting of the models. It's pretty clear that there's something wrong with how those adjustments are being calculated and applied.
-
You just reminded me of one of my favorite websites: "Spurious Correlations". This was the most relevant thing on there that I could find with a quick search...
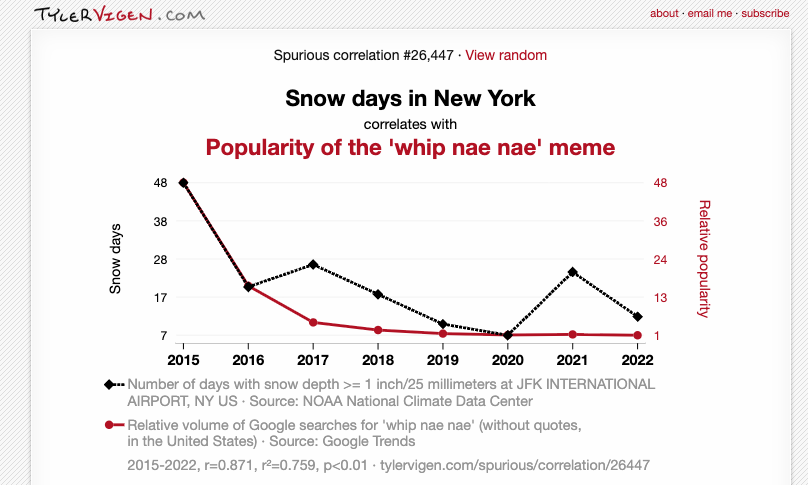
-
NIcely illustrated and this is the main thing that's giving me some hope
-
I suspect that the way we're using the analogs isn't really well suited to what they're showing My impression is that the only dates "eligible" to come up as analogs are when there's a strorm. So what the analogs are showing is not "What are the chances of a big storm?" but rather "Of the past big storms, which ones most resembled the current situation?". That means that it's ALWAYS going to come up with a pretty juicy set of analogs, even in situations where we're unlikely to get much of anything. If we want to use the analogs to forecast likelihood of a big storm, we need a universe of potential analog dates that includes everything, including all the days that ended up "blue skies and sunny everywhere". Then if we had a number of big storms showing up in the top ten analog dates, we'd know there's a good chance of something substantial.
-
That's what she...


