csnavywx
-
Posts
5,722 -
Joined
-
Last visited
Content Type
Profiles
Blogs
Forums
American Weather
Media Demo
Store
Gallery
Everything posted by csnavywx
-
Hah, I wondered where you were at. Yeah, it's been slowly symmetrizing all day after being a bit tilted and asymmetric this morning. Should be able to take advantage of its improved structure tonight.
-
It's more than just political ideation. If somebody wants to be taken seriously scientifically, as he does, they have a duty to support their claims honestly and update their priors when they're wrong. He almost never does, especially when it comes to CC. It invariably turns into waving around conspiracies as explanations -- which doesn't actually explain jack squat, it's a punt and turns into eternally engulfing or circular reasoning. Every piece of evidence against it becomes evidence *for* it. I've lain down the gauntlet on this stuff several times on this forum (nobody on the other side of the argument has picked it up) -- and at this point we've cleaved off CC discussion to its own forum essentially because we're expected to carry emotional baggage for intellectually immature or dishonest people. Sorry for the mini-rant. His actual seeding subject is an interesting question, but it's a thorny one. You'd have to try it on fish storms first and it would be very hard to control for. We've actually already tried, but with inconclusive results. Not to mention all of the HAARP-type folks that would come out of the woodwork and basically get it shut down before we're able to get anything useful out of it.
-
That would explain the series of opposing cycling hot towers a little while ago -- probably fired along the major axis.
-
Core is now emerged over the Gulf of Batabano -- should make second landfall in an hour or two. Notable that towers immediately began to re-fire the second it came back over water.
-
Given the way it behaved today with less than ideal conditions -- I can't blame them. Max shear drops off to ~5kt tomorrow with the vector aligned with the track and plenty of OHC. Only remaining fly is how badly the formative inner core is damaged. This little double speedbump interrupted what was probably a hellacious RI episode.
-
The diabatic pump is real, however I think *at the moment* it's more about the differential steering flow (versus a weaker/shallower and more tilted Ida that some ensembles and deterministic runs had forecast). This constant slight deviation to the right of track adds up over time -- at least until the shear vector weakens and shifts direction late tonight and tomorrow morning. The effect might cancel out -- but we could really do with fewer corrections to the east.
-
Short-term land disruption is generally more effective in limiting downstream intensification once an inner core has become established. This is due to wind curve flattening or spreading. This larger windfield becomes less concentrated near the core (because of frictional spin-down and interruption of latent heat flux) and also generally becomes pretty inertially stable -- making it more difficult for wind maxima to contract and spin back up. Irma and Isidore are good examples of this. It may not work very well in this case due to the fact that the inner core is still in a formative stage and the TS-force wind field is still pretty small.
-
FL winds are up about 10 knots from the previous SE-NW pass by recon. Already strengthening pretty rapidly.
-
It would be, but Katrina was not a worst-case scenario for NOLA, believe it or not. It escaped the worst of the wind damage and a further west track would have funneled surge up the mouth of the Mississippi for a longer duration.
-
Stronger earlier plus right of center adjustments are not great. Still have some hope it stays far enough west to spare NOLA. At least in this case there's no trough trying to dig the 'cane out and eroding the ridge as it does so.
-
-
5 am advisory now forecasting borderline cat 3 on landfall but notes the following wrt intensity: It should be noted that this intensity is lower than that forecast by the HMON model, the HCCA corrected consensus model, and the Florida State Superensemble.
-
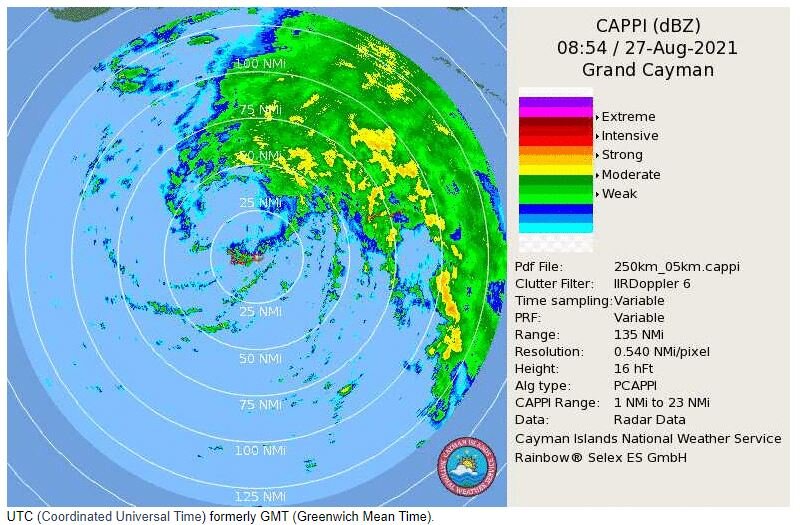
MWCR 270900Z 28008KT 250V130 9000 -SHRA BKN014 SCT028 26/25 Q1003MWCR 270800Z 32008KT 290V350 9999 -SHRA BKN010 26/25 Q1003MWCR 270700Z 35010KT 330V040 9999 BKN018 26/25 Q1004MWCR 270600Z 06010KT 9999 FEW016 BKN030 27/24 Q1005MWCR 270500Z 09017KT 9999 FEW016 BKN030 27/24 Q1007 Looks like the center is passing north of Grand Cayman. Radar confirms this.
-
Pretty much this. It's already an aggressive forecast. Warranted, mind you, but already explicitly forecasting RI. Having said that, the LLC got going in a hurry this morning and we're already on the northern side of the guidance envelope (from yesterday's runs), so -- not great news. We'll get Cuba as a speed bump at least, but I'm not sure how much that's really going to help. The "good solution" space is even narrower than yesterday.
-
Convection now coalescing on the northern end of the wave. Should get a nice convective burst out of that tonight.
-
TC formation generally favors the north end of the wave circulation envelope, where the curvature vorticity is naturally maximized. So, the modeling developing there isn't particularly surprising. Also, the synoptic steering features for Grace were more uncertain. Steering here is driven by a very large and displaced subtropical ridge, so there's less uncertainty on that component. There's just not much "good" solution space. The best case seems to be on the lower-prob south end or a messy/slow initial vortex formation. And as mentioned before, that's not a very long list.
-
We don't need a 'cane into NO in this kind of setup and steering flow. Luckily, still a 1-2 days of run-to-run variability left (until it forms), so it likely won't stay there.
-
Hard pass on that run. Luckily, still 5 days out on an unformed invest.
-
Lots of spread still -- plenty of time for it to change. Crossing my fingers for ya.
-
The list of potential negatives for this thing is pretty short. With virtually all lower-res global guidance and ensembles calling this, it's starting to look like one of those events I like to call "synoptically evident". Gotta hope for some sloppy early-stage development or (destructive) land interaction. I don't think outflow shear in the gulf from an Epac storm alone is going to cut it in this case.
-
That very well may just be convection wrapping upshear as the shear magnitude lessens (down to ~13 kt on CIMSS, probably sinking <20 in the mid-upper levels).
-
We're at/near peak shear and Henri seems to be holding up. 27kt analyzed on the 06z GFS and 31kt on CIMSS. It decreases through today and into tomorrow, dropping to or below 20kt by 06z tonight and down to 10-15 by tomorrow evening.
-
Regardless of track, if this thing does hit NE, it won't be trucking along. The trough is weak and trapped underneath a ridge. It'll be over cold water for a while, which caps LF strength.
-
As OSU pointed out, this thing is already pretty far east. Much will depend on how Henri gets through the next 24-48hr. Shear peaks in the ~36hr timeframe at around 25kt (from 16 now). That's probably not enough to decouple it completely, but depending on how convective trends end up, we could see some further southwesterly adjustments -- albeit the ensemble spread suggests not as much as we've had over the past day or two. The airmass getting entrained via shear isn't particularly dry during max shear either, so I'm leaning stronger than I would normally.
-
They're late to the punch. It's already happened twice in the last couple of weeks. EOSDIS shows that pretty well. And I don't know about the "first time" part. Been some pretty big fire seasons up there the past few years.