csnavywx
-
Posts
5,722 -
Joined
-
Last visited
Content Type
Profiles
Blogs
Forums
American Weather
Media Demo
Store
Gallery
Everything posted by csnavywx
-

Southern MD / Lower Eastern Shore weather discussion
csnavywx replied to AnEndlessMaze's topic in Mid Atlantic
That warm nose around 800-700mb showing up on the NAM is worrying me a bit about a sloppy p-type. Rain to wet concrete and a band of sleet mix in there somewhere. Will have to dig in on BUFKIT tomorrow and check it out. The Euro is a significantly better scenario for snow, where it starts in the wee hours and diabatic cooling keeps the column from warming up too much. Edit: The 06z NAM is a total weenie run for Lowershore. Plasters him with probably 10-12" of wet concrete. On a more serious note, that's a perfect slider track for SoMo and the lower shore. Last couple of runs were a hair north. Still ~48 hours to go, so no guarantees of course, but having the Euro and NAM sniffing out the exact same scenario is great stuff at this range. -
Careful using straight 10:1 here. It's more likely to be 6-8:1 or more like the consistency of paste or wet concrete.
-
Feb Long Range Discussion (Day 3 and beyond) - MERGED
csnavywx replied to WinterWxLuvr's topic in Mid Atlantic
While it would be fun to see the deep cold at the end of the run, I think I'd rather see a Para-type scenario where the PV doesn't shear out into a huge positively tilted mess and instead rolls up into a nice storm on the way out -- as the pattern concludes. The deep scouring into the Gulf on the Euro kinda puts the damper on moisture return for a while after that scenario. -
Southern MD / Lower Eastern Shore weather discussion
csnavywx replied to AnEndlessMaze's topic in Mid Atlantic
That slider is still on the table. And the TPV can stay right there just north of the border as long as it wants. Sets us up nicely to catch any southern sliders. -
Feb Long Range Discussion (Day 3 and beyond) - MERGED
csnavywx replied to WinterWxLuvr's topic in Mid Atlantic
Notable shift in the GEFS mean and members towards the Euro on the 18Z run. -
Feb Long Range Discussion (Day 3 and beyond) - MERGED
csnavywx replied to WinterWxLuvr's topic in Mid Atlantic
I mean... if you're not honking with these LR maps, you're in the wrong business: -
Southern MD / Lower Eastern Shore weather discussion
csnavywx replied to AnEndlessMaze's topic in Mid Atlantic
Some actual accumulations with snow tv in between a few bands. Nothing heavy or earth-shattering. That's more likely next weekend or as the big vortex starts to move out in 10d or so. -
Feb Long Range Discussion (Day 3 and beyond) - MERGED
csnavywx replied to WinterWxLuvr's topic in Mid Atlantic
This pattern has the potential to produce multiple times. The end-week wave has some explosive potential (pending timing and phasing ofc), but there's plenty of room for a follow up as the big honking vortex starts to pull away too. That's some export-quality Arctic air to work with and generate WAA/upglide on with the Gulf still open. -
Southern MD / Lower Eastern Shore weather discussion
csnavywx replied to AnEndlessMaze's topic in Mid Atlantic
Starting to look like some light snow late tonight/early tomorrow morning and into late tomorrow afternoon is a decent bet. H5 low and H7 trough pull a decent loop-de-loop on the Nest and NMM (and the latest GFS), which will allow for some gentle lift in/near the DGZ. Throw in some leftover moisture and we could see some fluff. -
Southern MD / Lower Eastern Shore weather discussion
csnavywx replied to AnEndlessMaze's topic in Mid Atlantic
Gonna laugh if we all end up getting more than DCA, especially you. -
Southern MD / Lower Eastern Shore weather discussion
csnavywx replied to AnEndlessMaze's topic in Mid Atlantic
Looks like you've got about 1-2 hours left before mixing. -
Southern MD / Lower Eastern Shore weather discussion
csnavywx replied to AnEndlessMaze's topic in Mid Atlantic
All sleet now. Looks like I'll end up right around 3" of snow+sleet by the time this is over. -
Southern MD / Lower Eastern Shore weather discussion
csnavywx replied to AnEndlessMaze's topic in Mid Atlantic
Don't look now, but there's a fat slider starting to show up ahead of a true arctic airmass next weekend. -
Southern MD / Lower Eastern Shore weather discussion
csnavywx replied to AnEndlessMaze's topic in Mid Atlantic
Well now, you're making out pretty damn well today, aren't ya? WAA stuff always seems to deliver the goods. Just have to be willing to hump the mixing line to get the good stuff. -
Southern MD / Lower Eastern Shore weather discussion
csnavywx replied to AnEndlessMaze's topic in Mid Atlantic
Can confirm here at Pax. Just started getting some sleet mixed in. Smaller stuff melts, bigger aggregates making it through fine. Kind of a mix of fatties, singed flakes and small ice pellets. -
Jan 31st - 33rd Storm Obs and Disco like it's 1979
csnavywx replied to Bob Chill's topic in Mid Atlantic
Ripping now. Been sitting between 1/4 and 1/2 mile for a bit. 1.5" otg. -
Southern MD / Lower Eastern Shore weather discussion
csnavywx replied to AnEndlessMaze's topic in Mid Atlantic
Not really seeing that. Better chance of something after it cools down Mon night -- but even that would be freezing drizzle. -
Southern MD / Lower Eastern Shore weather discussion
csnavywx replied to AnEndlessMaze's topic in Mid Atlantic
Euro throwing us a bit of a bone with the coastal and gets some wraparound in here late Monday into Tues. Not a ton, but seeing it cave towards the GEM isn't something I really expected. Might be able to eek out the butt end of a ccb band after all. -
Southern MD / Lower Eastern Shore weather discussion
csnavywx replied to AnEndlessMaze's topic in Mid Atlantic
Yeah, primetime between 14 and 21z, shift that up an hour or two for places further east/north. Thermals get shaky from south to north after that, though it might rip right up through changeover. I'm thinking diabatic cooling keeps the warm wedge at bay until the rates relax and the dry slot starts to nose in and then the changeover will be really fast. Key question will be how quick the morning stuff gets going. Earlier the better, as that sets us up nicely for column saturation and gives a decent powdery base to accumulate on. -
Southern MD / Lower Eastern Shore weather discussion
csnavywx replied to AnEndlessMaze's topic in Mid Atlantic
Still can't count on the coastal actually doing anything for us. It's a very chaotic/sensitive setup where popping the low and closed H5 circulation a bit earlier and further south like the Euro and RGEM allows us to cash in on some of it -- or a little later and further north where it can't help us (like the NAM). -
There will probably be some drizzle and freezing drizzle once the dry slot rolls in. Could be an extended period of it too. The reason is that cloud top temps warm above -10C as the dry slot erodes it away, leaving no very few ice crystals available for snow formation. Still plenty of moisture underneath that and some background lift though, so there will be drizzle. That's going to be an issue until/unless the coastal low can set up a reasonable def. zone and ccb to remoisten the column.
-
Southern MD / Lower Eastern Shore weather discussion
csnavywx replied to AnEndlessMaze's topic in Mid Atlantic
That early morning stuff should be higher-ratio powder and lay down a decent coating (as well as saturate the column) before the main WAA shield arrives later in the morning. -
Southern MD / Lower Eastern Shore weather discussion
csnavywx replied to AnEndlessMaze's topic in Mid Atlantic
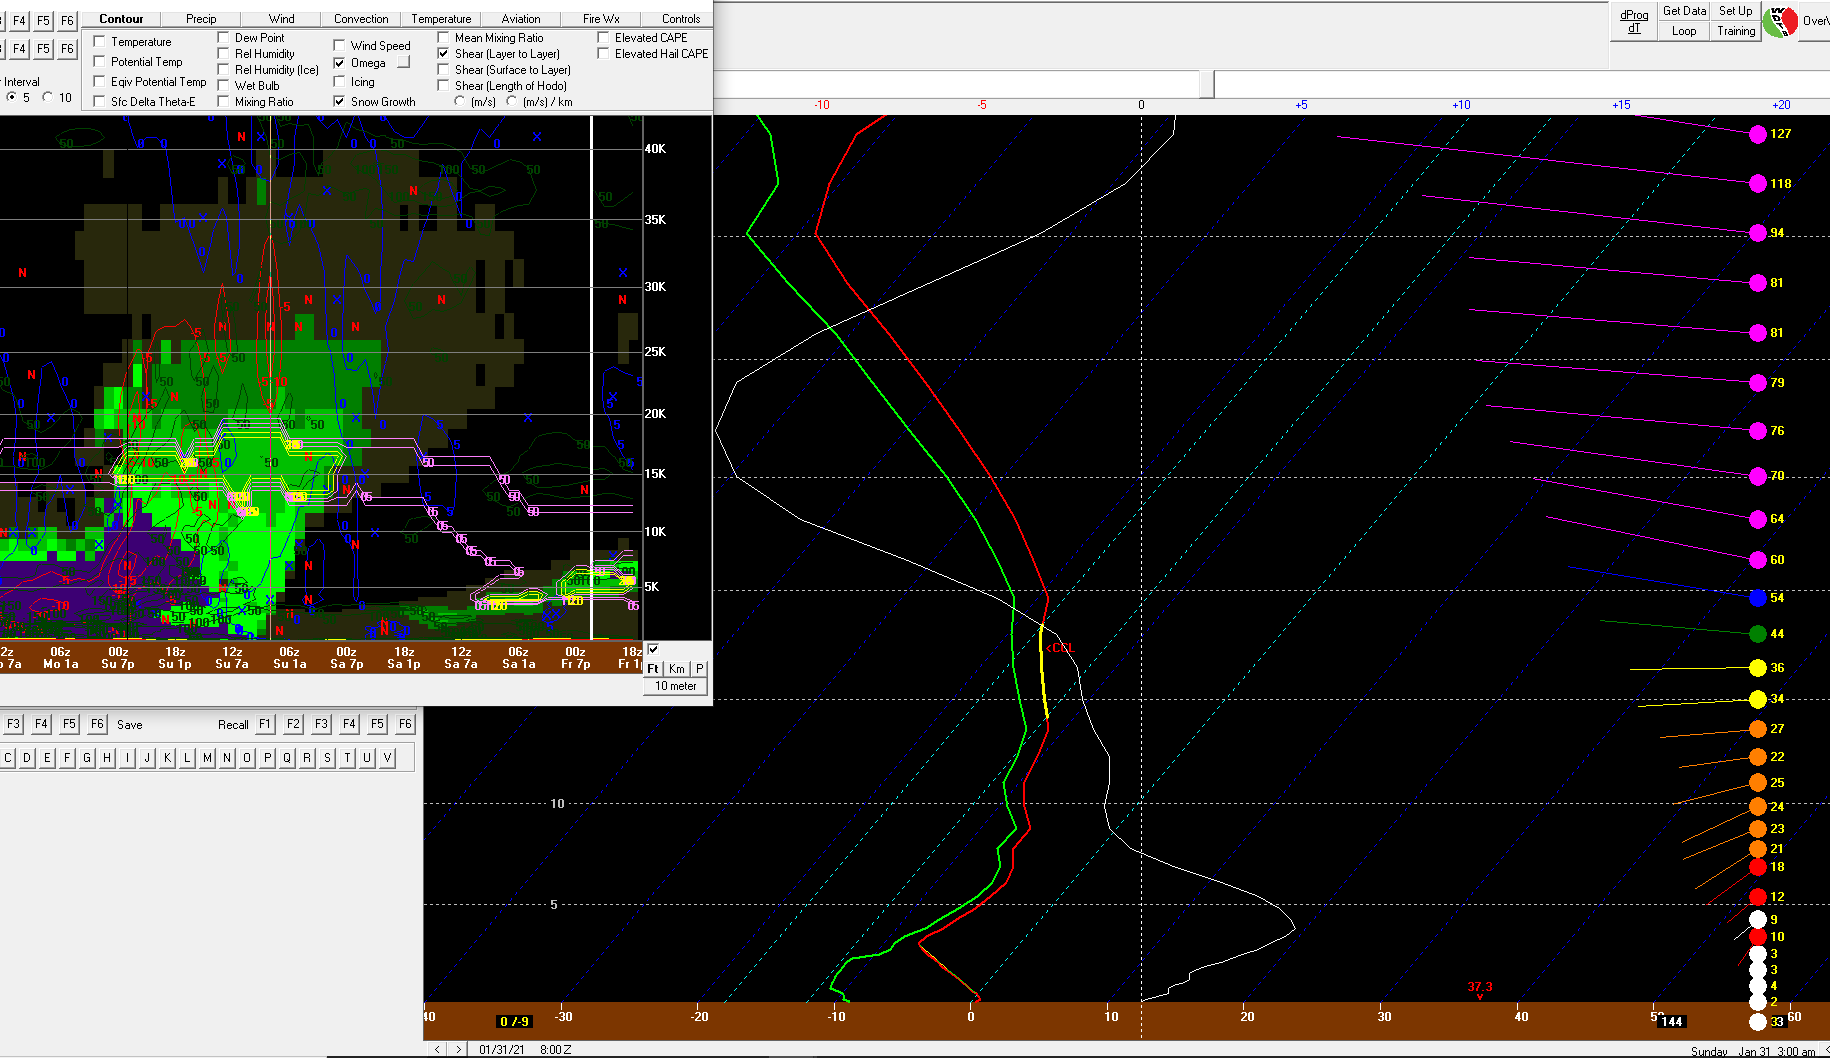
Front end might get started earlier than expected. Quite a bit of lift progged with some f-gen and upglide pretty high in the column as early as midnight to 3am Sunday.
-
Just an artifact of how the model stamps out the lowest pressure even though that's not where the CoC is. That "low" is being printed there likely because of terrain effects and the fact that the primary over the OH/IN/KY border is filling pretty quickly at that point, causing the pressure at the old CoC to be higher.
-
Transfer is definitely a little faster on this run. Primary a touch weaker and further S to start with.