wxmvpete
-
Posts
76 -
Joined
-
Last visited
About wxmvpete

Recent Profile Visitors
2,010 profile views


-
Feb 22nd/23rd "There's no way..." Storm Thread
wxmvpete replied to Maestrobjwa's topic in Mid Atlantic
Makes you wonder how much more can change. A couple days ago, the recent winter storm that occurred in the Midwest was forecast to maybe produce 4-8" of snow from Omaha to southwest WI. This morning, some folks in Iowa woke up to over a foot of snow. Crazy things can happen under these highly anomalous upper lows and rapidly strengthening coastal lows. We all know that of course, but in terms of recency bias, ask the folks in North Carolina from several weeks back about that. -
Feb 22nd/23rd "There's no way..." Storm Thread
wxmvpete replied to Maestrobjwa's topic in Mid Atlantic
The EC-AIFS ensembles have been pretty darn good in the days 3-5 range. To see that much of an amplification change inside of 72 hours (model trend over the last 5 runs, starting with yesterday's 12Z run) from the onset of precipitation speaks to how intricate these 500mb disturbances working together can change so much. Any subtle amplification and change in axial tilt can make or break a forecast. Throw in marginal boundary layer temps and this is about as challenging a forecast for not just totals but potential impacts as it gets.
-
Feb 22nd/23rd "There's no way..." Storm Thread
wxmvpete replied to Maestrobjwa's topic in Mid Atlantic
Think the IVT here is "inverted trough". To be fair to you though, with all the EROs we write and referring to the IVT in that way so much, I totally get why you took it that way haha. I share similar thoughts. With the lack of a really cold air-mass, areas along I-95 will rely heavily on rates for anything during the day. Unless you have elevations from like the Catoctins, Bull Run Mountains, Parrs Ridge/far northeast MD, or you are directly beneath the CCB, this is going to be treated like a typical late season storm. 1.) how much snow is falling near/after sunset? 2.) Are you living at a higher elevation? 3.) Is guidance showing you beneath the CCB? If you answer all 3 as yes, you are in good shape at the moment. 2 of the 3 at least gives you decent odds of some accumulating snow. 1 of the 3, probably need some help somewhere along the way meteorologically via track or banding. 0 of the 3 speaks for itself. -
Feb 22nd/23rd "There's no way..." Storm Thread
wxmvpete replied to Maestrobjwa's topic in Mid Atlantic
The WSO is actively used to determine the need for watches across the CONUS. Obviously if the probabilities continue to go up, the more the WPC super ensembles would suggest the potential need for watches given the higher probabilistic odds for a warning-level event. But this is not the end-all-be-all for watch decision making. -
Feb 22nd/23rd "There's no way..." Storm Thread
wxmvpete replied to Maestrobjwa's topic in Mid Atlantic
Worth noting this is an experimental product that is based off the WPC's 61 member Super Ensemble. It is a tool to gauge the the potential for a warning level event. No one actively adjusts these up or down to create a forecast. It is a tool, just like so many others to use. It is also worth mentioning this product is not using new EPS data yet. The screen shot here was the most recent run after 21Z. The latest update should be posted within the next half hour or so. -
Glad to see Sterling and I are on the same wavelength: https://www.wpc.ncep.noaa.gov/discussions/hpcdiscussions.php?disc=qpfhsd
-
Right?! But seeing the evolution of some the members did give me flash backs to Boxing Day 2010 and late January 2015. Seeing a couple more southern VA and NC snow storms shows those southern tracks too. It shows the true top end of what could happen here as you eluded to. It also shows the misses, and at this range, they should be plausible scenarios. Unless we see those same norther S/W trends we saw last week for the recent weekend storm. Then perhaps we are talking something more impactful forum-wide.
-
I want to be clear I am also NOT calling for that, but out of curiosity, I looked at the CIPS analogs and felt it provided past winter storms that show the range of scenarios this setup has. https://www.eas.slu.edu/CIPS/ANALOG/DFHR.php?reg=EC&fhr=F156&rundt=2026012612&map=thbCOOP72
-
Jan 24-26 Weekend Snow and Sleetfest Model Thread Part Tres
wxmvpete replied to H2O's topic in Mid Atlantic
Read about it here for a national view: https://www.wpc.ncep.noaa.gov/discussions/hpcdiscussions.php?disc=qpfhsd -
I know the guy who wrote that
-
That is correct
-
I think it is just simply flying to its destination tonight. Maybe it will collect "some" data, but we requested recon into that feature (plus into the Gulf and Atlantic) for the next few days. We know the current plan is to do a sampling mission starting tomorrow at 00Z.
-
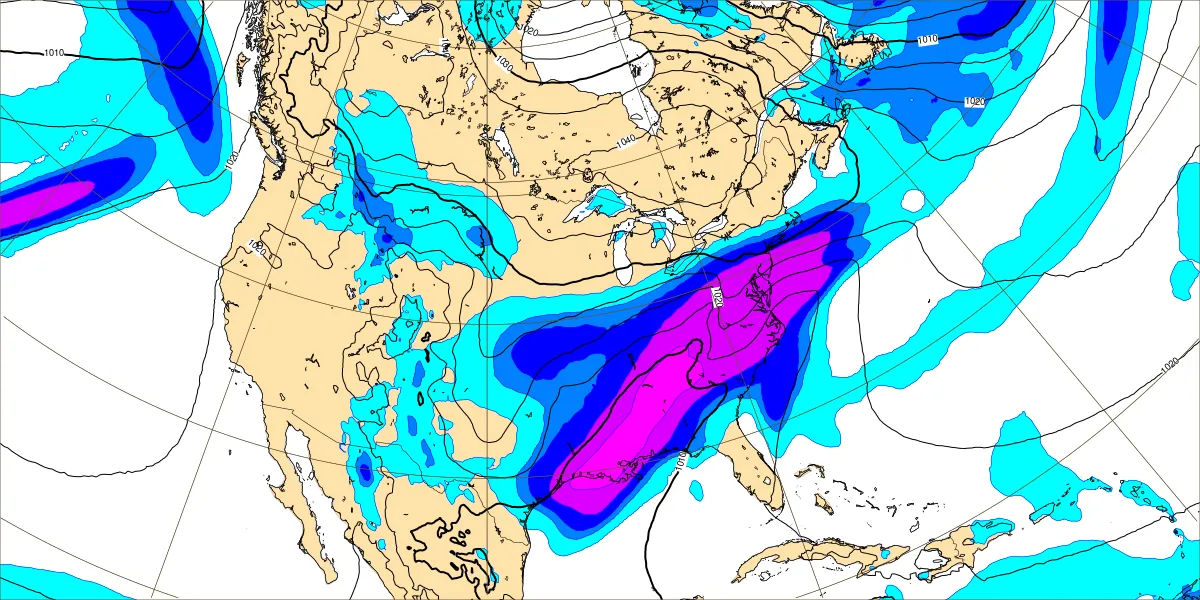
Heh sorry, thought the map legend went over. It shows MSLP and precipitation rate. In this case it shows 12-hr precip rate in mm. 1 mm is roughly 1 cm of snow (obviously ratios will be different, just a general rule of thumb per ECMWF)
-
He is referring to Google AI model that you can view on the ECMWF charts: https://charts.ecmwf.int/products/graphcast_medium-mslp-rain?base_time=202601181200&interval=12&projection=opencharts_north_america&valid_time=202601250000

-
I did find it interesting seeing the Day 8-14 CPC analogs and noting some of the Januarys/Februarys that would unfold as a result of this pattern. It is important to note that these seasons' ENSO states are different from year to year and what drove their corresponding storm tracks, moisture transports, and cold air available all differ to some degree. Also not every year listed caused a big storm. But just a 40,000ft look from above, seeing some of those events that unfold either during or say ~1-2 weeks following this analog pattern makes you go "huh...". Lastly, the correlation score isn't that high, so it is not a perfect match by any stretch.