ORH_wxman
-
Posts
93,092 -
Joined
-
Last visited
Content Type
Profiles
Blogs
Forums
American Weather
Media Demo
Store
Gallery
Everything posted by ORH_wxman
-
Yeah I thought that was funny. Whining nonstop about the ski trip and then a pattern coming up that looks quite good for ski country and he…..whines
-
Maybe but much better shot in that pattern than Taunton.
-
Prob nothing for you. Interior and NNE will have chances though in that pattern which they need to get back into the game for snowfall climo.
-
Regardless of the very end of the ensembles, people should not overlook the favorable look mid-month just before that.

-
Both of those patterns were pretty epic. That was part of the funny meltdowns….people were throwing tantrums left and right about not getting anything and then they both showed up inside of 6 days.
-
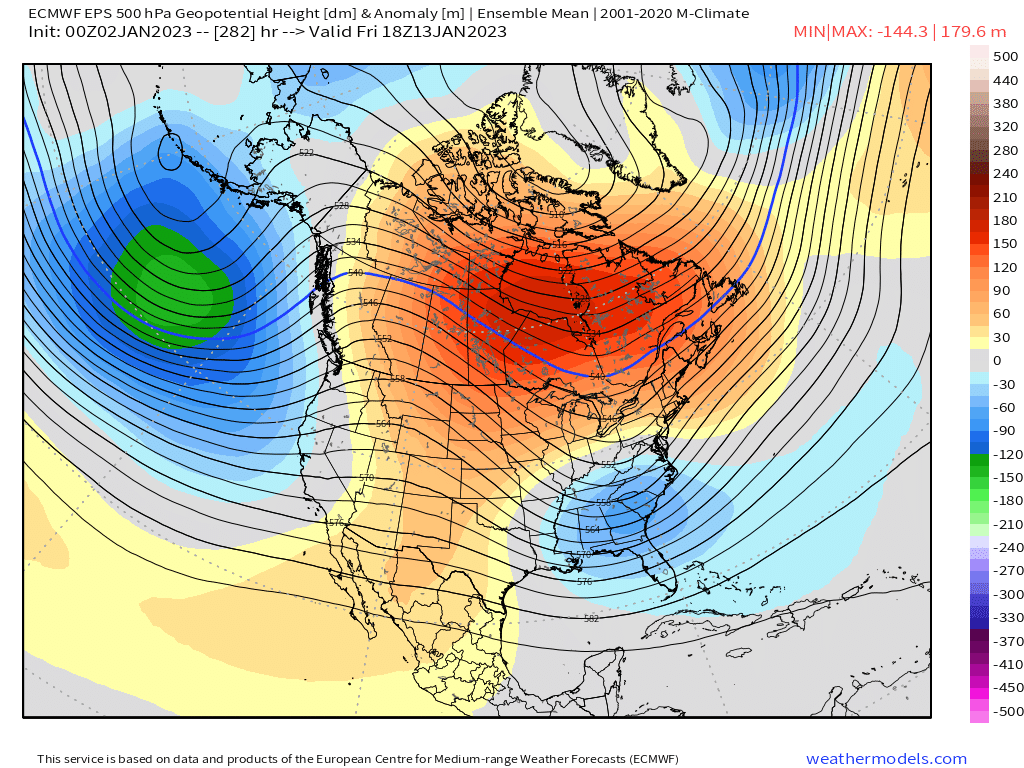
EPS was def better because it has the lower heights just offshore the west coast which often creates a bit of ridging in the Rockies.
-
If you didn’t wear a winter coat in Xmas Eve, you don’t need to own one at all. It was like 10F and windy. Lol.
-
That’s actually not a bad look overall. Esp for interior and NNE. It’s pretty active. I wouldn’t want to be on coast or further south though. Can’t sustain ridging up by Yukon so arctic cold will be limited.
-
Yeah but mostly rain first. The cold drain happens throughout We’d night/Thursday and eventually sub-freezing reaches SNE but most of the precip is rain before that happens. The bigger question is how much snow can happen from the last piece of energy rotating through for Friday. GFS has been a little more aggressive than other guidance. It’s dropping several inches while Euro is more like a little bit of light snow.
-
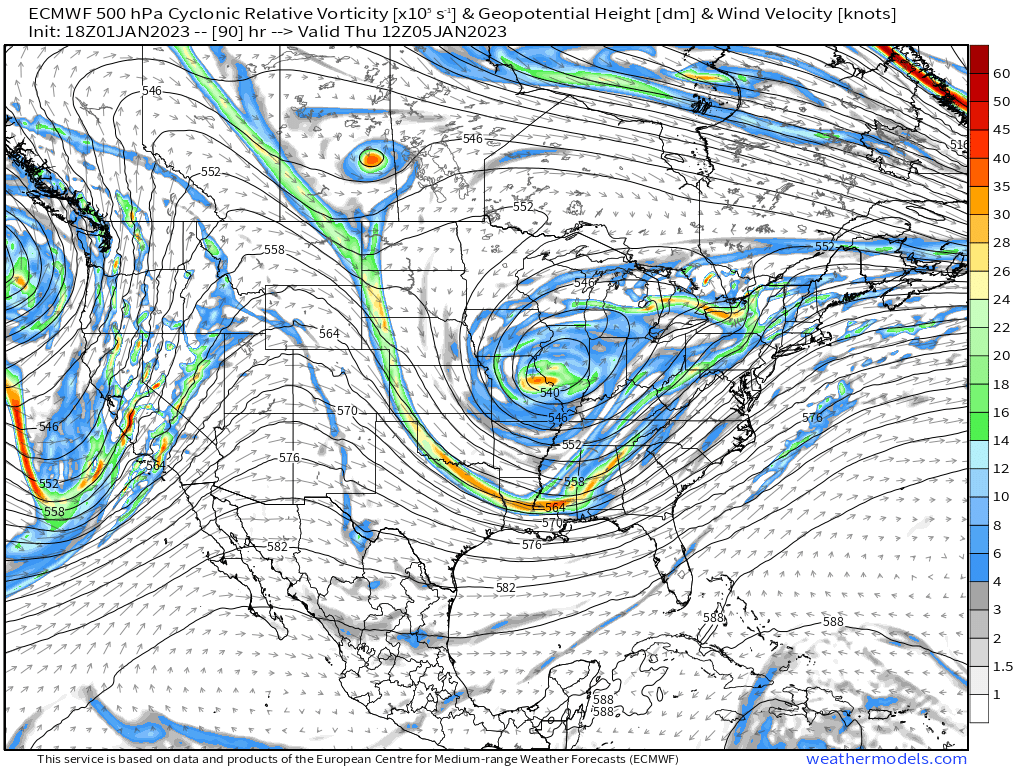
18z euro got more interesting. Here’s 90 hours (doesn’t go out any further on off-hour runs)….it’s already below freezing down to the pike at this point away from the coast…but that’s an awful lot of energy lagging back

-
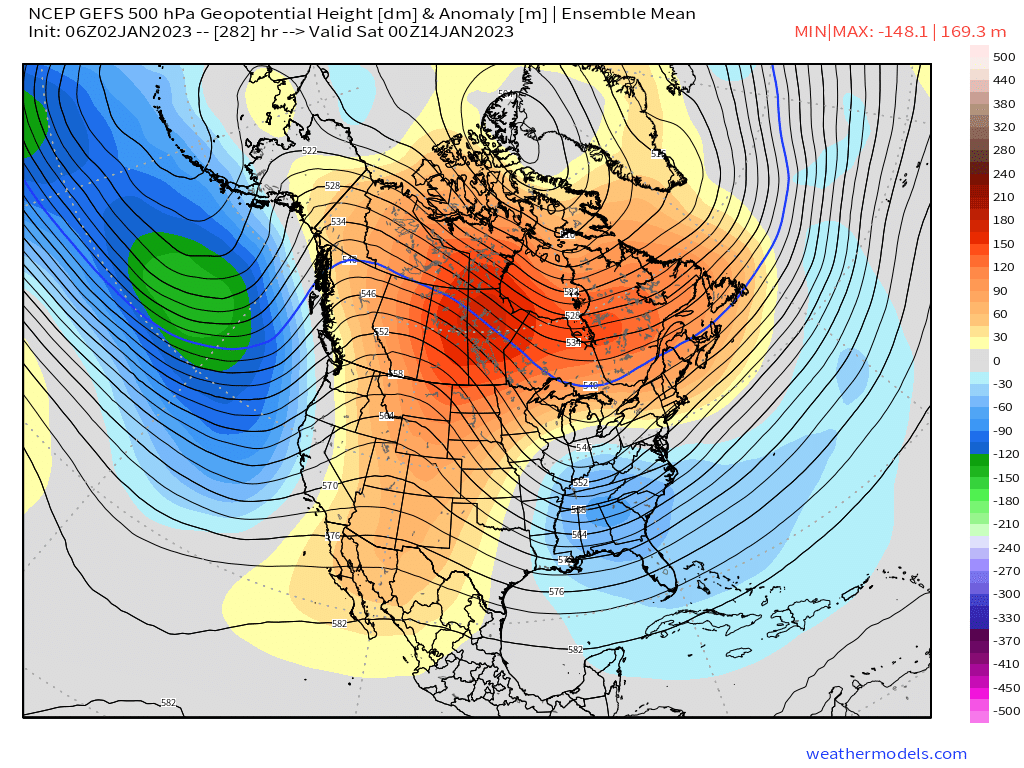
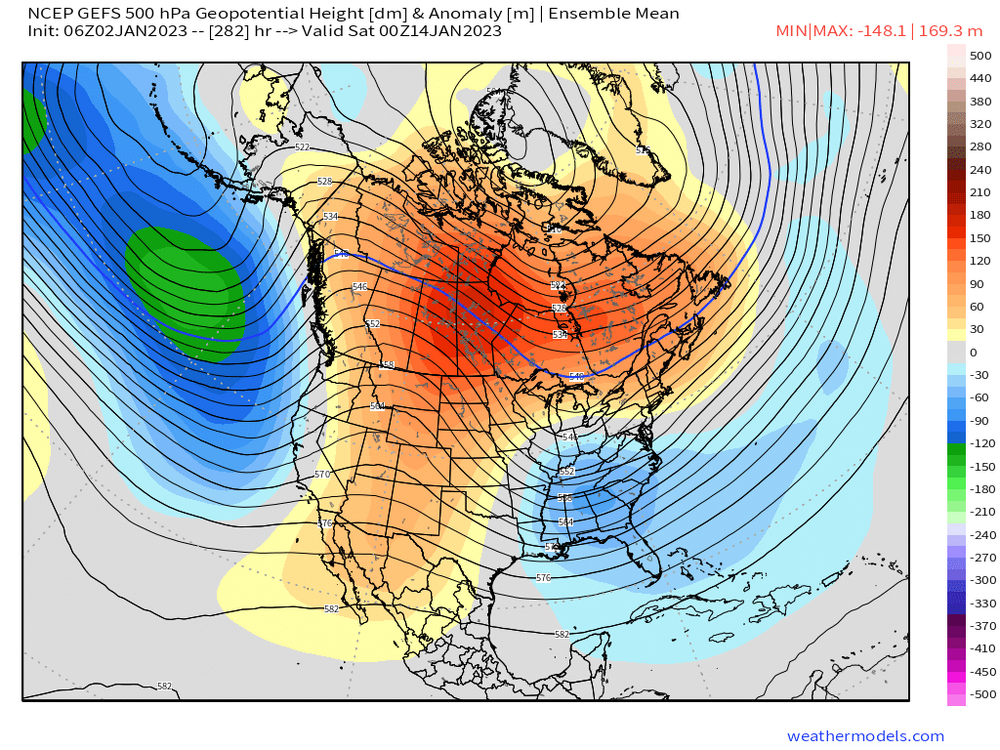
Longwave pattern is really just showing where the general above normal and below normal heights are. We cannot discern from those maps how individual shortwaves will behave. So we typically like seeing ridging out west and into AK and troughing in the east…or ridging over Greenland/NAO region. You can see from the map that Brooklynwx99 posted, the height pattern is quite favorable for us. We like that look for trying to get snow events in here. We know this because of past years with similar looks and they tend to produce more often than not. But as we learned in December, there’s no guarantees.
-
Yes. It has always been like that. I was just chuckling at the sentiment that the pattern was being kicked down the road or that it never developed.
-
The funny part is we got the huge blocking to verify…but as some of us said before that pattern, nobody cares about longwave patterns in here, they care of it delivers snow or not. The pattern can set up like models showed but if the big snowstorm doesn’t happen, it’s irrelevant.
-
OP run is split flow but there’s a risk that some of the mildness could come in from over the top a bit which is what it’s trying to do. It doesn’t really change what we’ve been looking at beyond that though.
-
EPS got quite a bit snowier in CNE than 00z for Thursday/Friday.
-
It’s good that pretty much all guidance has been trending toward that lagging wave. Whether or not it ultimately succeeds is obviously still up in the air but we’re getting a mix of some actual hits and close calls on the guidance which is fine for 5 days out on a system that isn’t even occurring in a favorable larger scale pattern. We’re trying to “steal” this event before things look more favorable toward mid-month.
-
Yeah…relatively speaking. In an absolute sense it wasn’t all that crazy. It was just a more defined coastal with a CCB over New England.
-
Nah I doubt it. High position is totally different so it won’t be this weird coastal front back over Fitchburg like in the 12/16 event.
-
Uncle on a bender again at 12z
-
Close though. Seems like it invests a little too much in the lead wave. But even that one looks icy over interior SNE N of pike and snowy for CNE/NNE
-
Here comes the GFS
-
EPS wasn’t too enthusiastic about 1/6, but it wasn’t awful either. Hopefully we get an improvement today on 12z. EPS are still showing a great pattern though in the 11-15 like yesterday so that is 2 runs in a row where it went the GEFS route of a much better looking pacific.
-
Crazy uncle gone wild
-
GFS coming in better than 18z for next Friday.
-
As long as the poster is not here in bad faith, we allow and we laugh.