Vice-Regent
-
Posts
1,732 -
Joined
-
Last visited
Content Type
Profiles
Blogs
Forums
American Weather
Media Demo
Store
Gallery
Everything posted by Vice-Regent
-
The AMOC is slow enough to stop further catastrophic melting of the Greenland Ice Sheet but fast enough to cause extreme heat events in Europe (and the US?). That can't be a good thing. As well we know Antarctica holds 5x the fresh water content of Greenland. Maybe it's just a natural variability and revision to the mean but I would say it's not a good sign. We still have tremendous heat transport in the Atlantic. This can't hold for much longer without causing massive damage to something/somebody. If you thought Sandy and Harvey was bad just wait a few years.
-
That's rain on ice at the surface. We shall see.
-
All fair points. The packing in of Global Warming into the political divisor was massively unethical and the momentum is relegated to a election winning (in this case losing) cliche. Democrats are the worst offenders to date. It's one thing to ignore the science and another to disparage it. I have never self-identified as democrat or republican. By and large Cape May County is red. (Republican). Cities are the number 1 reason for population overshoot and environmental degradation. It's clear to me now that environmentalism has been co-opted by neoliberalism and the obsession with consumer choices. Since this issue is so deeply embedded in politics (where it has no business being) it is necessary to elaborate on how we got here. This is a fiscal problem - a engineering problem. Democracy is not equipped to deal with such problems of scope.
-
Elaborate insight into the hazards of coastal life. What I was referring to was the enormous obstacle in reducing damage from sea level rise. Also as you point out increased coastal development masks the signal a bit and beach replenishment covers up the damage at least temporarily. Look no further than Tangier Island in the Chesapeake which should completely vanish from nautical charts by 2035 thereabouts. Essentially. You need to redesign civilization from the ground up to prevent catastrophic global warming without the usage of abrasive solar geoengineering. I think throwing global warming into the conspiracy theory basket is a great disservice to posterity and science. I'm sure all of the long-term posters would agree with this line of thought. There is no conspiracy in alarm-ism. Remember Global Warming is the canary in the coal mine hinting at the unsustainable nature of civilization (which had required millennia to advance to fossil fuel based agriculture). Take for example the amount of raw materials and rare earth minerals needed to sustain both the renewables and tech industries. We aren't doing enough and the window is closing on us rapidly.
-
We live in a deeply troubled society. Anyone debating that aspect of our life should get the cold shoulder. However I am concerned when such valid points are presented behind a facade of malicious intent or for lack of a better term - trolling. I'm not sure if such methods are effectual in changing the status quo. If nothing else - counter-productive. Until proven otherwise. Best to stay true to the purpose of this forum. Give us the proof. I have layed our why the Arctic is behaving in this manner - seemingly to shield itself from the onslaught of the heat flux over Siberia and North America. Sadly it just cements our demise even more as people become more complacent and the climate system has a instantaneous state change resulting in multi-meter decadal sea level rise.
-
The heat is put simply building outside of the CAB and the CAB is mostly centered around 80N. You would really be hard-pressed to have a completely ice-free Arctic. It's more significant to have an ice-free Bering Sea all year around for example. Perhaps as a Canary in the coal mine for the Arctic as a whole.
-
We love our bbr2314 (Quoted from ASIF) bbr2314 « Reply #1603 on: Today at 07:49:13 PM » The situation has actually been quite similar to 2012 this June, IMO. The differences are that we are more "advanced" in accumulating oceanic heat so the Hadley Cells have advanced farther north, while the albedo impacts have also created new negative anomalies as ^ has occurred prior to full continental melt-out. You can clearly see that heat has been pouring into the Arctic just as it did in 2012, only this year, due to what has happened re: Kara, it has been forced even farther N, entering over the Laptev. The anomalies have been scorching over half of the Arctic. While the rest of the CAB has been about normal, that is irrelevant to what is going to happen next. If you roll 2012's monthly anomalies forward, the areas that accumulated the most heat early on in the season featured the brightest reds come September and October. If we can imagine the same happening this year (and I don't see why we shouldn't at this point), we can magnify the June pattern into July, August, and September. This results in a near-perfect "sequential" melt out of the weakest ice in terms of accumulating albedo feedbacks into autumn, so the "order of operations" for reaching the CAB and melting it out by late July or August is much more efficient this year than in any year prior, IMO. Oh, and the PAC is far worse than 2012, as is the high ATL, in terms of SSTs / available & impending heat through autumn. Screen Shot 2018-06-24 at 1.42.51 PM.png (260.33 kB, 1102x952 - viewed 0 times.)
-
Perhaps the heat flux is forcing the PV to be more compact in addition to some natural summer variability in the Atlantic domain. Global warming saves the ice? Could be at least for the time being until some bigger players enter the field. Those factors would include melting of ice from below and rain on ice/humid arctic.
-
Tell us more about the ice retention @The_Global_Warmer
-
I am skeptical. If anyone has saved output from prior years it would be nice to have a reference. If the PAC is trough-prone you can be sure Greenland will get roasted by sun and rain. The SSTAs are not cold like 2013.
-
-
Droughts tend to dissipate in winter so this comes as no surprise. It remains that we are ill-prepared for the warm season. Maybe some beefy heat domes over the Midwest or even more east than that. Something we haven't seen really since maybe 2010.
-
What in the actual......
-
-
Where did you go? You were absent from the forum for months now you come to trash post about a valid point?
-
If you warm the pacific, you will get normal or below average temperatures in the US East and Midwest like clockwork until we fully transition. Just how the climate system is setup with the east sides of continents having the advantage of the cold air not moderating over the oceans.
-
More proof of an abrupt change in the system.
-
That is some serious global cooling. I am at like -0.2 for December so far.
-
The climate system is cracking. Entire PV is stretched meriodionally. Global cooling is not actually occuring tho....hillarious.
-
It's a complex story. No doubt about it. One could be fooled into a false sense of security, uncanny.
-
No games here, it's called all or nothing amplification of the flow with the PV getting stuck over North America. Blocking is the hallmark of stagnant weather patterns.
-
Scary stuff, please end fossil fuels.
-
-
-

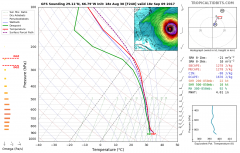
gfs_2017083018_fh240_sounding_29.11N_66_79W.png
Vice-Regent posted a gallery image in Members Albums Category