

eduggs
-
Posts
5,133 -
Joined
-
Last visited
Content Type
Profiles
Blogs
Forums
American Weather
Media Demo
Store
Gallery
Posts posted by eduggs
-
-
The 12z ECM is obviously great, but we gotta watch that eastward slide at the end. The relatively low snow totals in SNE are a small red flag. I'd prefer this to tuck into RI and stall then to slide east so quickly. We're good for now but if the eastward pull happens earlier we get the SNE modeled snow.
Then again other guidance (e.g., UK, CMC) hammers SNE.
-
1 minute ago, NEG NAO said:
plus isn't the GFS OP just considered another ensemble member ?
I've heard that. But I don't believe it's true. The GFS OP is run at a higher vertical and horizontal resolution and also uses the observed initial state and boundary conditions. The individual ensemble members are run at a lower resolution with perturbed (adjusted) initial conditions.
If you move far enough out in time horizon such that the resolution and data advantage of the OP run is minimized, I suppose the accuracy of any single individual member might approach the accuracy of the OP run. I'm thinking probably out beyond day 10. But at closer ranges the superior resolution and more accurate initial time steps of the OP should make it superior.
-
 1
1
-
-
The UK is kind of a classic major I-95 nor'easter. Snow takes forever to push northward from DC/Balt to our area and then the precip. shield wrap tighter into the bombing SLP and hammers the immediate coastal areas.
-
 1
1
-
-
The GEFS mean reflects some timing variability that is spreading out the QPF mean. There are a couple of different very minor h5 shortwaves that some individuals are keying on. Lots of spread on the GEFS even compared to the EPS and GEPS. There are a couple of good hits on the individuals, but not a ton.
-
2
-
 1
1
-
-
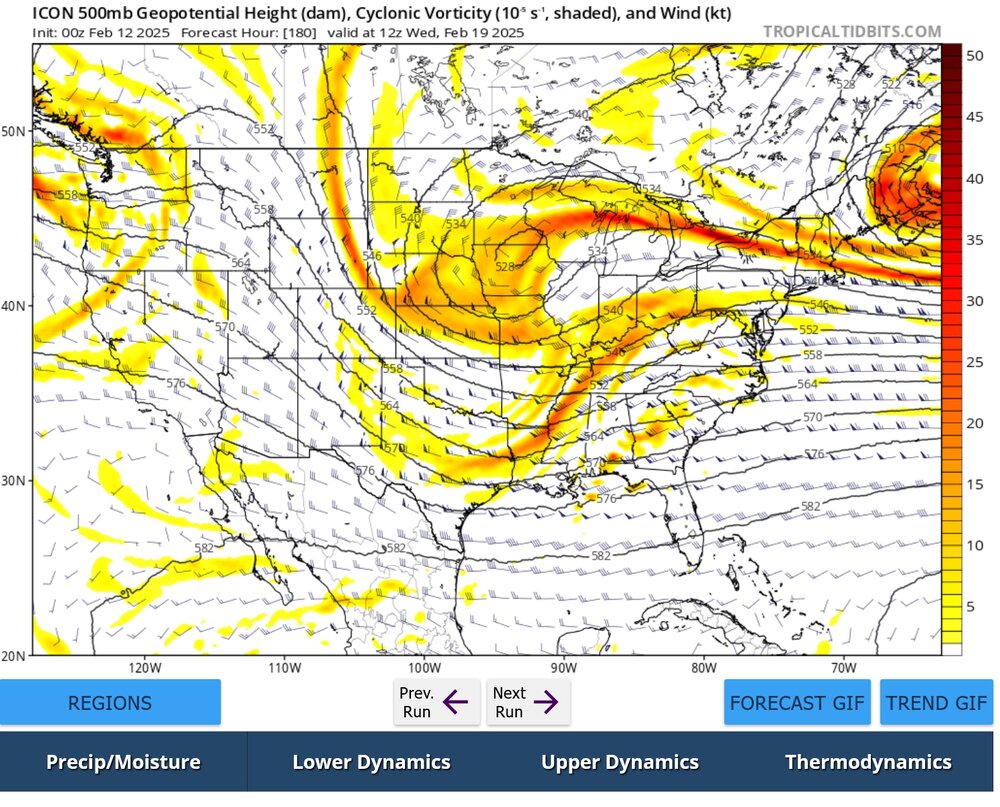
The GEFS mean at 500mb is a pretty good match for the 12z CMC through 126hr. It looks good to me. But the evolution of the CMC after this time period is key for delivering a big coastal storm.
-
1
-
-
Not enough amplitude on the trof on the GFS. Hope it's a blip.
-
1
-
-
12 minutes ago, psuhoffman said:
I keep an eye on other areas for skiing purposes...and to give you an example for a week the ICON was way SE of most other guidance with the storm this weekend up in New England, along with the Euro AI BTW...showing the storm redeveloping off the coast v cutting up into upstate NY, showing the rain snow line never getting into VT when other guidance had it getting all the way into northern VT almost to Canada. Guess which models won and the ICON finally caved last night on that...now has the storm cutting with the mix getting into northern VT. You have to apply the models typical bias to their solutions when judging what is or isn't a "good" run. It's different if the euro which is the most amplified model typically is weak and progressive. We want to see the euro cranking up some 970 monster. The ICON...its find if its weaker since thats its typical error.
I follow that same area for skiing purposes as well, but I don't fully agree with your analysis. The ICON, GFS, and CMC were clustered fairly close together for several days. Only the ECM showed a stronger primary SLP holding on and sending mixing into NVT and NNY. Yesterday the GFS shifted a bit towards the ECM, but the CMC stayed in the southeast (faster 2ndary development) camp. It's a bit difficult to judge since it changes every cycle, but I would say the ICON has adjusted similarly to the GFS. From NW to SE the order has been ECM, GFS, ICON, CMC... with the NAM now the furthest NW as we approach shorter ranges.
I have not noticed the ICON having a "weak" bias relative to the other mid-range models. Certainly it has less of a tendency to amplify minor shortwaves than the NAM. But from what I've seen it's fairly middle of the road in its upper level synoptics and surface reflections. Regardless of its specific biases, it is slightly less accurate than the CMC and UK. It's one of the best mid-range models in the world, but clearly on the 2nd tier.
-
 1
1
-
-
0z EPS looks great. Lots of left leaning individuals and a robust mean QPF total. GEPS similar.

-
1
-
-
Great 0z cycle. GFS, CMC, and even ICON are not that far off aloft. Big time threat. I'd ignore the kuchera snow output for now as it can only lead to disappointment.
-
2
-
-
I think the 12z EPS looks excellent for late next week. I couldn't really draw it up much better at this stage unless I wanted to risk mixing with a direct hit. I guess you could ask for slightly longer duration if you were really greedy. But it has high end potential, only modest (for this time range) spread, and lots of good hits among the individuals.
-
3
-
-
ICON, EC, GFS, and ~ 25% of ensemble members have offered snowstorm solutions over the past 2 days for late next week. There is clearly some inter-model support here. Very tenuous with the PV evolution though.
-
1
-
-
CMC would work.
-
1
-
-
Every storm is unique so each favors a different area. Trying to fit everything into "patterns" and storm types like "gradient" or "SWFE" is way too simplistic. There is just too much variability and randomness.
-
1
-
-
8 minutes ago, EastonSN+ said:
My point was the largest snowfall output on the ensembles was 11.5 for Central Park.
I believe the EPS and GEPS 10-day (240hr) mean total snow got into the 13-15" range for the metro for a few runs. Can't confirm the highest GEFS total for NYC, but some areas were over a foot for run total (384 hr).
-
1
-
-
3 minutes ago, EastonSN+ said:
Ensembles had 11.5 for a Central Park and they ended up with 5.5 so far. The 360 hours from that ensemble run includes this coming up weekend so if Central Park gets another 2 inches will be at 7.5 which is not far from what the ensembles were showing of 11.5.
So not that far off from the ensembles.
The problem was a couple of op runs were insane.
You are aware that the GEFS is run every 6 hours right? And therefore the mean total snowfall at 10:1 also changes every 6 hours...
-
It's hard to tell if the UKMET would turn the corner, but I like where it's at for the end of the run. Big time threat there. Statistically we're probably looking at a hit 1 time in 5 here. A big hit maybe something like 1 in 8. Major snowstorms are uncommon and still more likely than not to miss even with favorable synoptic features in place.
The evolution of the elongating PV will determine the outcome.
-
1
-
-
Perfect GFS run but 8 days out. Peaked too early
 . 0z ICON was heading in a similar direction. Obviously key to get the PV lobe to split off and dive far enough south and west to give room for a ridge near the coast.
-
3
-
-
The AO, EPO, PNA stuff is like vodoo. If you are a true believer, you might see a causal connection to an outcome in hindsight. But those parameters are simplistic, numerical representations of a very complex atmosphere-ocean interaction. They are merely broad descriptions of characteristics over a very large geographic area. The correlations to local weather outcomes are very tenuous.
Our weather, storm tracks, and rain vs. snow are local phenomena. The details of synoptic progression and evolution matter far more than the state of the indices.
-
1
-
 1
1
-
-
47 minutes ago, LibertyBell said:
for some reason this area never gets ocean effect snow even though we have a 100 mile coastline with the ocean down here lol
It's uncommon for sufficiently cold air (to generate ocean-effect snow) to advect from the east.
It's pretty cool to see it happening today with the high in Quebec, coldish air in place, and a moist easterly flow.
-
2
-
-
Storm track is driven by regional weather features not global or continental-scale indicies.
-
2
-
1
-
-
Can we have this happen please?
-
1
-
-
1 minute ago, jm1220 said:
It's the 700mb fronto band that very often develops in these storms. Someone up there might end up with a few inches.
But it seems to be missing in EPA and WNJ.
-
What's up with the explosion of returns in CT?
Just flurries here.
-
Looks sweet in SNJ tonight! Nice. I think that area has had more SN+ obs this winter than some northern areas have had in total since 2020.

Discussion-OBS snow event sometime between 06z Thu 2/20-12z Fri 2/21?
in New York City Metro
Posted
The low totals from the 12z ECM operational run are due to the SLP not gaining latitude. An ULL (offshoot of PV) forms off the coast and oozes eastward as the system stacks, pulling the whole system eastward. Great position for us, but not great for places further northeast.
Many of the EPS individuals gain more latitude and would be great up and down the coast. But a slide east either with a modest event or a complete miss are still very possible.