

eduggs
-
Posts
5,133 -
Joined
-
Last visited
Content Type
Profiles
Blogs
Forums
American Weather
Media Demo
Store
Gallery
Posts posted by eduggs
-
-
51 minutes ago, Sundog said:
Nuclear power is the best solution for producing clean baseline power, and power that can be spun up quickly when there is an energy demand spike. You can't have full renewable when a lot of that is just not producing energy at a steady rate 24/7. Winds die down, the Sun goes down.
I don't believe battery technology is close to where it needs to be to store solar/wind energy to the point where if those two aren't producing any energy, that batteries can pick up the slack. Again, it's the need for a steady, baseline level of energy and very quick spin up of additional energy in the event of an energy demand spike where nuclear comes into play.
Nuclear is very safe. Fukushima is not a good example. It was a 50 year old plant, next to the ocean, and in a major earthquake zone. Those are very specific environmental and geological conditions/dangers that are hard to replicate in many places around the world. For example, none of the factors that casued Fukishima to get damaged exist in large swaths of the USA.
The Earth doesn't care who polluted and how much humans pollute per capita in different countries. All it knows is that its heating up and it's getting bad. This notion that countries should be given time to catch up in terms of pollution since they were slower to industrialize is completely insane and not a serious positition if someone truly cares about the Earth. The technology TODAY didn't exist when the USA was industrializing. There is no excuse for China to be building TODAY dozens of new coal power plants since now there are many other options that simply didn't exist in the past.
I also disagree regarding the aerosols. One can say that solar is a type of futuristic technology. Certainly solar is a true deviation from the traditional "turn water into steam to turn a turbine" method of energy generation. If we didn't give it a chance then it would have never flourished into such an important energy source.
Aerosol usage is better than hoping the world does the right thing one day. I don't see why it would discourage the reductiuon of fossil fuels. If anything it may actually give the world time to organically shift over to renewables all while keeping the Earth from burning up in the meantime.
It is not correct that renewables cannot provide sufficient baseload. That classic argument about winds not blowing or the sun not shining is outdated ignorance. Hydro, geothermal, and a variety of wind/solar with battery are completely viable alternatives technically. The issue comes down to economic viability. Nuclear can and does provide an excellent and relatively affordable supply of baseload power. The issue with nuclear comes down to society's appetite for risk. Fukushima Daiichi was considered much safer than most currently operating nuclear power plants in the US. We cannot anticipate and mitigate all sources of risk. Even if the likelihood of catastrophe is very low, if the consequences of such an event is that a large area is rendered essentially permanently uninhabitable, the overall risk assessment might force us to turn elsewhere. Society still doesn't have a permanent solution for spent nuclear fuel, which presents a significant risk for potential accident or terrorist act.
-
Technically no energy source is completely renewable. Most of what we call renewable is directly or indirectly driven by the sun, which is very slowly exhausting its hydrogen fuel. Tidal energy is harnessed at the expense of a very minor deviation in the orbit of the moon. Eventually even these sources will be completely depleted.
Obviously for our purposes they are infinitely renewable. A combination of solar, wind, hydropower, geothermal, and wave/ocean energy is entirely sufficient to fuel our energy needs. The huge expense associated with fully transitioning is the remaining obstacle. Continued advances in battery storage technology and transmission lines from isolated sources is needed in improve the economic viability of new projects. But we have long passed the time where the technological viability of 100% renewable is already there.
Nuclear power can be a part of this solution/transition/process, but it's not needed. Fukushima Daiichi showed us once again that no technology is completely safe, and the consequences of a nuclear accident might be too severe to warrant the risk in some places or circumstances, particularly if other less dangerous energy sources are viable.
China is the leading emitter of CO2 currently, but not per capita. And if you look back at the cumulative history of CO2 emissions, the US is far and away responsible for the most CO2 emissions. India is a growing emitter, but still lower down on the list, particularly per capita. Sure it's more effective to get all countries to work together, but certainly the US has a big responsibility to lead on this issue.
The prudent thing to do is to implement everything at once - reduce GHG emissions, transition to renewable energy sources AND investigate strategies to reduce surface heating. The danger is that if we rely on unproven, futuristic technology to save us, that might lessen the urgency to transition away from fossil fuels. Venting a life-essential molecule out to space BTW is a terrible idea.
-
1 hour ago, Brian5671 said:
Jet is too strong for anything to amplify. More importantly we are missing out on precip with these events. Going to be a dry spring and water issues if things don't change soon.
Tue-Wed is super amplified. Big phase, neg titled trof, big QPF, and strong SLP. So we shouldn't really say it can't happen.
-
11 minutes ago, snowman19 said:
The fat lady is standing at the mic and is about to sing on this winter. This coming weekend is a unanimous nothing burger on all the models now. Just more of the same completely uncooperative northern/southern branches; lack of phasing we’ve seen for the past 5 months, then the pattern flips to warm after 3/10…..
All guidance actually shows a pretty decent phasing event on Tue - Wed of this upcoming week. Pretty classic phase with the trof taking on a negative tilt and a strong surface SLP. Should be a big QPF maker and significant snowstorm for deep interior Ontario.
-
12z ICON, CMC, GFS, UK, and ECM all have a distinct (trackable!) wintry threat for Sat 3/8. Nice to see a sudden move towards model consensus. Too bad it's still 7+ days out.
-
 1
1
-
-
I honestly thought JB would be unemployed and homeless by now. Surprised to hear his name mentioned... It was obvious to everybody about 11 or 12 years ago that he is a garbage meteorologist, a fraud, and an idiot.
-
 1
1
-
-
49 minutes ago, North and West said:
New Jersey does a lot wrong, but does fire prevention well. California shows what happens when you add fuel from what could be preventable (brush and forest management) to what isn’t preventable (dryness, winds, sparks) and can get conflagrations that impact people and property.I'm confident (though not certain) that you know less about fire prevention than experts whose job it is to know. The issue is likely a lot more complex than you indicate.
-
 1
1
-
-
1 hour ago, ORH_wxman said:
The first half of March looks pretty interesting. Maybe we can finally pop a big one, but probably not.
The averaged anomaly charts have been looking interesting most of the winter. But the actual realization of shortwaves has continuously materialized as not interesting.
-
2 hours ago, LibertyBell said:
This is part of my argument for why summer heat should be judged by number of 90 degree and higher highs and why winter cold should be judged by number of 32 degree and lower highs.
How about we average every hour of the day instead of just the high and low? Then we would have a much better index of the temperatures on a particular day.
-
On the subject of temperature records... is anybody concerned about how temperature departures are calculated? Is averaging the daily high and low temperature even all that representative or comparable? Should it matter if a low temperature was achieved after a brief but precipitous drop vs. a constant temperature for 16 straight hours? All this fussing about reference periods and minor anomalies... when the method of calculation is hardly precise or rigorously scientific.
-
1
-
-
13 minutes ago, LibertyBell said:
You need to move closer to the coast ;-)
Apparently. I'm running behind all coastal regions from Cape May to Cape Cod since 2021.
-
1
-
-
On 2/9/2025 at 3:11 AM, Rjay said:
2022.... when you had nearly 2' of snow
Meh storm. Just a couple inches.
-
The Feb 28 - March 3 period is still worth watching. There's a tendency to amplify the flow for successive waves with marginal cold air and a modestly favorable longwave pattern. The 12z ICON, CMC, UK, and EC-AI show significant coastal storms during this period, though with mostly non-frozen precipitation. As usual, the nuances of wave interaction will be key to determining if we can sneak anything wintry out of it.
-
2
-
-
37 minutes ago, CPcantmeasuresnow said:
0.6 inches yesterday enough to whiten up the 3-4 inch snow/ice pack.
30.3 inches for the season and 45 days of snow cover this season and counting.
Last year 30.6 inches for the season and 26 days of snow cover total.
Normal temperatures for December through February make it feel like I actually experienced winter for the first time in three years.
The Hudson Highlands area had an OK winter this year, especially when you factor in a few early season localized light/moderate events and the sustained snowpack. But I drove through parts of Orange and Putnam yesterday and there was a lot of bare ground on southerly, sun-baked aspects and the usual late-winter snowbanks on the sides of roads were largely missing. People were ice fishing out of the lakes, but the vibe was of a low-snow winter.
Down in northern NJ this is the 3rd winter in a row essentially without snow, particularly east of the I-287 terrain boundary. It's been a miserable stretch for snow lovers.
-
1
-
 1
1
-
-
Yup. Days and days of fairly steady modeling showing a miss despite an anomalous setup. Absent a few 5-7 days runs with coastal impact, this has been well telegraphed. You can't even hang your hat on any particular fantasy SREF member anymore as of 15z.
-
1
-
 1
1
-
-
On 2/17/2025 at 2:10 PM, LibertyBell said:
hmm Japan was also very cold and they got record snows
Japan has had a relatively warm winter. Despite that, some of the "heavy snow regions" have had a snowy winter... probably partly due to the warm anomalies in the Sea of Japan. Or are you referring to a different year?
-
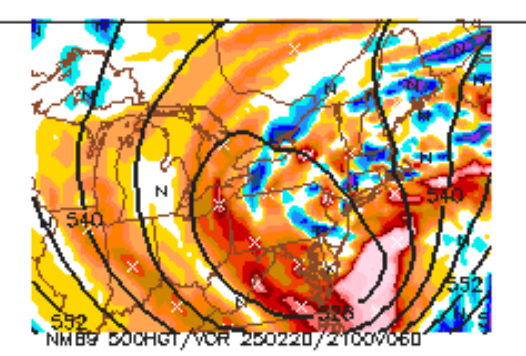
NMB9 showing the extreme (weenie) solution.
-
1
-
2
-
-
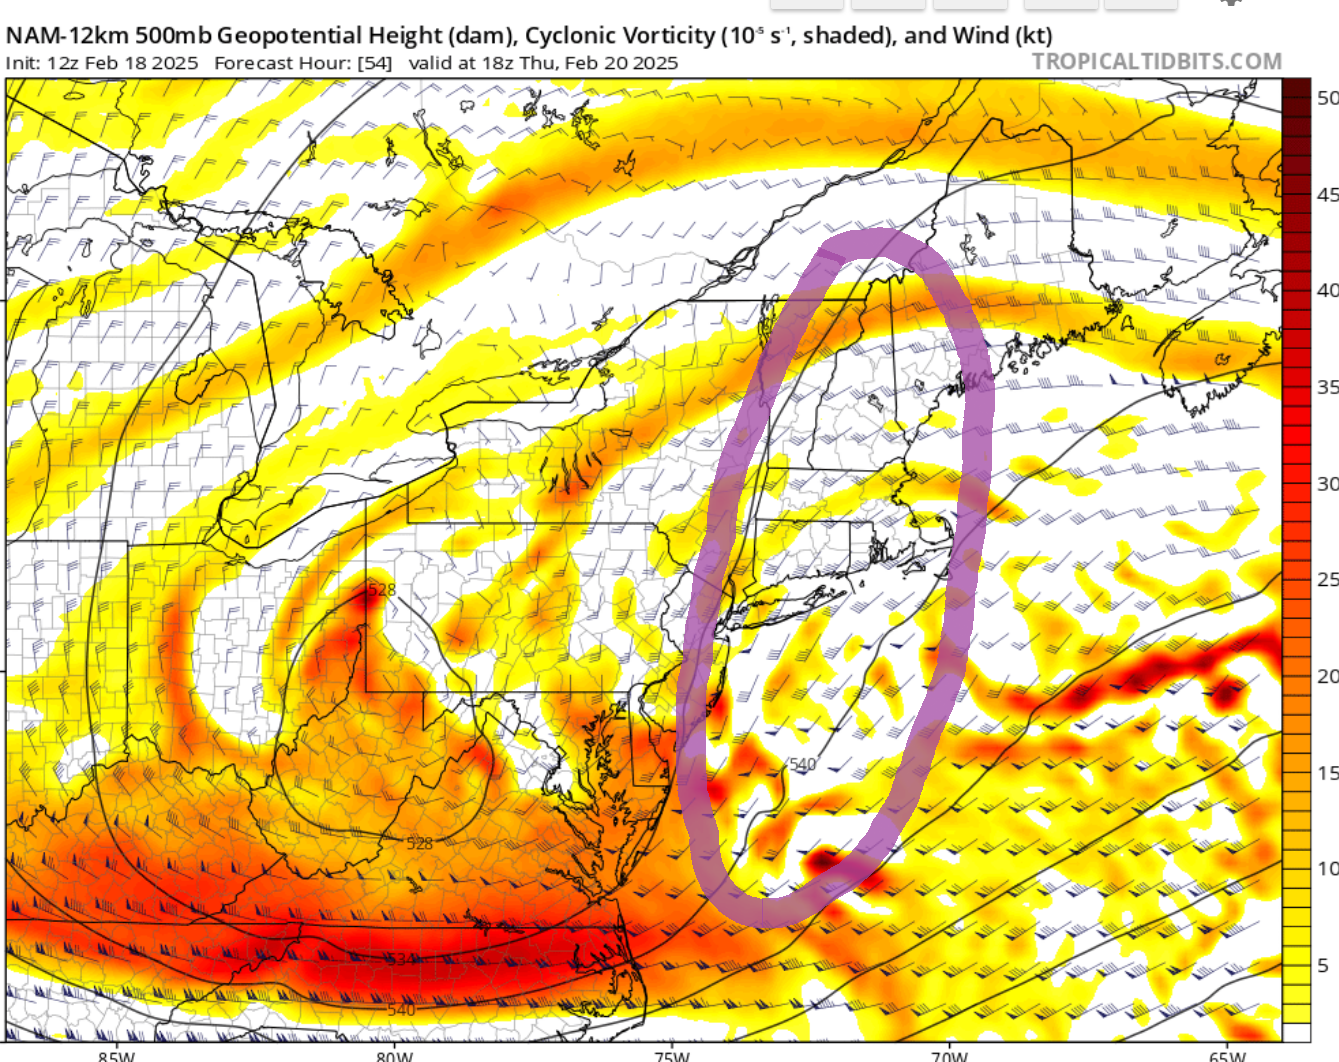
A quick look at recent SREF members shows the kind of upper level evolution that would be required to get snow into our area from the coastal. The amount of modeled snow is closely correlated with the orientation of the height lines out ahead of the ULL (area highlighted below). In the very few members that show a few inches of snow for our area (from the coastal and not ULL pass), the 500mb height lines are oriented nearly south to north, indicating an ULL taking on a neutral or negative tilt. Note the 12z 12km NAM is on the more extreme end of the spectrum although not the most negatively tilted compared to the full 9z SREF suite. In the majority of members and models that show no snow from the coastal, the trof is positively tilted and height rises in this area are less pronounced. This connection is probably obvious to most. But I still find it somewhat illuminating to look at the individual SREF members since they show variation far outside the likely envelope of solutions.

-
3
-
1
-
-
The 12z RGEM actually made a similar shift to (/toward) the 12z NAM aloft in terms of adjusting the ULL position slightly west and raising heights out ahead. Unfortunately this only translates to a very slight northwestward shift in SLP and precipitation shield. But if you're tracking for the loooongshot chance of a big model bust, then you'd want to see a continued adjustment in this direction.
The RGEM also has some snow with a norlun type feature as the ULL passes.
-
1
-
 1
1
-
-
I think you discount the GFS slightly here because of the other guidance, but definitely not entirely. The GFS shows that if some aspect of this evolution is not favorable, the whole thing could fall apart. A miss southeast is still very much on the table.
I'll be looking for run to run consistency from the other models in upcoming cycles; minimizing the variability will increase confidence. And of course any improvement in the GFS will be welcomed. But there could easily be occasional misses across guidance for the next few days. It is almost always like that at this range in advance of major storms.
-
1
-
-
44 minutes ago, LibertyBell said:
we dont actually want this to get to that latitude, if you look at maps of our previous widespread 20 inch plus events (February 1983, January 1996, PD2 2003 and January 2016) they go due east once they reach the latitude of Delaware or southern NJ, it makes the snowfall of longer duration for us.
As modeled on the 12z ECM, this is a 12-18hr event, depending on location across our area. Several of the individual members that gain more latitude also provide a longer duration event because we spend more time in the CCB as it pivots over our area.
-
9 minutes ago, Snowman. said:
Jan 2016 the models were all generally locked in to a major snowstorm close to a week out. Right now every major model besides the dogshit GFS has the general area with us near or at least a foot so i’m pretty optimistic.
And it's not like the GFS hasn't bit at all. The 0z was a significant snow event for DCA/Balt to PHL and major NYC to BOS. 6z was still significant for most of the corridor.
-
I don't have access to the individuals, but from the looks of it I'd estimate at least 25% of them would bring > 1.5" liquid to most of the area. Lots of high impact solutions there!... including several more intense than the operational.
But the caveat is that individual ensembles cluster around the parent operational run. So the true chance of >1.5" liquid from this storm is probably less than indicated by the EPS spread.
-
1
-
-
6 minutes ago, Allsnow said:
Sorry, I thought he was talking about the eps. What a odd thing to be concerned about off a op run
It's a definite risk with a pinwheeling ULL pushing into confluence. If the complex is shunted east before mid-level lows mature, the magnitude of event collapses pretty quickly.
April 2025 Discussion/Obs
in New York City Metro
Posted
Injecting aerosol into the atmosphere on a large scale would be extremely risky. We don't know exactly what the impact would be and at the level that would be required to have a meaningful impact, the potential consequences to water resources (irrigation, drinking water, drought), farming (food production), and general weather patterns could be quite severe. This would seemingly also require international large-scale cooperation to avoid regional or global conflict.
This type of technology might be worth investigating or attempting, but it is unlikely to be a magic fix... certainly not without major societal costs and unintended consequences.