

so_whats_happening
-
Posts
1,347 -
Joined
-
Last visited
Content Type
Profiles
Blogs
Forums
American Weather
Media Demo
Store
Gallery
Posts posted by so_whats_happening
-
-
Training thunderstorms getting us good at home (Lancaster) second above average month so far but still down about 5" on the year.
-
July
DCA _ NYC _ BOS ___ ORD _ ATL _ IAH ___ DEN _ PHX _ SEA
+ 1.5 +1.6 +2.1 +1.8 +0.8 +0.4 +.2 +.9 +2
May change a little later but Ill make a note if it does.
Edit: Only raised up SEA
-
 1
1
-
-
10 minutes ago, Stormchaserchuck1 said:
I think Gawx has done research correlating the Solar cycle with ENSO states. I think he found out that there might be a few year lag for highest correlation.. he posted it in ENSO threads in previous years (or maybe I am thinking of the NAO).
Thanks for the solar data by the way, that is actually really hard to find!
No worries here is the other site I used for the in comparison years.
https://solen.info/solar/index.html
Im sure I have more elsewhere in my bookmarks but there are a lot of saved bookmarks to go through lol
-
 1
1
-
-
3 minutes ago, so_whats_happening said:
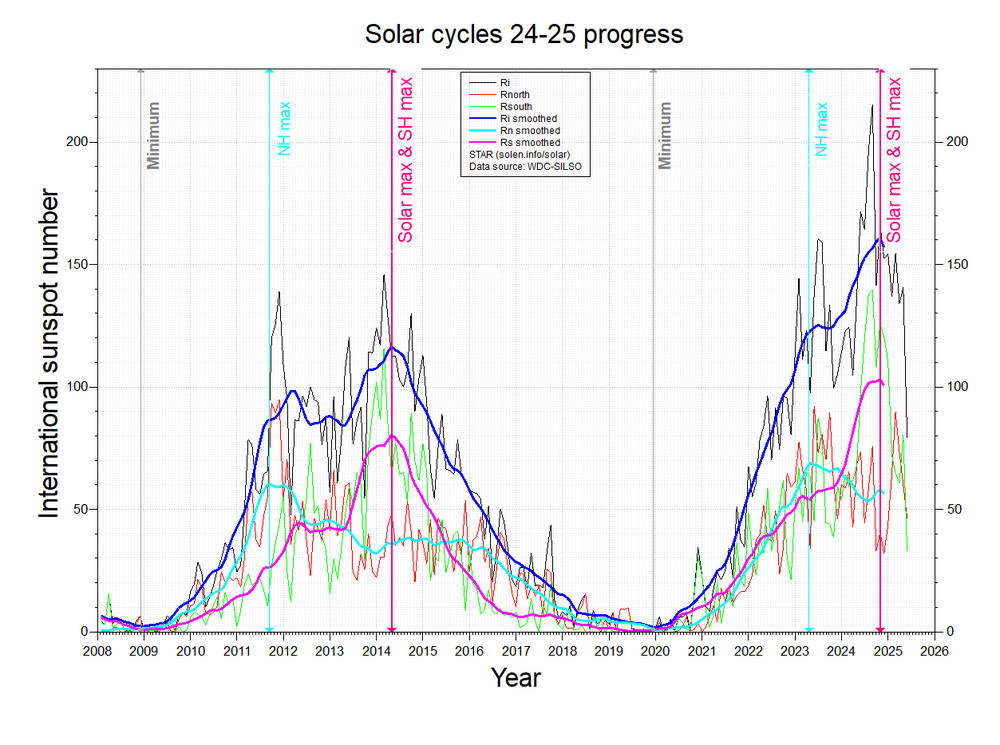
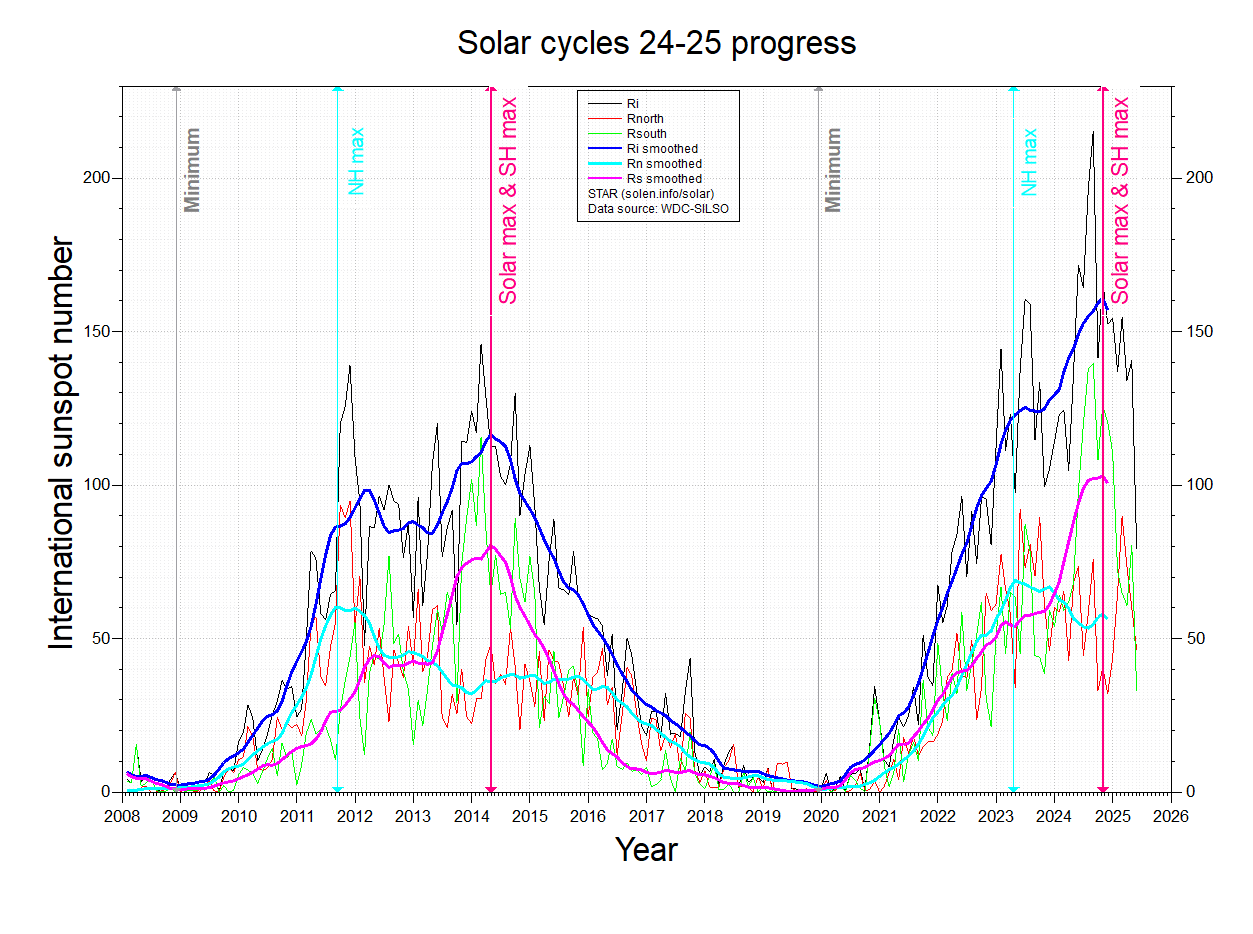
Maybe for the bolded but we also just saw an extended La Nina like pattern emerge at the start of this cycle. Numbers and intensity though are two different things. We had some rather intense flares occur over the last year but numbers overall seemed to be about on par with what is near the 'average' amount based on the number of cycles we have seen.
Cycle 24 started off as an El Nino and in fact had a strong Nino at that followed by another significant one just after peak.
Cycle 23 also started off in an El Nino quickly to La Nina and then a moderate Nino just after peak (2002-03) so im not sure there is too much correlation going on there.
Cycle 23 was double that of 24.
https://www.swpc.noaa.gov/products/solar-cycle-progression
I mean if we extended this all the way to 1750 we would actually be seeing while this year was active the overall numbers are still in a decline mode over the 50+ years. Wonder if start to see it trend up in the upcoming cycles?
I wonder though if we put this with data about hurricanes either globally or solely the Atlantic if we can see some interesting trends come about.
-
15 minutes ago, Stormchaserchuck1 said:
2003-2022 was definitely a low sunspot time, lowest 20-year period since before the 1900s I think. It may have something to do with the higher than average La Nina frequency during that time. This cycle was a big shift up. I'm actually surprised that the numbers aren't higher because of how many times the Aurora moved towards the tropics.. I don't think that has ever happened before.
Maybe for the bolded but we also just saw an extended La Nina like pattern emerge at the start of this cycle. Numbers and intensity though are two different things. We had some rather intense flares occur over the last year but numbers overall seemed to be about on par with what is near the 'average' amount based on the number of cycles we have seen.
Cycle 24 started off as an El Nino and in fact had a strong Nino at that followed by another significant one just after peak.
Cycle 23 also started off in an El Nino quickly to La Nina and then a moderate Nino just after peak (2002-03) so im not sure there is too much correlation going on there.
Cycle 23 was double that of 24.
https://www.swpc.noaa.gov/products/solar-cycle-progression
I mean if we extended this all the way to 1750 we would actually be seeing while this year was active the overall numbers are still in a decline mode over the 50+ years. Wonder if start to see it trend up in the upcoming cycles?
-
2
-
-
1 minute ago, Stormchaserchuck1 said:
Will be interesting to see if we see a change in the Pacific pattern over the next 1-2 years.
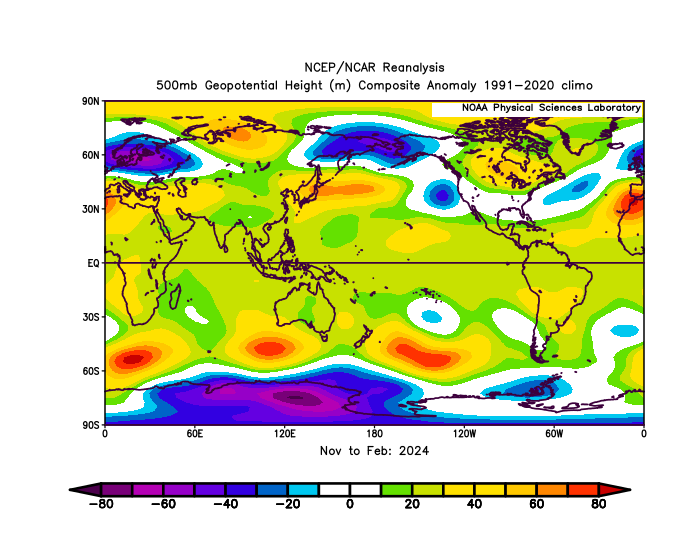
Solar cycle +12 months

Solar cycle +24 months

I do think there is higher likelihood for El Nino in 26-27 and/or 27-28
Yea Im thinking we try 26-27 not sure on intensity but that can be determined.
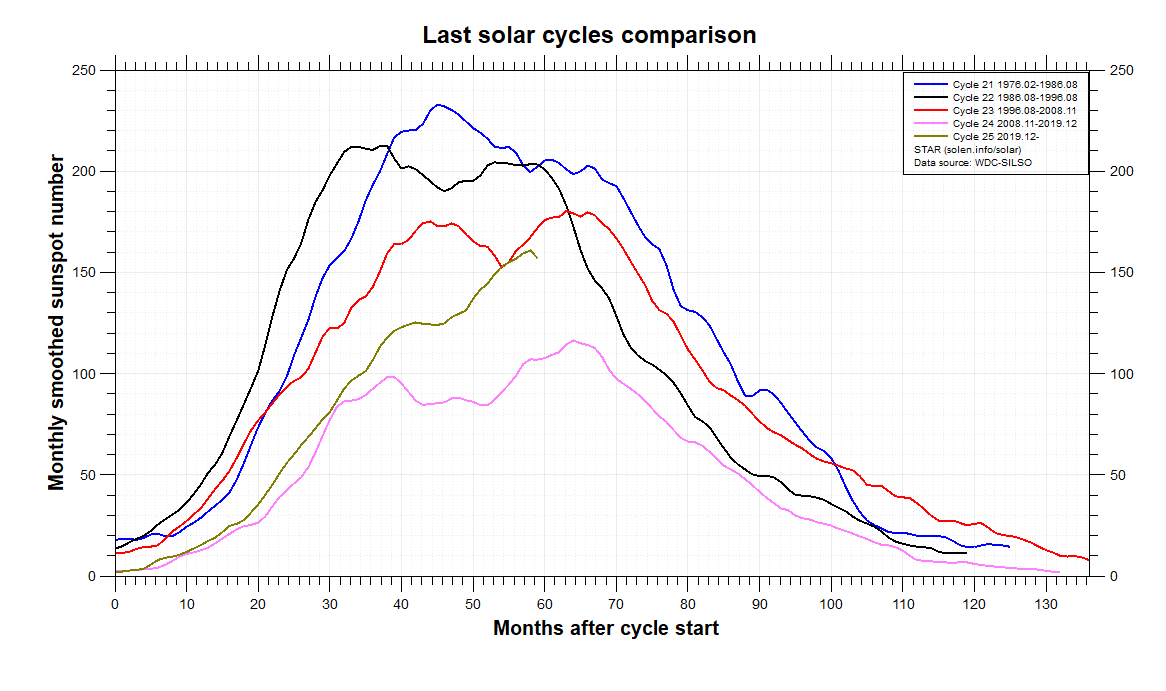
Here is how this cycle compares to the last few. We may be trying to go to a more active cycle in terms of sunspots since we hit our low in the prior.

-
1
-
-
Definitely was an impressive cycle looks like we are dropping off pretty decent over the last few months.
-
3
-
-
2 hours ago, Stormchaserchuck1 said:
The wet pattern just continues and continues


Since 2002, every "developing drought" has been followed by well above average rainfall in the eastern 1/2 of the US.
Since the water year we are still about 4-7" below average. It has only been May that has shown to be above average thus far, decently so at that. April was close but it stuck right along the 95 corridor that managed slightly above average around philly. June has been a bit of a struggle but we need the thunderstorms as we close out the month to produce about 1.5" across the area (PA and northern MD) then we should hit average and maybe slightly above but we have a ways to go before we can say the drought has been knocked out. If we manage near average the next few months we still end up below average for the water year only a tropical system will bring us closer to average or cutoff lows reigning supreme come fall.
-
It is just gross outside 93/76 should hit 98 today and 99 tomorrow.
.thumb.gif.f6aeb2b4087c9963a1439e5d8af523f9.gif)
-
On 6/12/2025 at 6:56 AM, 40/70 Benchmark said:
No, I agree with you.
I was just being an ass, but truth be told, tell me that this......
isn't this in longer and more detailed verbiage....
Sure just feel he likes to make sure his ducks are in order. No harm no foul.
The WPAC is still warm but not excessively warm as it was so chipping away at it slowly is the name of the game. I would be interested to see if the WPAC starts to fire off any tropical systems coming up here with what could be a minor WWB coming up like we saw earlier this month still no typhoon but at least things are trying to get going.
-
1 hour ago, Stormchaserchuck1 said:
I don't see anything that says 100 degrees. I see 1 day in the 90s, but maybe we'll get a few in the 90s.
Yea there may be a random spot or two that get to 100 at least being shown right now but looks to be potentially our first official heat wave of the season, still a week+ out though so who knows.
I will take this lack of heat when I can get it have not had to turn on the AC yet as we have been able to cool down at night properly.
May was our first month above average rainfall wise around here in awhile the last time it happened was August of last year and the only reason was because of Debby had that not happened we probably would have gone almost 12+ months below average.
-
1 hour ago, 40/70 Benchmark said:
"Diminishing trades used to be a sign that La Nina was relenting, but in this new, warmer climate, we will end seeing cool ENSO, anyway".
To each their own just was the first interruption I have seen since the previous Nino. The VP is weakened slightly over Maritime but still in place, though there is weak VP anoms over much of the pacific the last couple months so not sure we get a simple ENSO depiction. Like I have mentioned I could see a warm neutral scenario play out via numbers but we still will have flares of negative ENSO show up just like we had last year with a weak negative ENSO showing up with Nino flares.
-
1
-
-
See how it plays out but this is the first time in awhile we have seen a break down of the enhanced trades and the Nina like standing wave.

-
1
-
-
So sorry was on vacation
DCA: 101
NYC: 97
BOS: 97
ORD: 100
ATL: 99
IAH: 105
DEN: 104
PHX: 118
SEA: 93
-
1
-
-
1 hour ago, GaWx said:
Good catch, the biggest April to May QBO drop on record! Based on the past, the odds are increased that it will dip to sub -20 by winter and possibly even by autumn. But not for certain, of course.
If we can see it start to dip into negative around 50mb this will be a good sign of an overall weaker SPV no guarantees of anything other than probably not the near record levels we just saw. A lot of things still need to come together over the next few months.
Still have yet to see a tropical system in the WPAC beat out last year but looking further into data it seems like the 8th of June is the latest for tropical storm and typhoon is the 21st.
-
2
-
1
-
-
DCA _ NYC _ BOS ___ ORD _ ATL _ IAH ___ DEN _ PHX _ SEA
+1.7 +1.6 +2.1 +1.4 +1.1 +1 +2.1 +1.3 +2.1
-
1
-
-
Typically the low will occur just before sunrise and the high will occur in the afternoon. Weather conditions of course change this up but to simplify it if you were to have for example 83/62 as your forecasted high and low. The high will occur around 2-5pm (depending on the season) and the low will usually occur 3am-6am.
The low temp is usually going into not coming from. So if you happen to have a low of 58 in the morning when hitting that 83 forecast that same day the low going forward is forecast to be 62 for the next morning. So the day before the forecast would have maybe looked like 78/58 going into the 83/62.
When the low or high hits it may just be for a brief moment and not a multi hour situation.
Hope this helps.
-
While oceanic temps have definitely increased probably the most drastic of changes has been in the Arctic over the last 50 years I feel this probably is the biggest reason we have been having issues with pattern semblance over the last decade or two, more notably. It may very well be the reason for such changes to the PDO state but im not ready to make those accusations or conclusions.
Over the last 5 years the Antarctic has suffered rather drastic changes to the ice sheet I wonder if we start seeing similar results within the southern hemisphere as we have seen in the northern with the idea of permanence taking shape.
-
1
-
-
4 minutes ago, GaWx said:
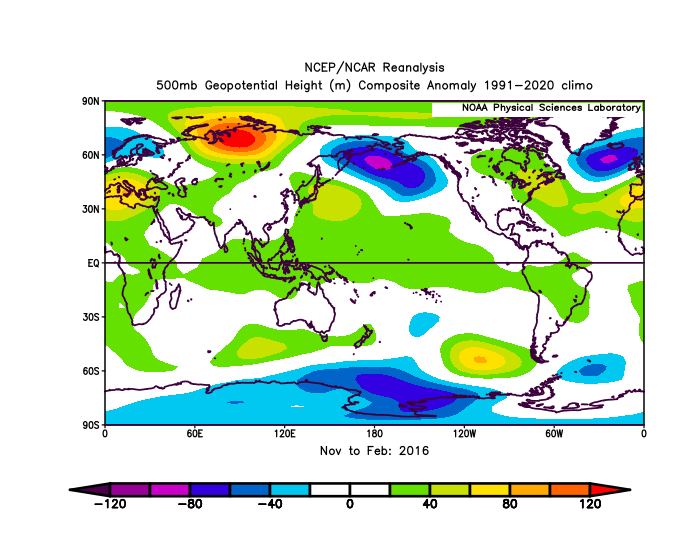
Based on RONI, 2023-4’s peak was only a borderline moderate/strong +1.50 (OND) vs 2015-6’s super RONI peak of +2.038. Even 2009-10’s peak was slightly stronger with +1.56. 2023-24’s DJF RONI then fell to just +1.21.
RONI peaked in 2015/16 NDJ of 2.38. ONI of ~2.6
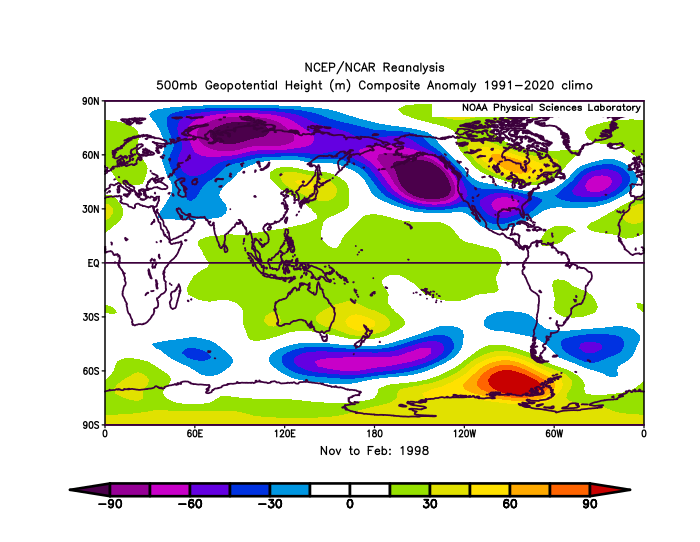
RONI peaked in 1997/98 SON also at 2.38. ONI of ~2.4
https://www.cpc.ncep.noaa.gov/data/indices/RONI.ascii.txt
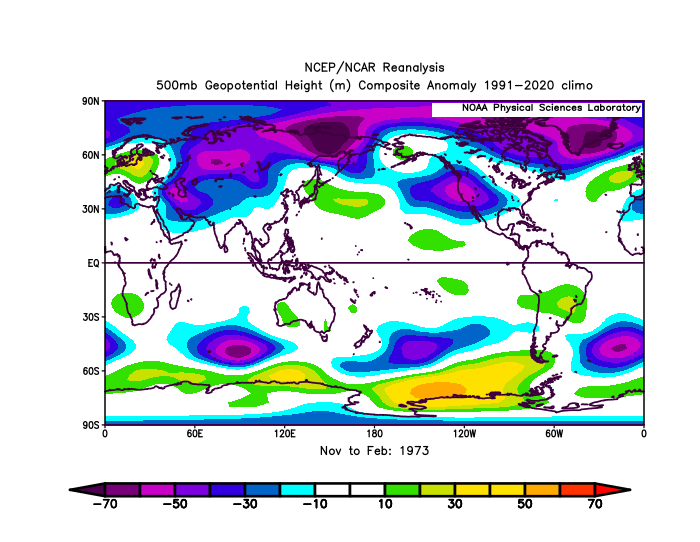
Im personally still not on the RONI bandwagon as being a reasonable indicator of what will occur but to each their own. This type of atmospheric pattern in 2023/24 was closer to the strong/super Ninos even with the RONI showing barely strong status. I included 1972/73 as that was the last deeply -PDO/ +ENSO we experienced of course it is apples to oranges as nearly 50 years of oceanic warming have changed things up a bit.
-
1
-
1
-
-
1 hour ago, bluewave said:
I know that people around here don’t like all the milder winters, but we may need a really strong El Niño like 15-16 to bring back at least some semblance of a STJ. Weak El Niños or warm neutrals such as 18-19 and 19-20 have been struggling against the La Niña background state.
The primary driver has been the WPAC warm pool. Would much rather take my chances getting a very strong to super El Niño as long as the storm track is close to the benchmark. Really don’t care at this point if it’s near 60° before or after the storms or how long the snow stays on the ground. Just want to see some great snowstorms again.
But as we saw in 23-24, the La Niña background combined with the very strong El Niño to pull the forcing too far west in the Pacific near the Maritime Continent. So really not sure if even a very strong El Niño can shift the marine heatwaves around which have been associated with the record WPAC warm pool.
There is very little we can do from Philly to south coastal side Boston when the Northern Stream of the Pacific Jet is so strong. With Great Lakes cutters, I-95 to I-84 huggers, and suppressed Southern Stream storm tracks. The default position becomes milder winters with below to well below normal snowfall.
Even the marginally colder winter this year was still around 40° near the coast on the days that .25 or more of precipitation fell.
Perhaps, we can score a decent MJO 8 like we last saw in January 22 in the coming winters. Even one good month can make the winter passable. But we have seen in recent winters how we haven’t been able to get a clean MJO 8 response due to the competing marine heatwaves and multiple areas of forcing.
We had a strong/super El Nino just 2 years ago and wasn't able to break it. So what you would be suggesting is a higher than 2015/16 scenario given the WPAC has still warmed during that time frame which would mean an ONI above ~2.6C probably closer to 3C consistently over several months to reset the system?
Honestly I feel that is not reasonable if 2 El Nino, as strong as what we have seen one being nearly the strongest we have physically recorded, can not cool the WPAC having a stronger one won't change that fact. I feel we need to give it time to see how this all plays out and feel it is too early to draw conclusions on something to say permanence has set in.
Im not trying to play a gotcha moment if it does in fact change up over the next few years to decade or stays exactly the same. Would rather let it play out and get better understandings versus making such claims one way or the other. It would be awfully weird to make these claims that things have changed for the worst and then we get another 5-10 year block of crushing snows again.
-
2
-
-
7 minutes ago, michsnowfreak said:
Interesting. I have heard some hedge towards cold neutral and some warm neutral. For me, either is fine because anything from weak nino to weak nina usually can produce good winters.
But since its so early, Im wondering what, if anything, we can put off the table? I remember in years past some were so hellbent for months on a strong Nino or nina but when it actually happened it was weak. So far, it seems to be nearly unanimous that a strong ENSO one way or the other isnt happening. Or at least thats the way Im reading into it haha. But what are the odds a strong or moderate event catches everyone off guard?
We would need to start seeing signs emerge if it was to tilt one way or the other more than just neutral. Nothing is catching my eye and overall as Bluewave has said it does look like things want to try to progress eastward in the tropics and switch things up a bit but the subsurface would not be super conducive to produce a weak or moderate El Nino right now if that were to actually start to show up.
I think it is important to remember that La Nina is just a further enhanced state of what base state looks like as 40/70 has mentioned it is important on location of oceanic and even atmospheric features that dictate overall how things progress. We are pushing out from the spring barrier so we should start to see some signs emerge, what they are yet is anyone's guess.
I gotta get to bed though I work tonight so ill be back on later.
-
3
-
1
-
-
2 hours ago, bluewave said:
The WPAC warm pool seems to be driving the very potent La Niña background this spring. Notice how we continue to see the Aleutian Ridge displaced further west than usual. Looks like the very strong IO into WPAC forcing wants to gradually shift east as we head into early June. Perhaps an attempt for some WWB activity which could weaken the trades a bit from the strong present levels. Whether the ENSO regions register -0.5 or +0.5 in the coming months may not matter as much as how warm the WPAC is which would drive the La Niña background even if the ENSO regions are technically neutral.
We have seen this back and forth so much recently I am not confident this holds at all but for the mean time yes we are still having a La Nina atmosphere, even while weak to non existent SST profile, still holding the helm. Slow fade into Fall to neutral/warm status and maybe even a quick flare up of Nino like conditions atmospherically. No guarantee but the way things want to try and setup it seems this is possible.
The biggest tell tale right now is the lack of WPAC typhoons should hit the record with no issue. Thoughts haven't changed in that aspect. There is no doubt though the warm pool has largely shifted now comes if it rebuilds in any meaningful way or we have another episode of end of summer/ fall push again.
2 hours ago, michsnowfreak said:So youre thinking that means we are in for an ENSO neutral winter of some sort?
Yea I guess it will technically still register ENSO neutral but with a flare to Nino style is my current thought. We really may see the battle re establish again where we see a back and forth like last year. MJO is dead so it will be interesting if we follow a similar path as last year where a weak wave started moving again come end of June into July.
-
3
-
-
On 5/15/2025 at 8:14 PM, Roger Smith said:
<<< SNOWFALL CONTEST FINAL REPORT ?? >>>
(probably our final update, will keep an eye on DEN just in case)
Table of forecasts for snowfall winter 2024-2025
... listed in order of total snowfall predicted ...
FORECASTER ______________ DCA _NYC _BOS __ ORD _DTW _BUF ___ DEN _SEA _BTV ___ TOTAL
Roger Smith ________________13.5_ 32.0_ 47.0 ___ 50.6_ 52.2_ 130.0 ___ 89.0_ 1.5_109.3 ___ 525.1
wxdude64 _________________ 18.8_ 36.2_ 44.3 ___ 37.8_ 41.3_ 122.9 ___ 71.2_ 7.4 _102.7 ___ 482.6
Tom ________________________26.2_ 38.1_ 42.4 ___ 37.6_ 42.3_ 102.6 ___ 57.7_ 6.4__83.4 ___ 436.7
___ Normal 1991-2020 _____13.7_ 29.8_ 49.2 ___ 38.4 _45.0__95.4 ___49.0_ 6.3_87.5 ___ 414.3
BKViking ___________________12.0_ 27.0_ 44.0 ___ 30.0_ 28.0 __ 98.0 ___ 55.0_14.0_ 100.0___ 408.0
RodneyS ____________________5.8_ 22.0_ 38.5 ___ 42.5_ 45.0__ 99.0 ___ 58.0_ 9.5__85.0 ___ 405.3
___ Consensus ____________14.8_ 23.6_ 34.8 __ 35.0_ 36.7 _ 104.2 __57.4 _ 5.8 _91.7 ___ 404.0
RJay _______________________ 4.0_ 12.0 _ 50.0 ___ 29.0_ 35.0_ 100.0 ___ 60.0_ 6.0_ 100.0 ___ 396.0
Scotty Lightning ___________20.0_ 25.0_ 30.0___ 35.0_ 30.0_ 106.0 ___ 45.0 _ 3.0_ 100.0 ___ 394.0
wxallannj __________________25.0_ 30.0_ 34.0 ___32.0_ 35.0__ 94.0 ___ 40.0_ 4.0__ 88.0 ___ 382.0
Don Sutherland1 ___________ 8.0_ 16.5_ 35.0 ___ 40.0_ 45.0__ 95.0 ___ 55.0_ 8.0__ 75.0 ___ 377.5
hudsonvalley21 ____________17.0_ 21.0_ 28.0 ___ 26.0_ 24.0_ 102.0 ___ 51.0 _ 4.0__ 84.0 ___ 357.0
so_whats_happening ______13.0_ 19.0_ 35.0 ___ 29.0_ 31.0__ 98.0 ___ 39.0 _ 3.0__ 81.0 ___ 348.0
___________________________
Persistence (2023-2024) ___ 8.0__ 7.5__ 9.8 ___ 22.2_ 23.5__ 71.3 ___ 44.6_ 0.3__ 60.8 ___ 248.0
____________________
To date _____ (May 15) _______ 14.9__12.9 _28.1 ___17.6 _28.7__ 77.2 ___ 47.7 __2.3 __75.7 ____305.1
(contest incl all seasonal snow)
__Scoring update (in order)__
_ underlined errors are forecasts lower than actual ... rest are forecasts higher than actual to date _
Rank _FORECASTER _____________ DCA_NYC_BOS __ ORD_DTW_BUF ___ DEN_SEA_BTV ___ TOTAL
_01__hudsonvalley21 ___________ 2.1 _ 8.1 __ 0.1 _____ 8.4 __ 4.7 __ 24.8 ____ 3.3 _ 1.7 __ 8.3 ___ 61.5
_02 __so_whats_happening ______ 1.9 _ 6.1 __ 6.9 ____ 11.4 __ 2.3 __20.8 ____8.7 _ 0.7 __ 5.3 ___ 64.1
(02.1)_Persistence (2023-2024)__6.9__ 5.4__18.3 ___ 4.6 __ 5.2 ____5.9 ____ 3.1 _2.0 _ 14.9 ___ 66.3
_03 __Don Sutherland1 ___________ 6.9 _ 3.6 __6.9 ___ 22.4 _ 16.3 __ 17.8 ____7.3 _ 5.7 __ 0.7 ___ 87.6
_04 __wxallannj __________________ 10.1_ 17.1 __ 5.9 ___ 14.4 __ 6.3 __ 16.8 ____7.7 _ 1.7 __ 12.3 ___ 92.3
_05 __Scotty Lightning ___________ 5.1 _ 12.1 __ 1.9 ___ 17.4 __ 1.3 __ 28.8 ____ 2.7 _0.7 _ 24.3 ___ 94.3
(5.3)___ Consensus ____________ 0.1 _ 10.7 _ 6.7 ___ 17.4 __8.0 __27.0 ____ 9.7 _ 3.5 _16.0 __ 99.1
_06 __BKViking ___________________ 2.9_ 14.1 _ 15.9 ___ 12.4 __ 0.7 __ 20.8 ___ 7.3 _11.7 __24.3 ___ 110.1
(6.2)___ Normal 1991-2020 ____ 1.2 _ 16.9_ 21.1 ___ 20.8 _ 16.3 __16.5 ___ 3.0_ 4.0__11.8 ___ 111.6
_07 __RJay _______________________10.9 _ 0.9 _21.9 ___ 11.4 __ 6.3 __ 22.8 ___ 12.3_ 3.7 _ 24.3 ___ 114.5
_08 __RodneyS ____________________9.1 _ 9.1 _ 10.4 ___ 24.9 _ 16.3 __ 21.8 ____8.6 _ 7.2 __ 8.9 ___ 118.4
_09 __Tom ________________________11.3_ 25.2_ 14.3 ___ 20.0 _ 13.6 _ 25.4 ___ 10.0 _ 4.1 __ 7.7 ___ 131.6
_10 __wxdude64 _________________ 3.9_ 23.3_ 16.2 ___ 20.2 _ 12.6 _ 45.7 ___23.5 _ 5.1 _27.0 ___ 177.5
_11 __Roger Smith ________________ 1.4_ 19.1 _ 18.9 ___ 33.0 _ 23.5 _ 51.1 ___ 43.0_ 0.8_ 33.6 ___ 224.4
(will post final comments at end of May)
Oh man that was close. Congrats @hudsonvalley21
As always thanks Roger!
-
2
-
-
Anyway here is the last month and a half of TAO data showing the increase in OHC GAWX just showed. This should still maintain a Nina-like atmosphere through at least most of the summer would not be surprised if we start to see some flare ups of Nino-like progression into Fall just not enough to flip the script.
.thumb.gif.d4fe30e8eef26478d2ae8a13fb9118c3.gif)
-
3
-
2
-
.gif.110af1123d5624989530b0e860e288f1.gif)
.gif.afb8fc82838dad7742c3da096b410c0d.gif)
2025-2026 ENSO
in Weather Forecasting and Discussion
Posted
Just hope we can keep it going.