frontranger8
-
Posts
398 -
Joined
-
Last visited
Content Type
Profiles
Blogs
Forums
American Weather
Media Demo
Store
Gallery
Everything posted by frontranger8
-
2026-2027 Record-breaking El Nino
frontranger8 replied to Stormchaserchuck1's topic in Weather Forecasting and Discussion
You're missing the main point. Wasn't about absolute temps, but instead warming relative to forecasts. -
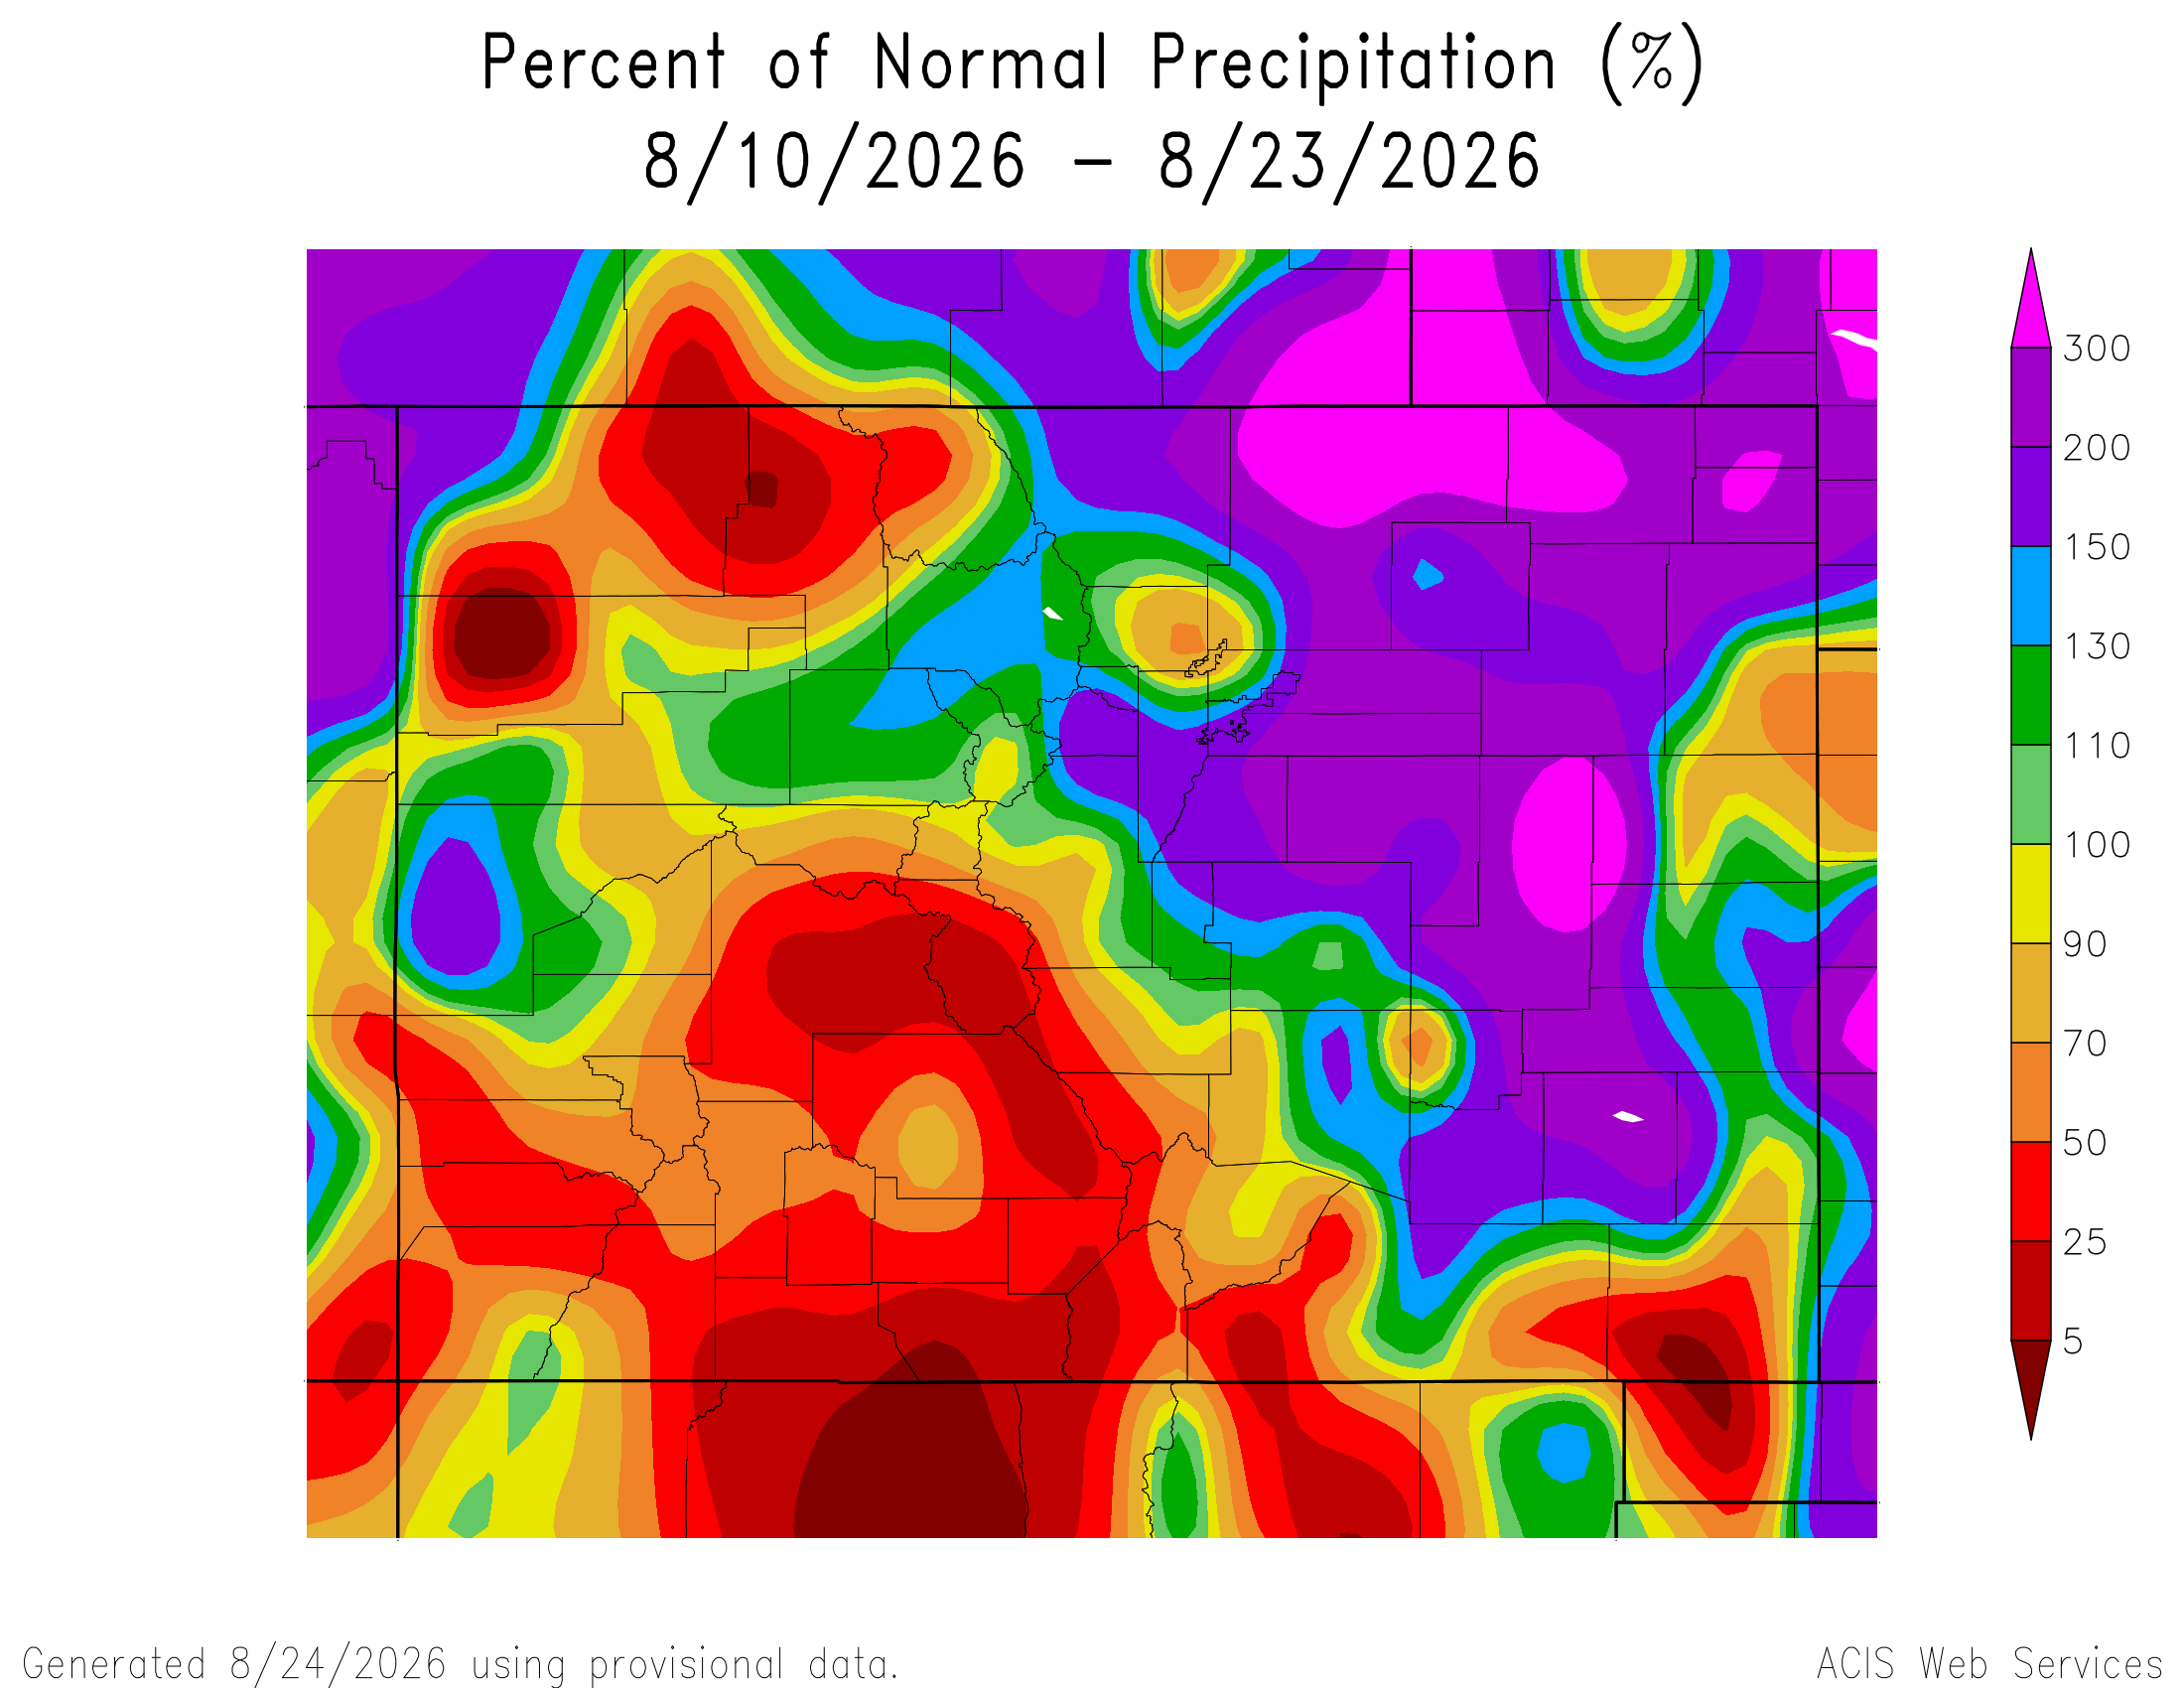
Finished with 2.98" here. Only 1.59" at DEN, definitely a month where they did not represent greater Denver metro well.
-
I am a prophet.
-
Just got nailed by a storm, almost half an inch. Up to 2.6" on the month.
-
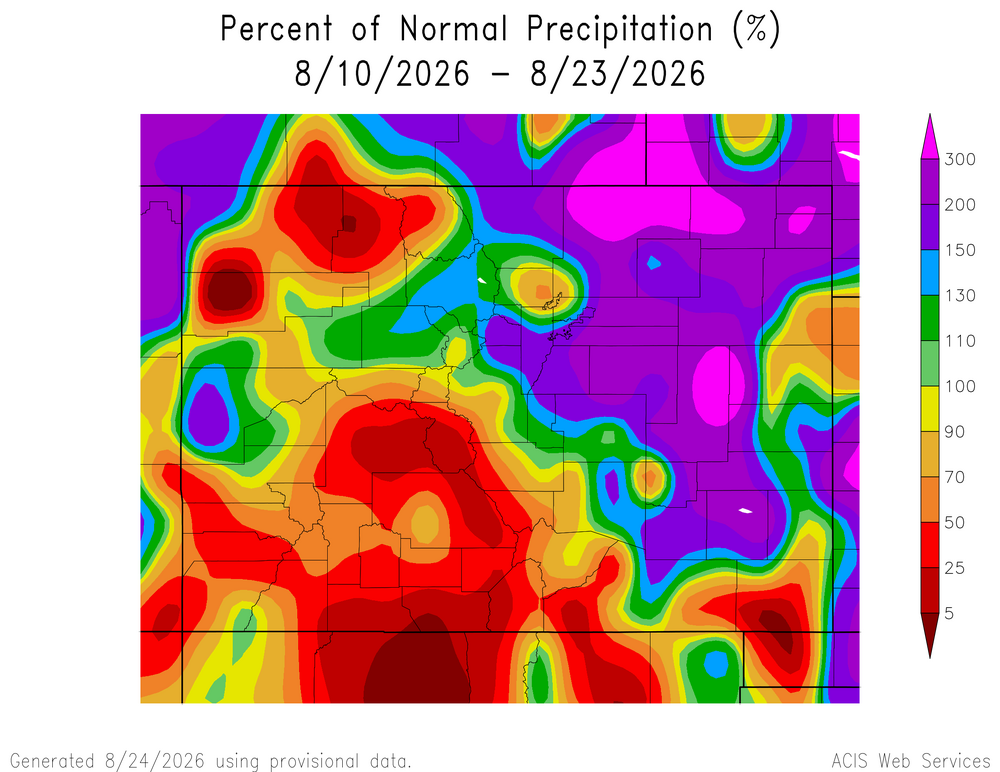
Pretty good stretch for the Front Range overall. That small area of below normal precip is likely just missing data.
-
.89" for the week here. .71" for DEN.
-
Looks like the answer is yes. Another big storm about to hit your area.
-
First legit rainy day in forever here. Rained basically non stop for 5 hours.
-
Nice. Got about a half inch here.
-
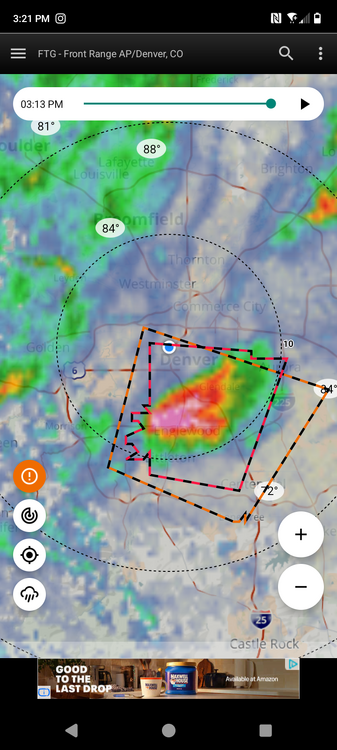
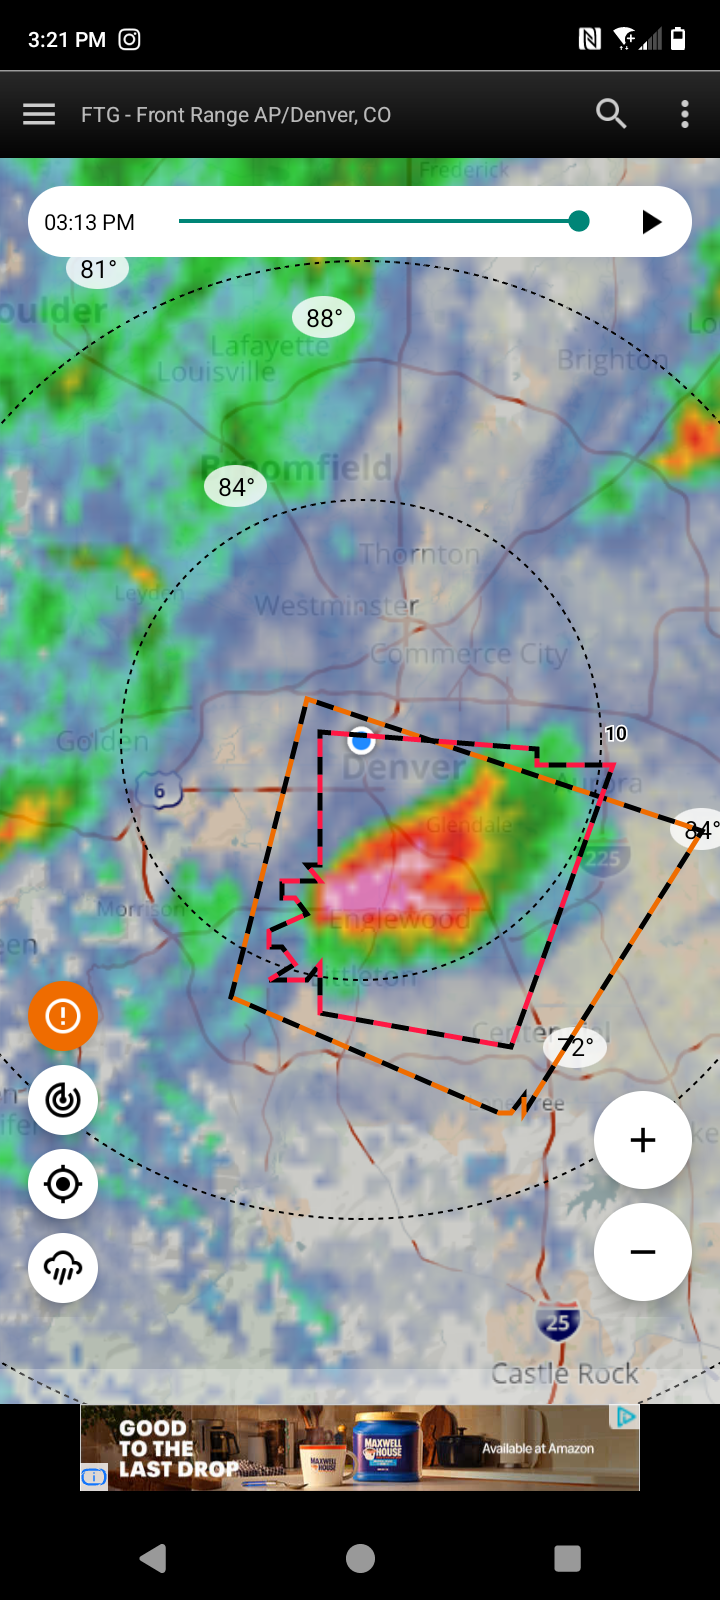
Helluva storm over Englewood, moving north right towards downtown.
-
I got .15" yesterday, heavy stuff missed to the south and east.
-
DEN has yet to record measurable rainfall in August, after July finished well below normal. Definitely due for a couple soakers.
-
About time.
-
2012 barely beat out 2026 here. But 2026 set the record for most 90+ days with 28.
-
First 40s since 6/14 here this am.
-
Was just about to post...what a difference a day makes. Yesterday at this time we were at 98. Today, 68. So refreshing. Too bad there's so much smoke around.
-
Got smacked yesterday evening with a direct hit from a storm that was severe warned shortly after. Thankfully not much hail, but a 30 minute deluge that dropped .57". Great way to end the month.
-
Parker to Palmer divide is getting crushed. Not much happening here.
-
Picked up about .10" here today. Looks like some of the heavier storms in the area dropped at least half an inch.
-
Tomorrow looks more promising for widespread showers/storms.
-
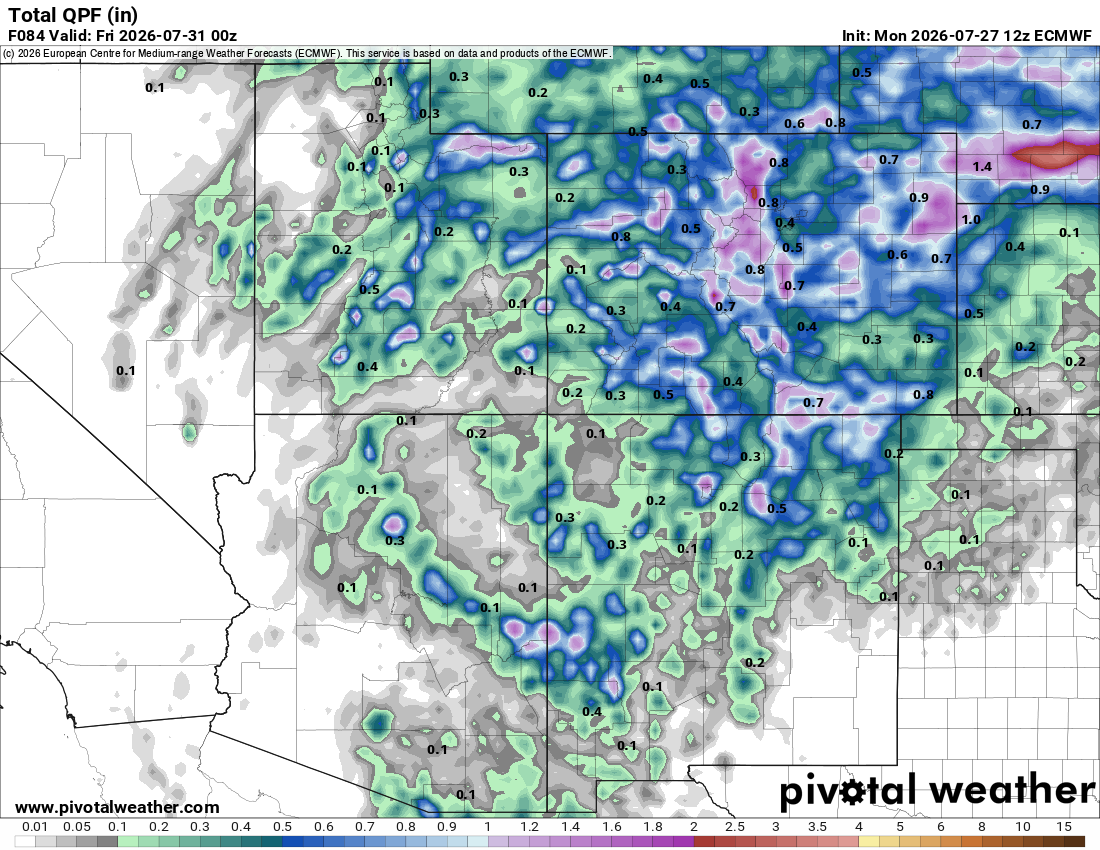
Long term, Denver averages 2" in July and 1.7" in August. So I'd say for this area anyway, on average it peaks second half of July and is often basically over by second half of August. That being said, there have been many times where August has been much wetter than July (2022 is the only real recent example, but quite a few further back). We are badly due for a very wet August for the region...the last one was 2008. Of course, we had the wettest September and month ever in 2013, which was due to unusually late monsoonal activity.
-
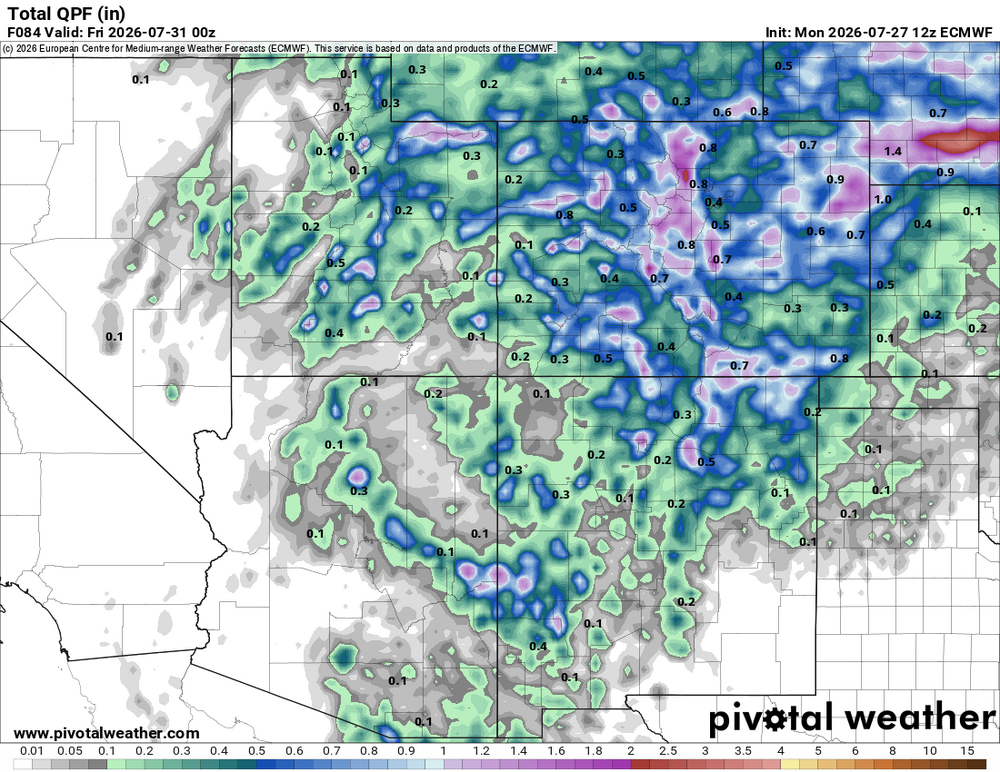
Wouldn't get your hopes up too much. Looks like pretty standard fare for this time of year, definitely nothing crazy.
.thumb.png.36c7e5925a5af3eac6fe6c824b80beea.png)
-
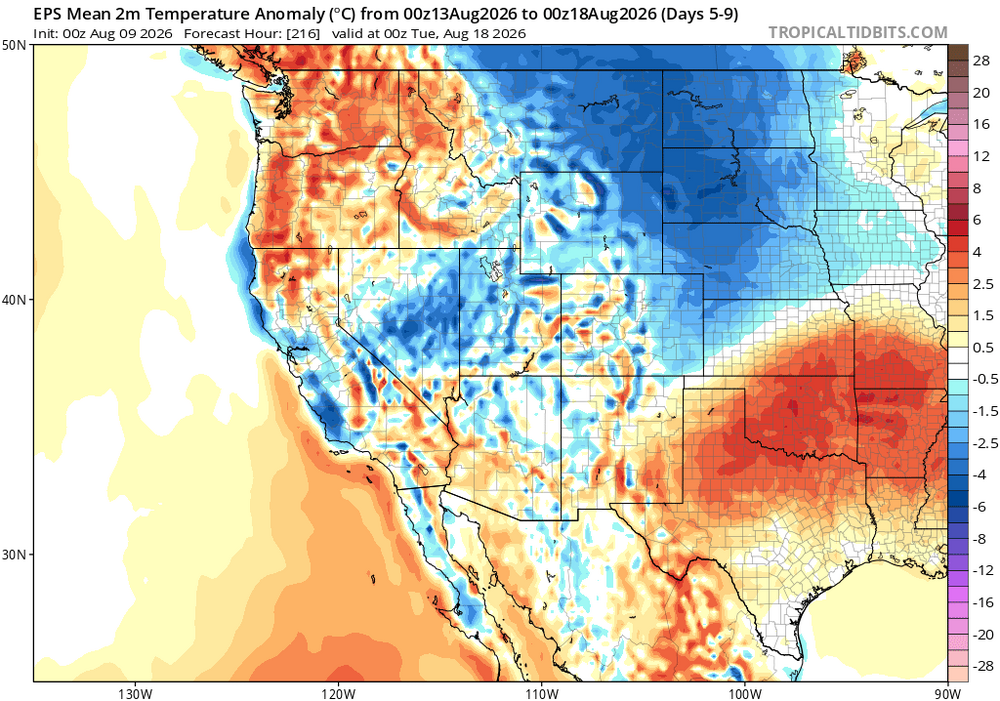
DEN hit 103. Two days ago Greeley hit 107. For DEN, it was the hottest temp since 2018. It was the 15th time on record Denver has hit 103 or hotter. At Greeley, it was the hottest temp since 2006, and only the sixth time in their history.
-
Yeah, pretty much anywhere north of downtown did pretty well. DEN picked up over half an inch, about in line with what models were showing a few days out.
-
Damn, DEN is at .70" for the month. .92" in my backyard.


.png.1067e63529422c9819bd011f1c6a2929.png)