
acoolerclimate
-
Posts
41 -
Joined
-
Last visited
Content Type
Profiles
Blogs
Forums
American Weather
Media Demo
Store
Gallery
Everything posted by acoolerclimate
-
Interesting. I live in North Providence, Rhode Island, and just down the road there is a house with Palm Trees in the front!! I can't wait to see what happens to them in the winter, but scary they are growing here at all.
-
Upstate/Eastern New York
acoolerclimate replied to BuffaloWeather's topic in Upstate New York/Pennsylvania
I thought I'd do an unscientific study of the departure from normal over the last 2 1/2 years for locations found in the Local Climatological Data section of the NWS Websites. I'm using the unedited data that is showing there. Here are the departures from normal based on those pages for the following stations: If I'd hazard a guess, I'd say someone thought maybe Albany was reading too warm, so they tried to fix it, but they went too far. The problem starts in Aug of 2020, about a year ago, just like TugHillMatt said. It also appears as though Syracuse is reading too warm this year, while Binghampton was a bit on the cool side in 2019 and 2020. 2019. Jan. Feb. Mar. Apr May. Jun. Jul. Aug. Sep. Oct. Nov. Dec. Average Albany 0.7. 1.7. 0.1. 2.0. 0.2. 0.8. 4.4. 1.6. 1.9. 3.9. -3.0. 1.3 1.2 Poughkeepsie 1.9 2.3. .0. 2.4. 1.1. 0.1. 3.8. 0.9. 1.6. 3.6. -4.3 0.2. 1.1 Glens Falls 1.7. 1.0. -0.5. 0.7. 0.4. .0. 3.5. .0. 0.5. 2.9. -4.6. 0.5. 0.5 Bennington. -0.5 1.9. -1.2. 1.3. 0.3. -0.3. 2.8. 0.6. 0.3. 2.9. -4.8. 0.5. 0.3 Pittsfield. 0.6. 2.2. -0.1. 2.3. 0.9. 0.7. 4.3. 1.2. 1.8. 3.6. -3.8. 1.5. 1.3 Binghampton. -1.9. 1.1. -2.1. 1.5. -0.1. -1.2. 3.0. -0.6. 1.4. 2.3. -5.5. 0.5. -0.1 Burlington -1.5. 0.7. -0.6. 0.7. -1.4. 0.2. 4.3. 1.4. 1.5. 4.0. -5.2. 1.6. 0.5 Syracuse -2.2. 0.7. -1.8. 1.2. -0.6. -0.7. 3.5. -0.1. 1.9. 2.9. -4.6. 1.1. 0.1 2020. Jan. Feb. Mar. Apr May. Jun. Jul. Aug. Sep. Oct. Nov. Dec. Average Albany 9.2. 5.6. 7.3. -1.2. 1.5. 3.6. 4.1. -1.3. -2.2. -0.8. 1.3. 1.4. 2.4 Poughkeepsie. 7.5 6.0. 6.1. -2.8. -0.7. 2.5. 5.2. 3.0. 1.1. 2.6. 4.2. 2.1. 3.1 Glens Falls. 7.8. 2.5. 5.4. -2.0. 0.4. 1.3. 4.1. 0.9. -0.4. 1.7. 3.2. 2.6. 2.3 Bennington. 7.8. 3.0. 5.3. -2.3. 0.9. 1.9. 4.5. 1.8. 1.2. 2.5. 4.4. 2.9. 2.8 Pittsfield 9.0. 5.1. 6.2. -1.6. 0.4. 2.8. 5.8. 2.2. 2.1. 2.8. 4.8. 3.9. 3.6 Binghampton. 6.2. 3.2. 5.3. -4.1. -0.7. 0.8. 4.4. 2.0. 0.5. 1.2. 4.5. 1.8. 2.0 Burlington 7.4. 3.3. 6.3. -1.4. 1.6. 3.1. 6.2. 2.2. 1.6. 2.0. 5.1. 5.5. 3.6 Syracuse 7.4. 2.6 6.1. -2.5. -0.8. 2.6. 5.8. 3.2. 1.8. 1.3. 5.0. 4.4. 3.1 2021. Jan. Feb. Mar. Apr May. Jun. Average Albany. 0.7. -2.2. 1.4. -1.1. -4.0. -0.2. -0.9 Poughkeepsie 3.4. -1.4. 4.2. 2.1. -0.8. 2.7. 1.7 Glens Falls. 4.1. 0.4. 2.8. 1.2. -0.7. 2.9. 1.8 Bennington. 2.4. -1.0. 2.7. 2.0. -0.5. 3.3. 1.5 Pittsfield. 3.5. 0.1. 3.0. 1.9. -0.6. 3.3. 1.9 Binghampton. 2.2. -1.5. 3.0. 0.2. -1.1. 3.4. 1.0 Burlington. 2.1. -1.1. 2.8. 2.4. 0.5. 4.3. 1.8 Syracuse 3.6. -0.8. 4.4. 2.3. 0.8. 5.5. 2.6 -
Upstate/Eastern New York
acoolerclimate replied to BuffaloWeather's topic in Upstate New York/Pennsylvania
Yes, you would think the Met's there would have noticed they were consistently reading colder, but I'm guessing no one has the time to compare Albany with the other stations. I have a friend who works at the office in Columbia, SC. I'm going to ask him if the staff every notices things like that. -
Upstate/Eastern New York
acoolerclimate replied to BuffaloWeather's topic in Upstate New York/Pennsylvania
I knew I wasn't crazy. I lived in Albany from 2001 to 2008. My own temps weren't that different from surrounding areas back then. -
Upstate/Eastern New York
acoolerclimate replied to BuffaloWeather's topic in Upstate New York/Pennsylvania
Speaking of instrument error, has anyone else noticed that Albany, NY has been reading quite low recently? I've noticed they seem to always be below normal for the month, even though all the stations around them are above normal. -
Hello, I live in Nutley, NJ, which is about 8 miles north of Newark Airport. I have a TempestWX weather station. I compared my 90 degree days this year to Newark's. I've had 9. I missed two of Newark's 90 days in May, and 2 in June. Usually I'm only a degree or 2 colder than Newark, but occasionally I'm 1 degree warmer. Most of the differences of those 4 were Newark was 90 or 91 and I was 88 or 89. But one day does stand out. May 22nd was 96 in Newark, but I was only 89. I don't have any other temp days with that big a difference. Something happened that day.
-
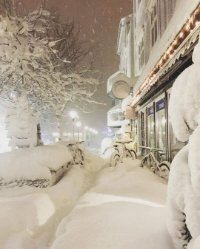
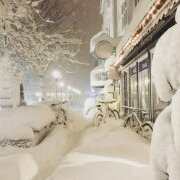
I measured 16 inches here in Nutley. I'd love to get 4 more inches overnight through tomorrow to make it to 20. Photo taken about 5:30 pm.

- 1,932 replies
-
- 4
-

-

-
- heavy snow
- wind damage
- (and 1 more)
-
11 inches here in Nutley, NJ at noon.
