RIC Airport
-
Posts
2,586 -
Joined
-
Last visited
Content Type
Profiles
Blogs
Forums
American Weather
Media Demo
Store
Gallery
Everything posted by RIC Airport
-
Richmond Metro/Hampton Roads Area Discussion
RIC Airport replied to RIC Airport's topic in Mid Atlantic
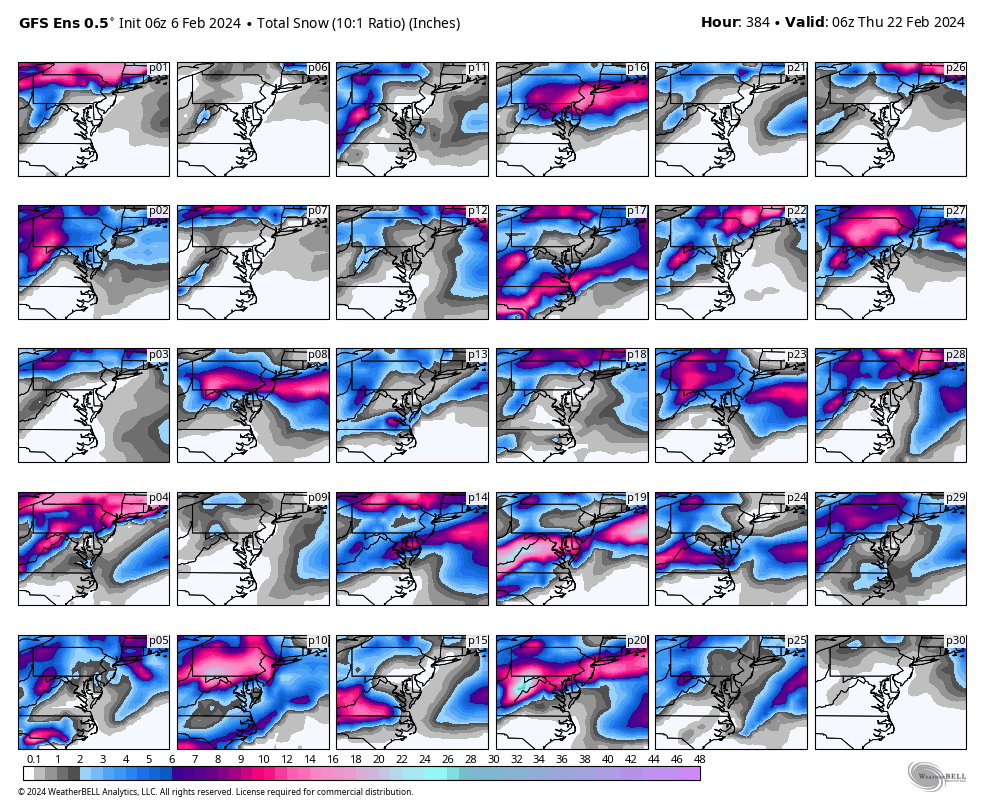
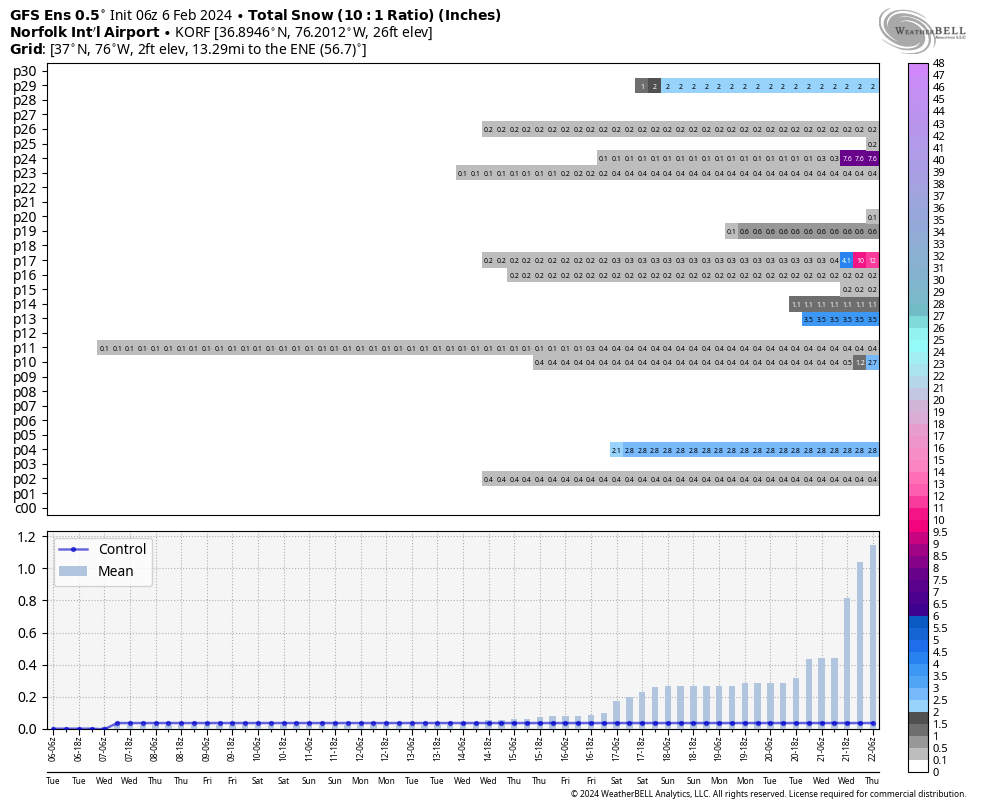
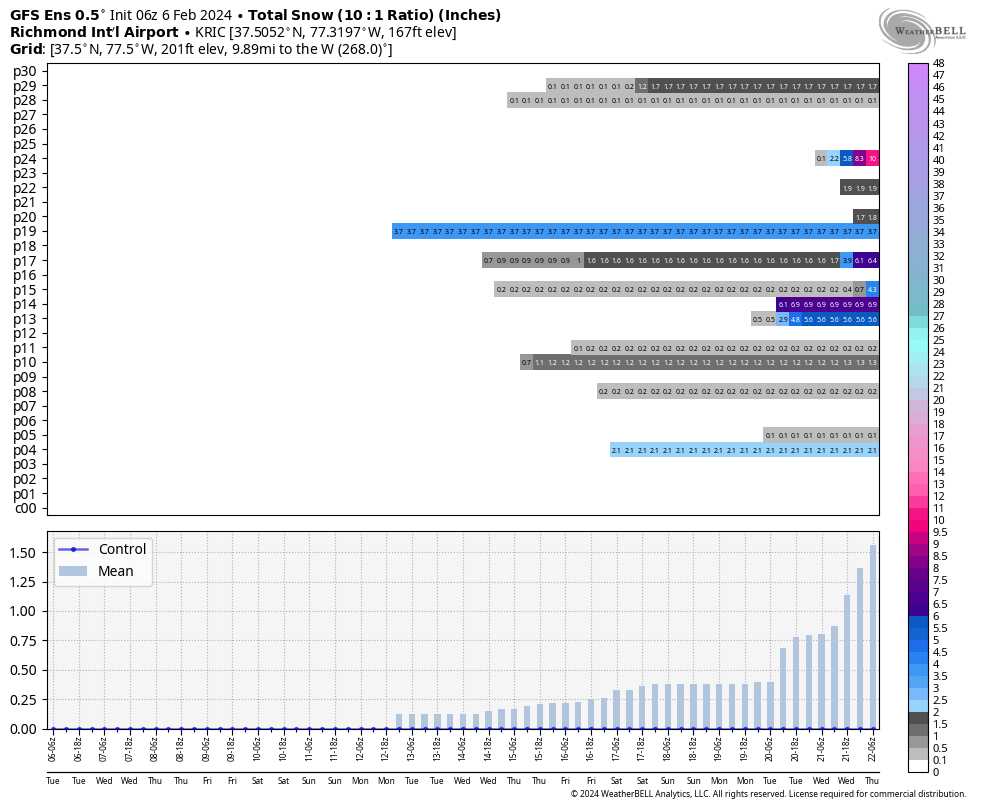
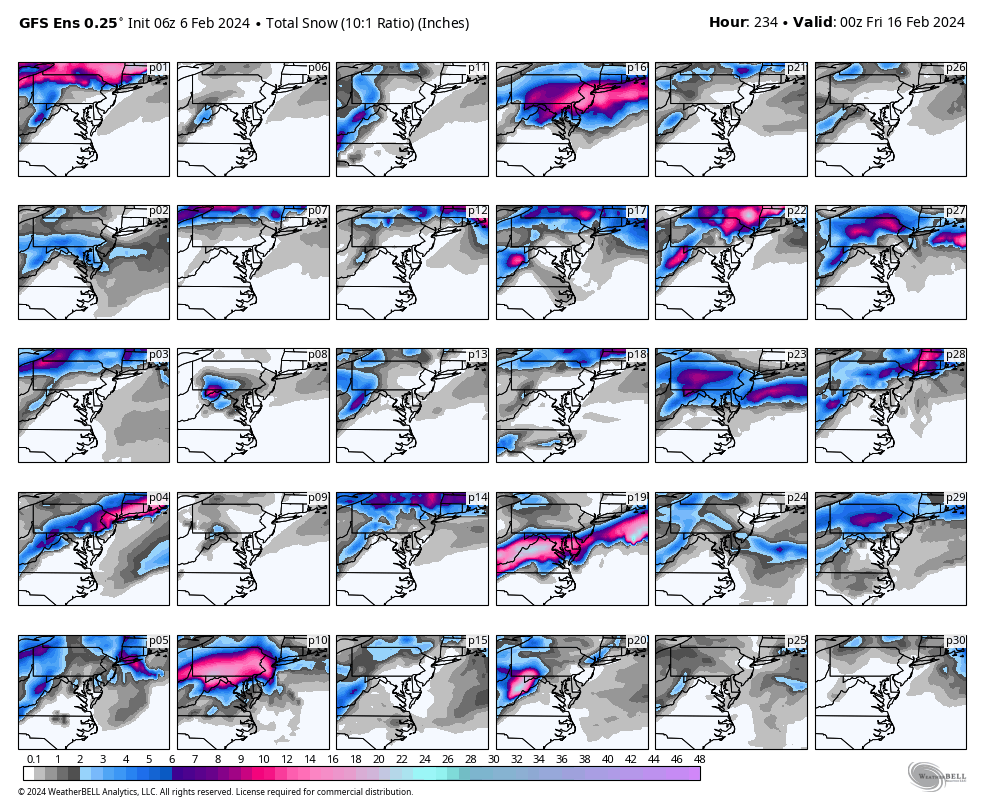
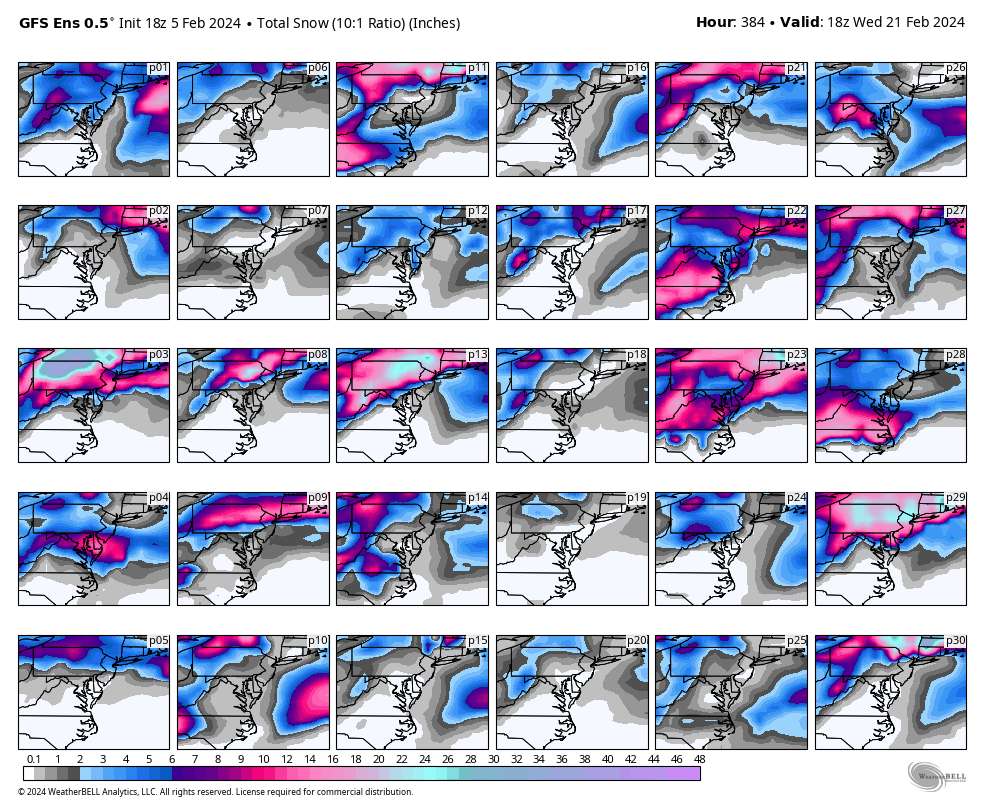
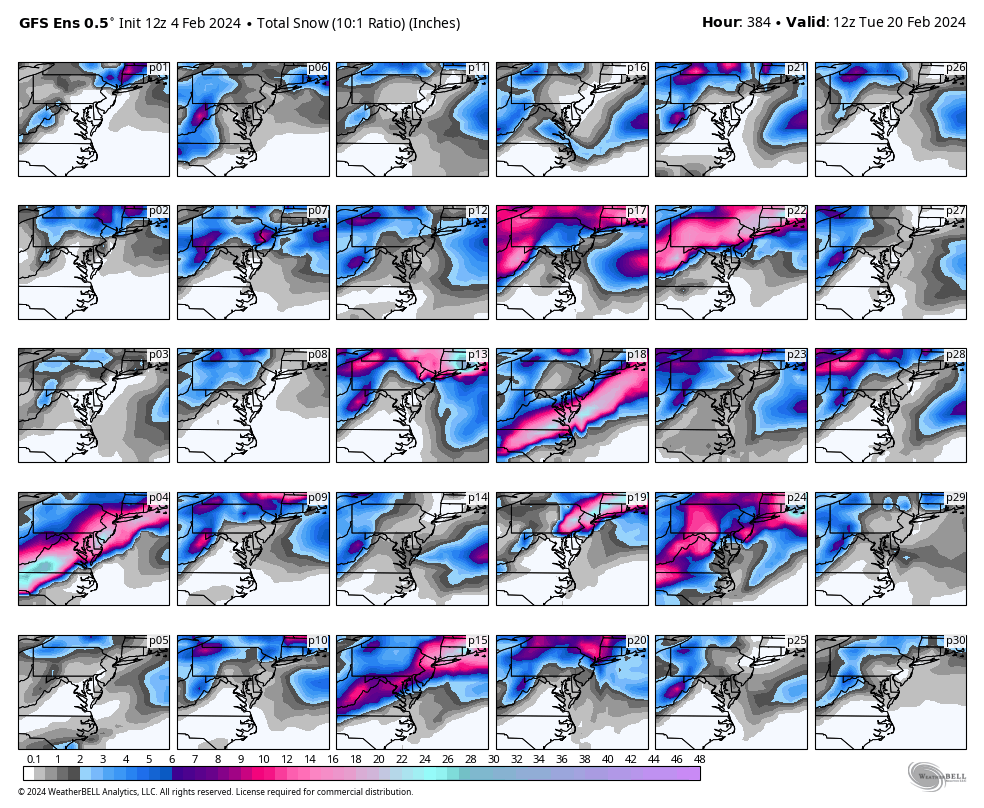
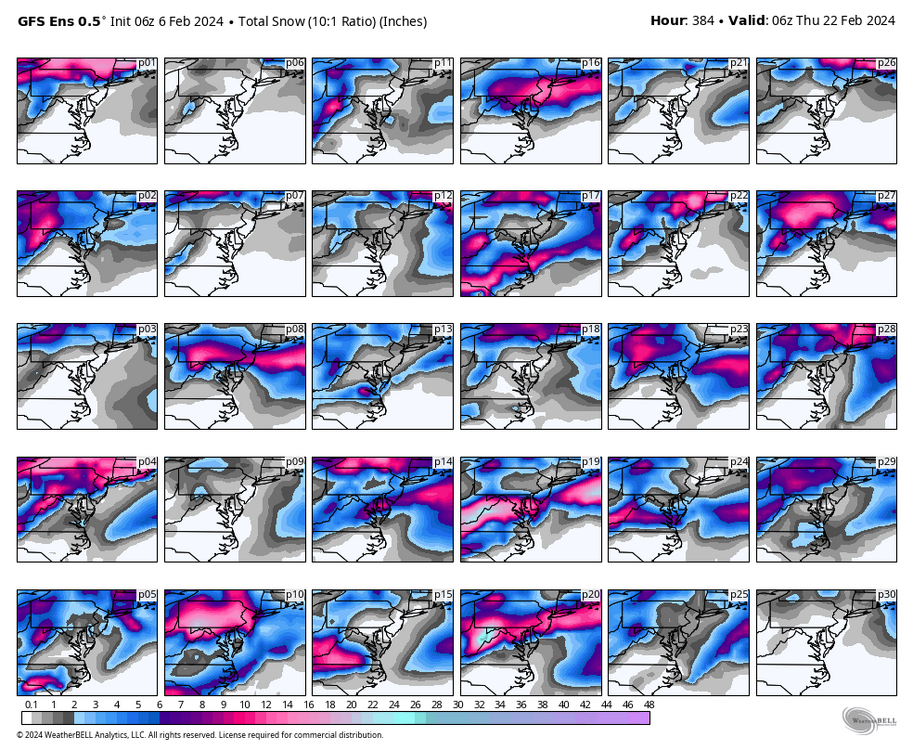
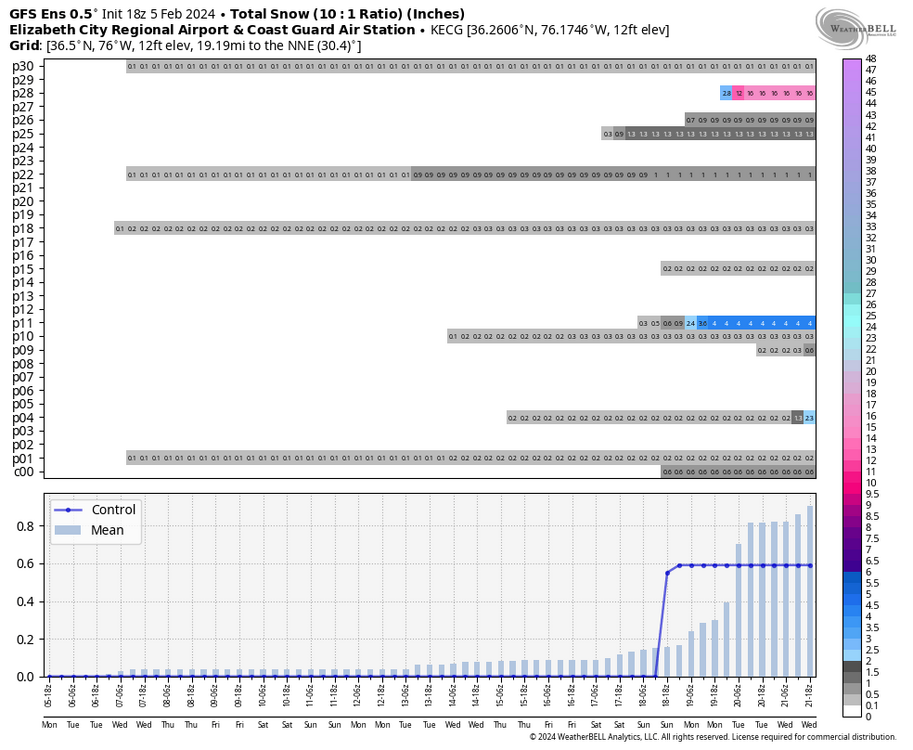
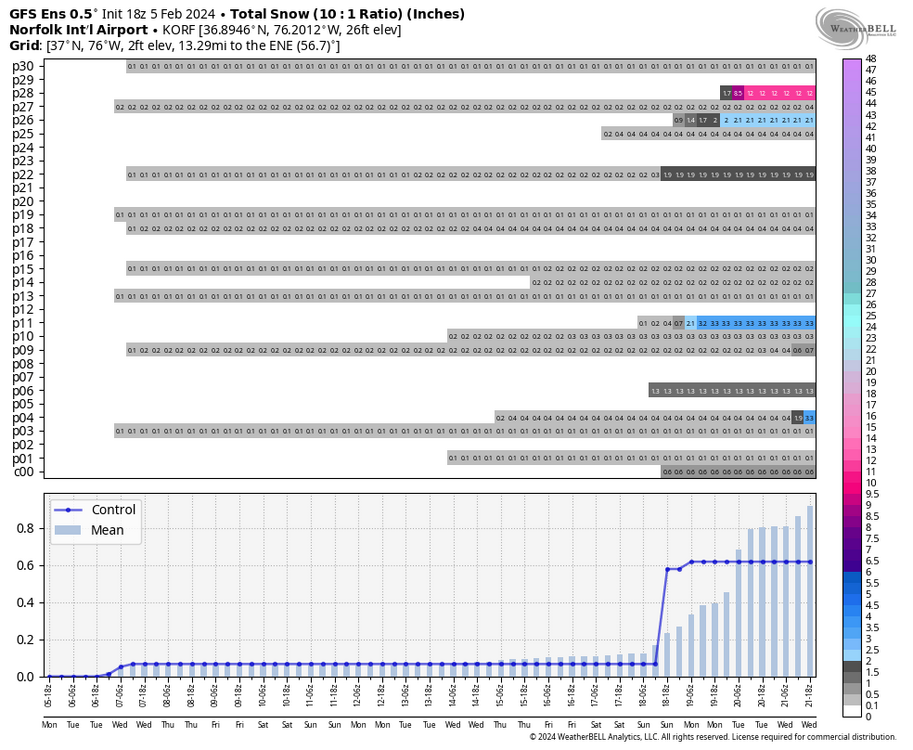
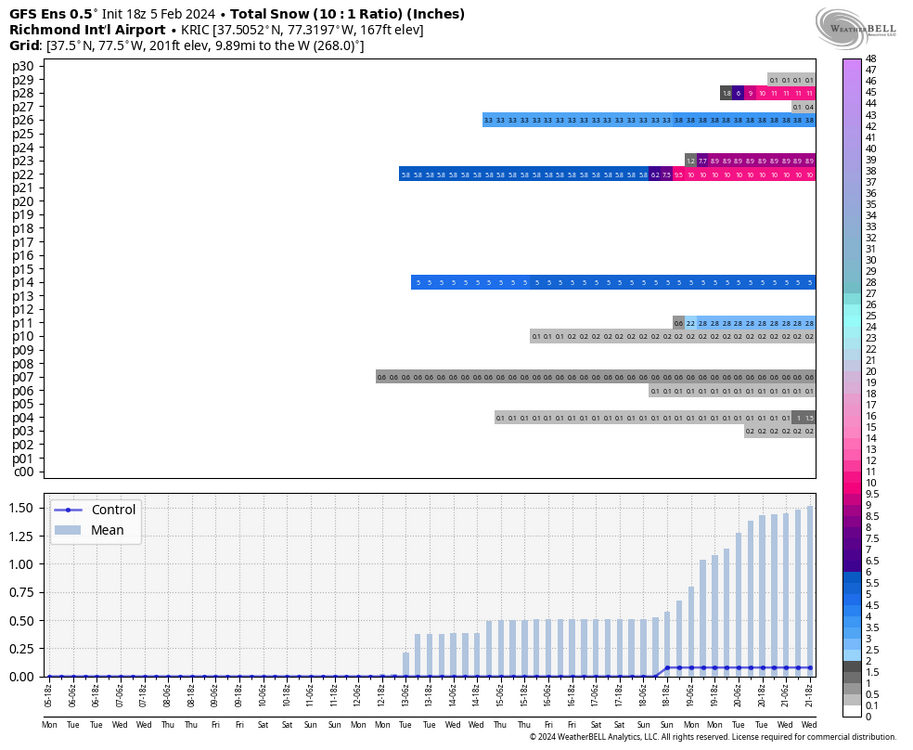
So, looking at the rest of the 6z GEFS run, I start this loop at 00z Monday, 2/19, and it ends at 6z Thursday, 2/22. Notice a handful of hits, especially around the 21st to the 22nd. But you can also see some rainy members and shut outs. The map below is the entire 6z GEFS run. Notice how much more snow is on some of the members because of the hits later in the period.
-
Richmond Metro/Hampton Roads Area Discussion
RIC Airport replied to RIC Airport's topic in Mid Atlantic
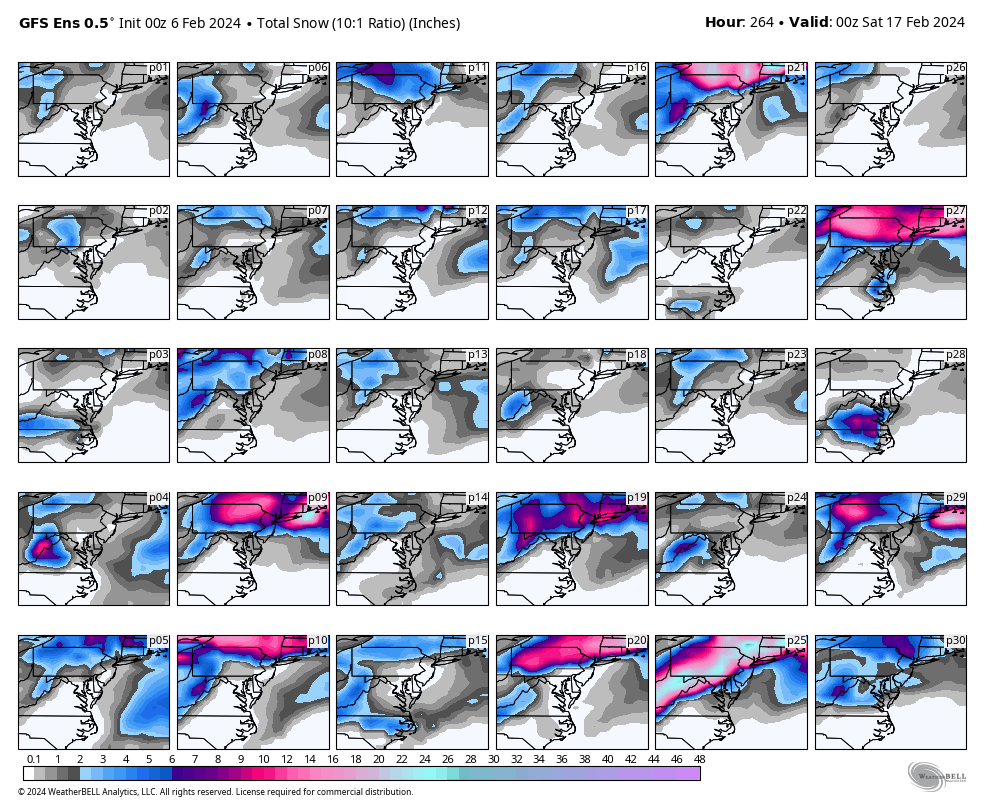
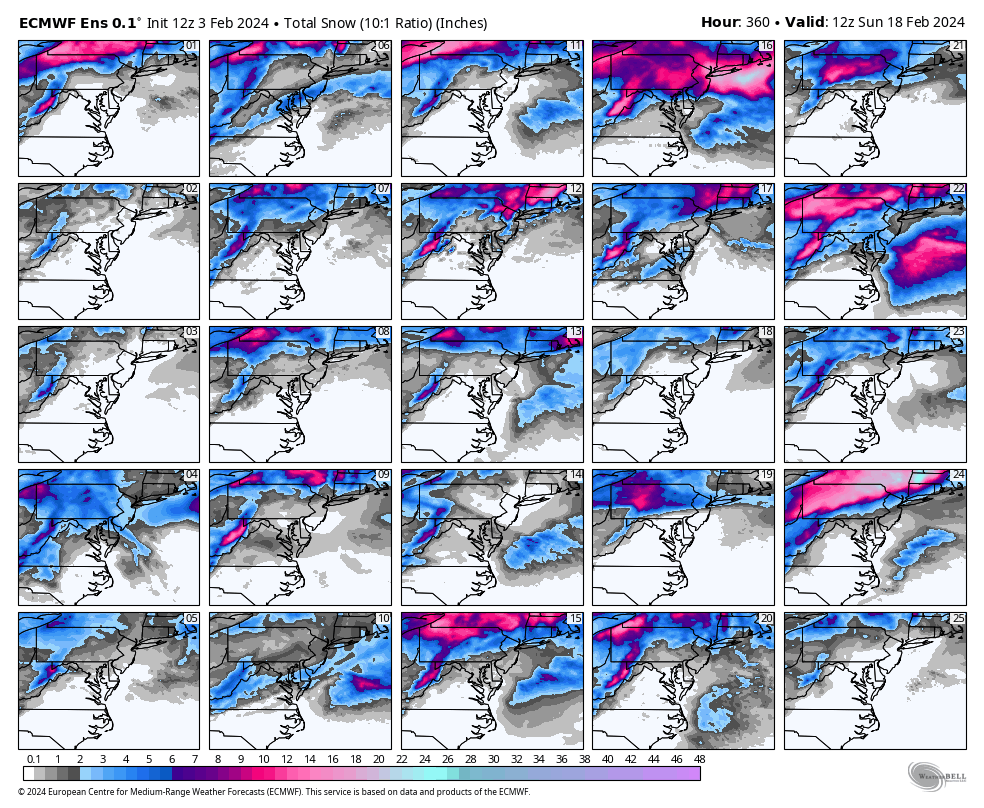
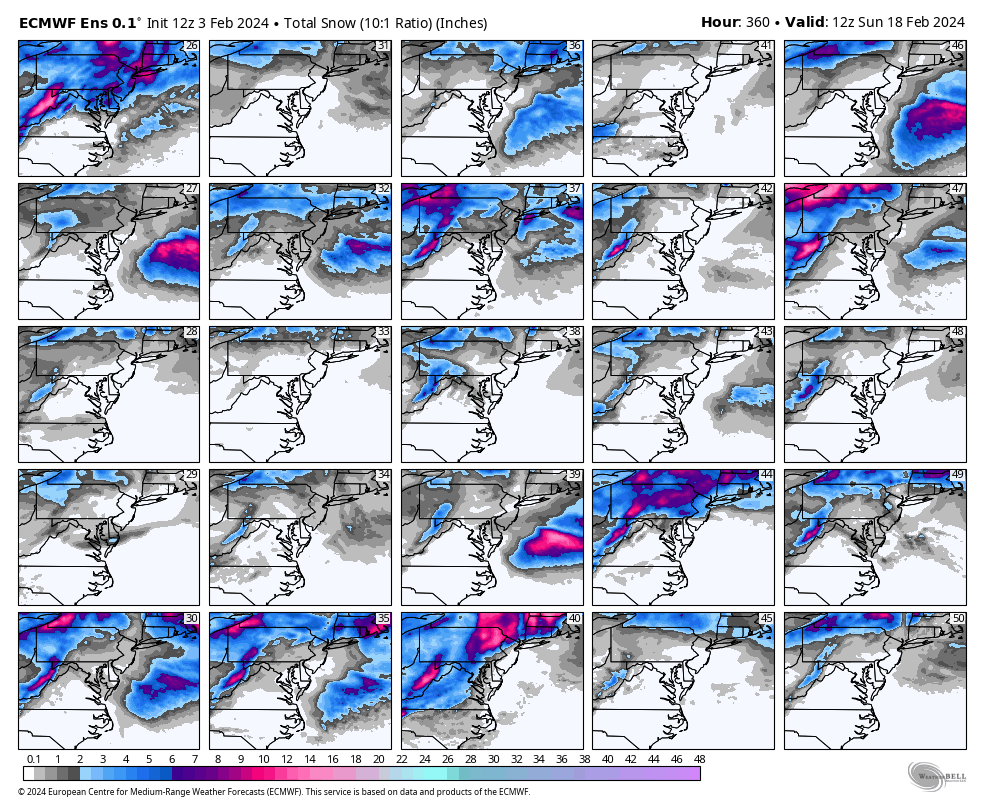
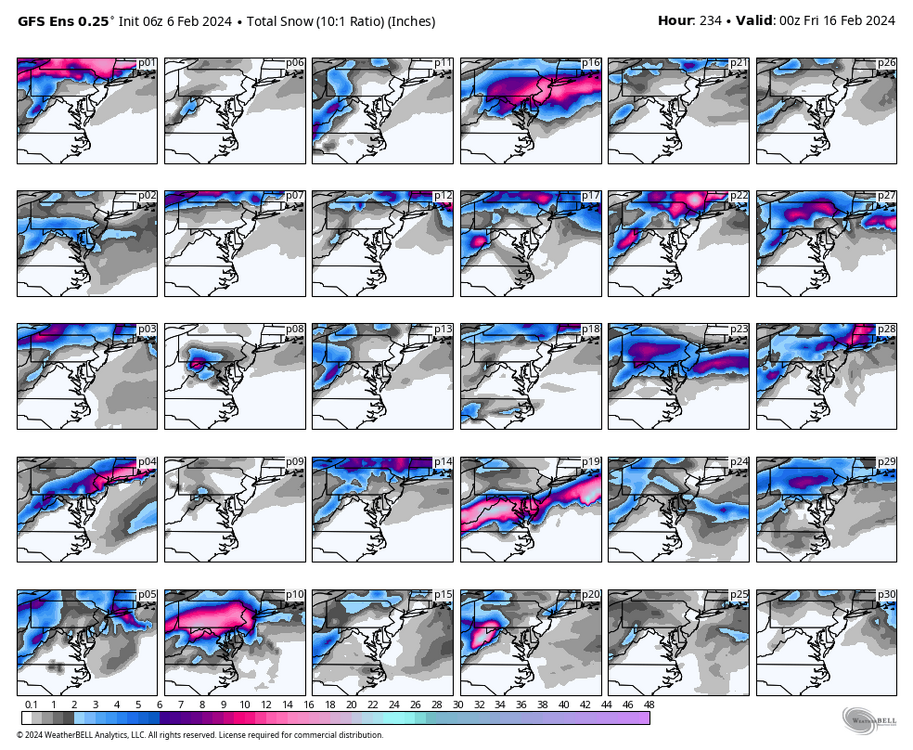
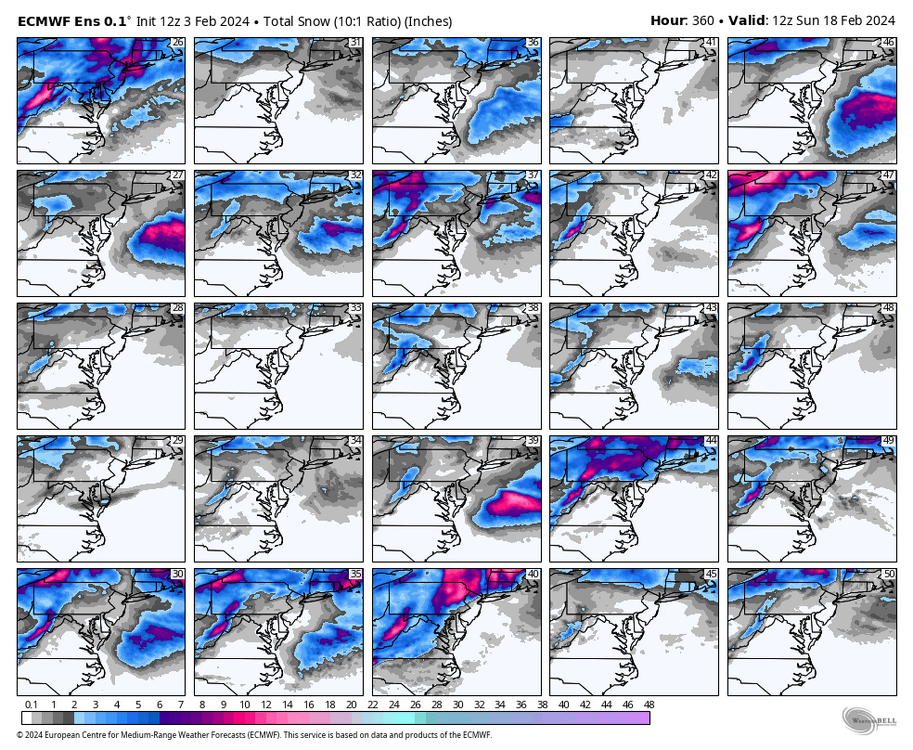
FWIW, the 6z ensembles, only 2 or 3 members seem to like the snow idea, even for NoVa/DMV. The 1st map shows a loop starting 00z Saturday 2/10 to 00z Friday 2/16, and notice how only p10, p16, and p19 are the closest to what the 00z GFS showed.
-
Richmond Metro/Hampton Roads Area Discussion
RIC Airport replied to RIC Airport's topic in Mid Atlantic
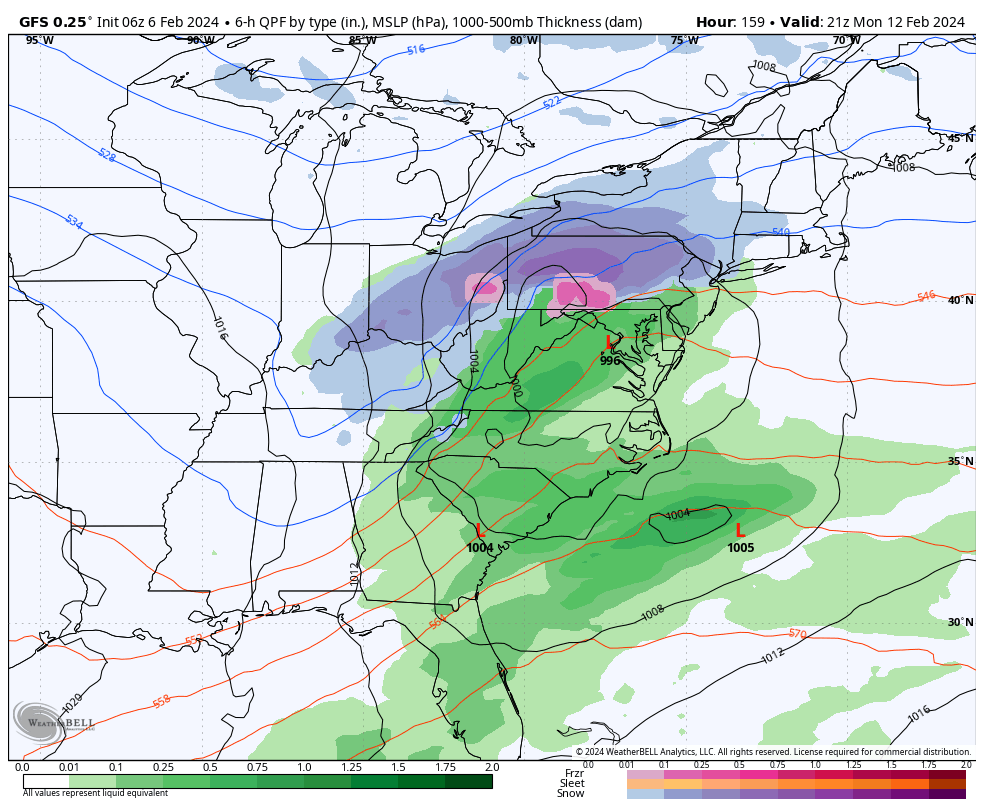
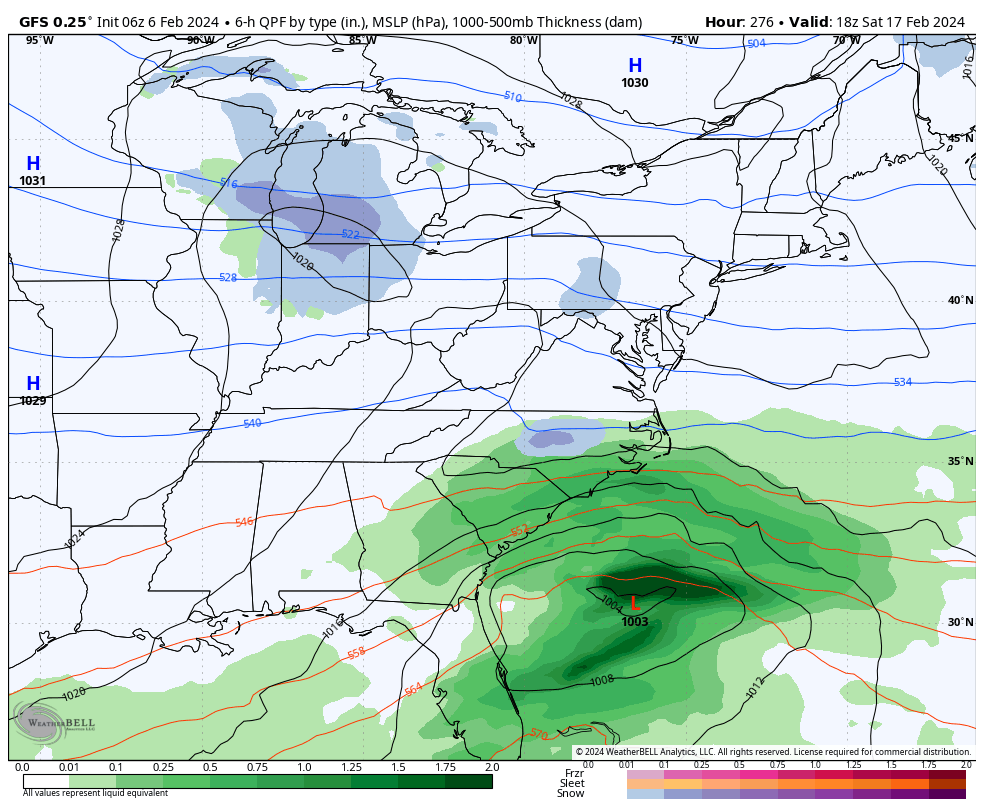
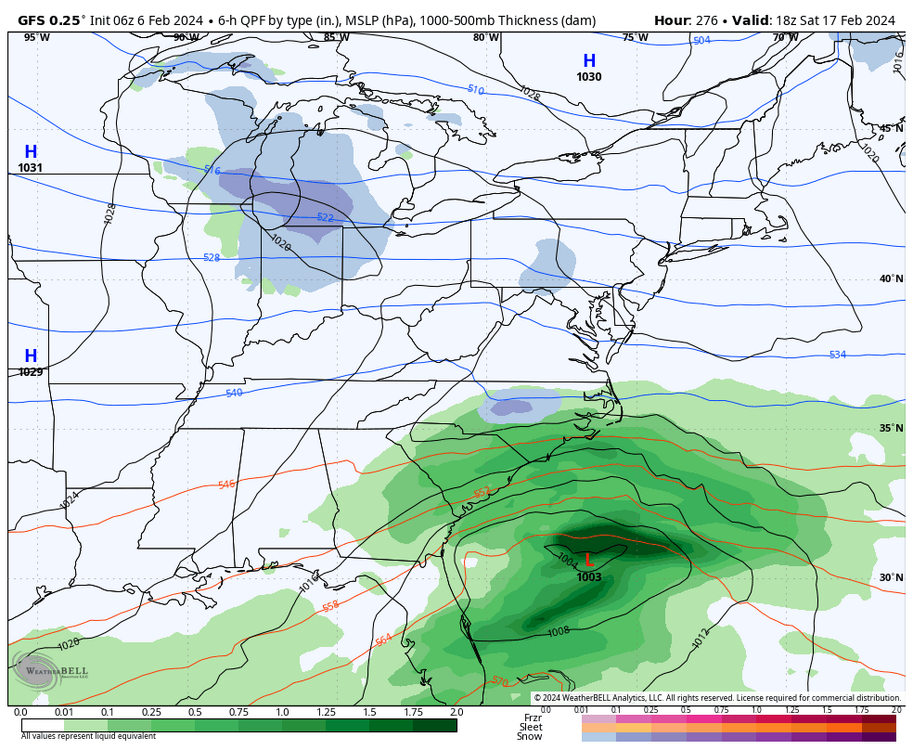
The 00z Euro picks up on the 00z GFS idea as well. 6z GFS shifted back north. You can see when looking at the 500mb vorticity maps that the vortex over Canada is farther north over Hudson Bay than the 00z run, and there are some slight timing differences with the northern and southern stream energy before they try to phase compared to the 00z run. This is still 6-7 days out, so the details will probably change. Also need to keep watching the 18th-29th period. 6z had a coastal low farther north than the 00z run.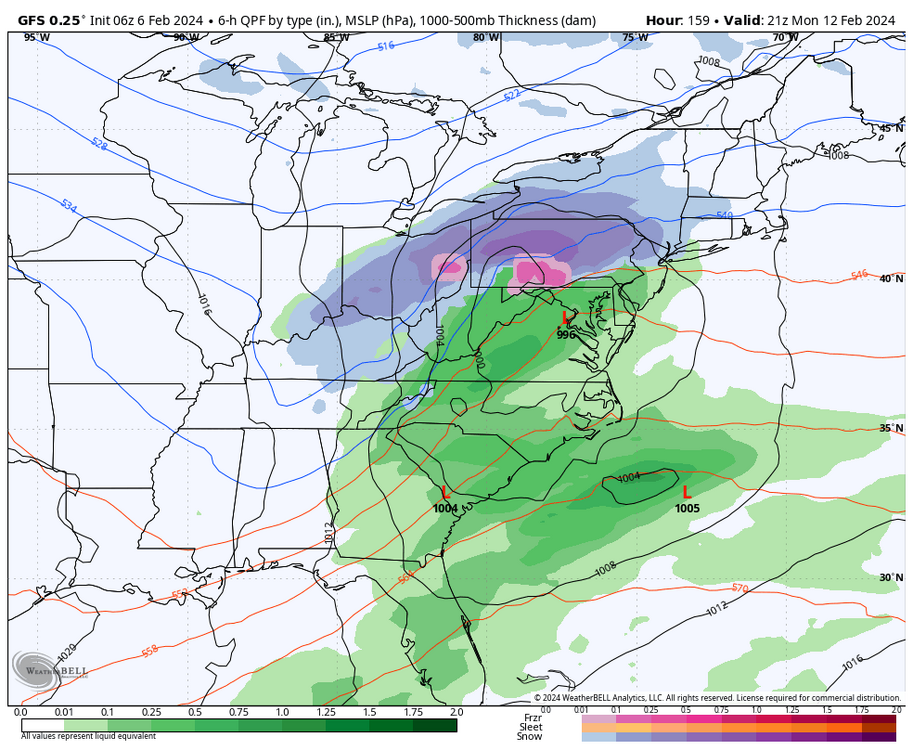
-
Richmond Metro/Hampton Roads Area Discussion
RIC Airport replied to RIC Airport's topic in Mid Atlantic
Doesn’t seem to have much ensemble support. But like you said, @Conway7305there is plenty of time. Just not wanting us to be on the fringes like a few weeks ago.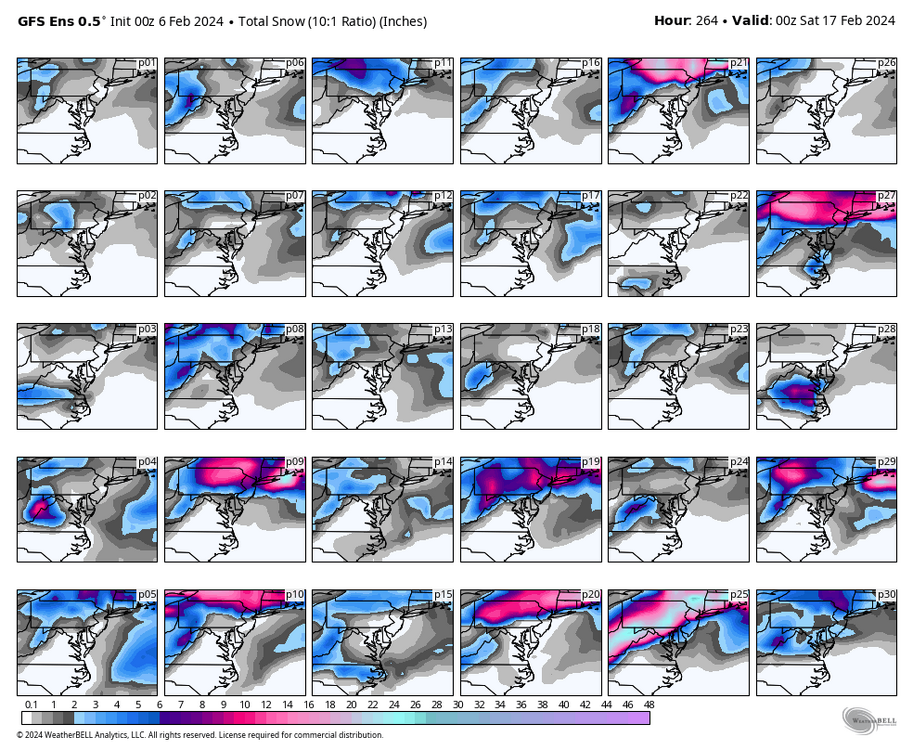
-
Richmond Metro/Hampton Roads Area Discussion
RIC Airport replied to RIC Airport's topic in Mid Atlantic
I dont like it, we are on the fringes.
-
Richmond Metro/Hampton Roads Area Discussion
RIC Airport replied to RIC Airport's topic in Mid Atlantic
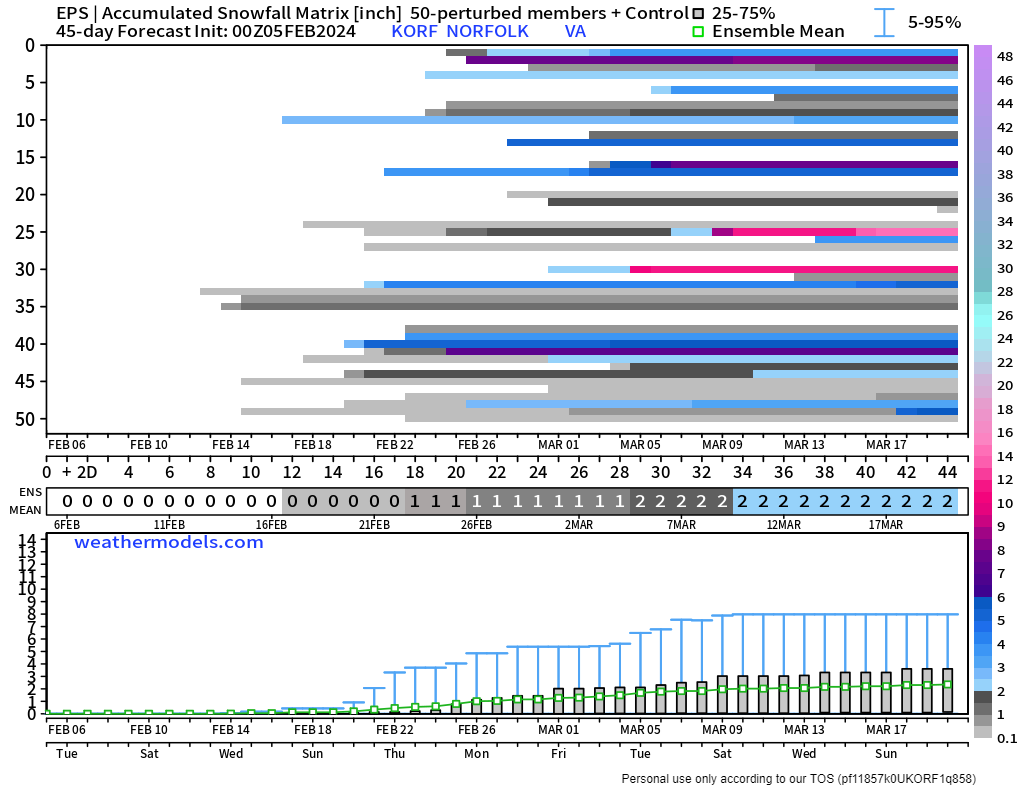
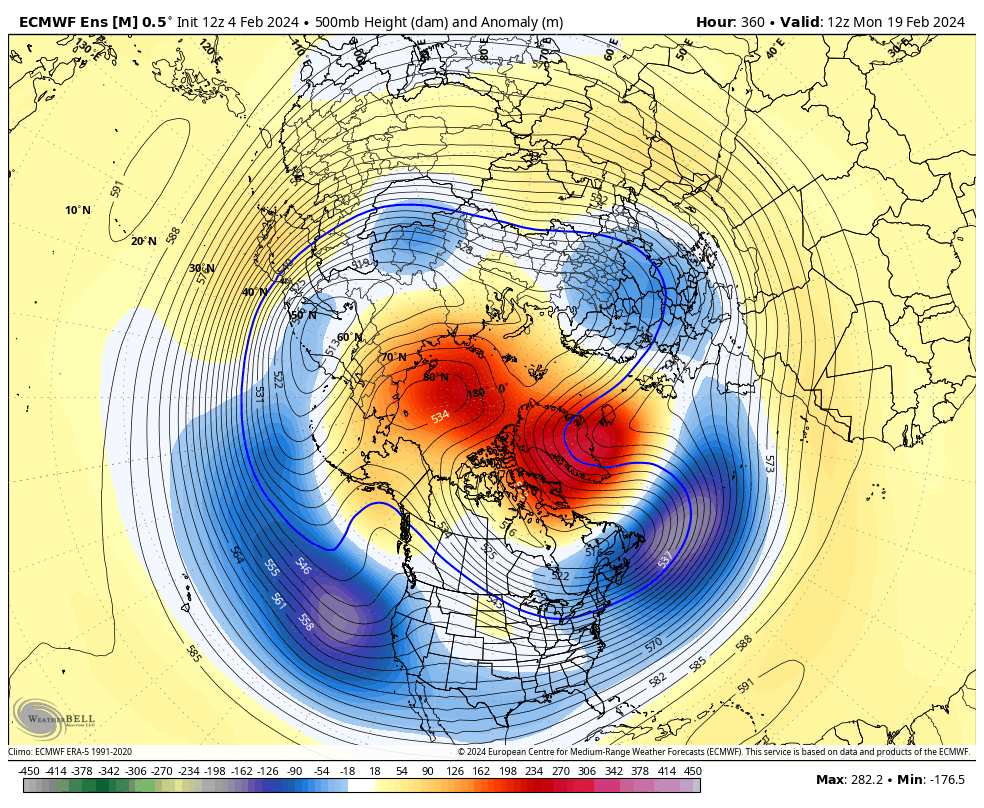
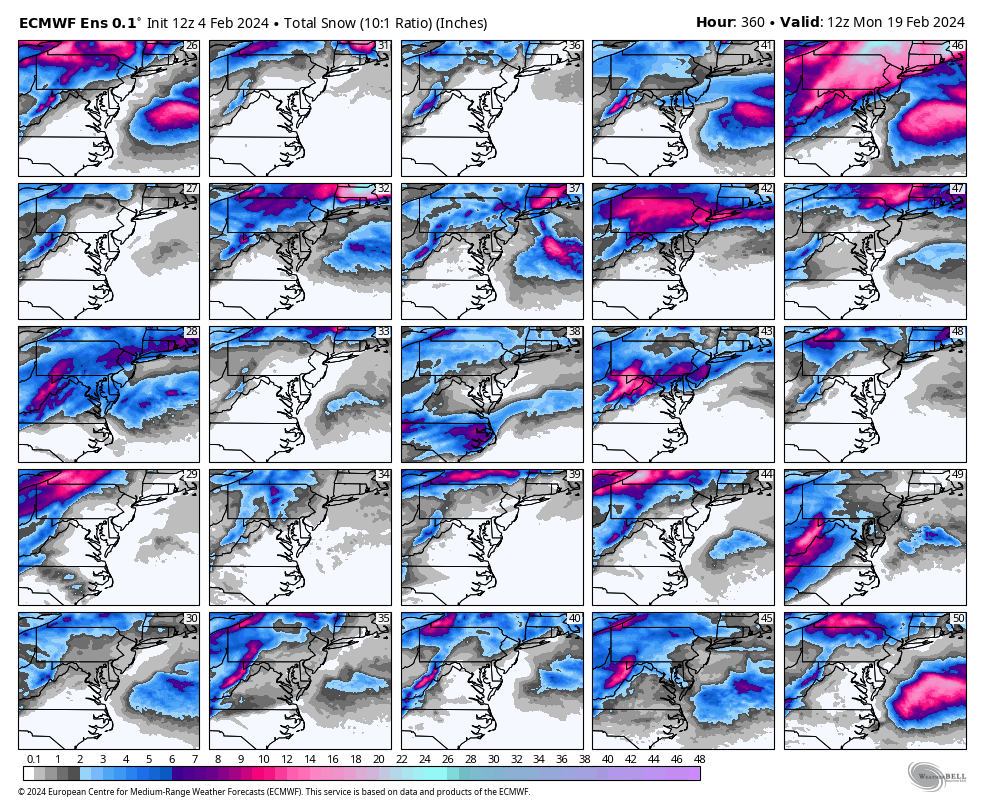
I just peaked at the Euro weeklies, and everything looks favorable at h5 through March 22nd. These fluctuate daily, but the snow mean map had its highest numbers in about a week. Maybe we can get something record breaking like Nova Scotia, @Stormpc.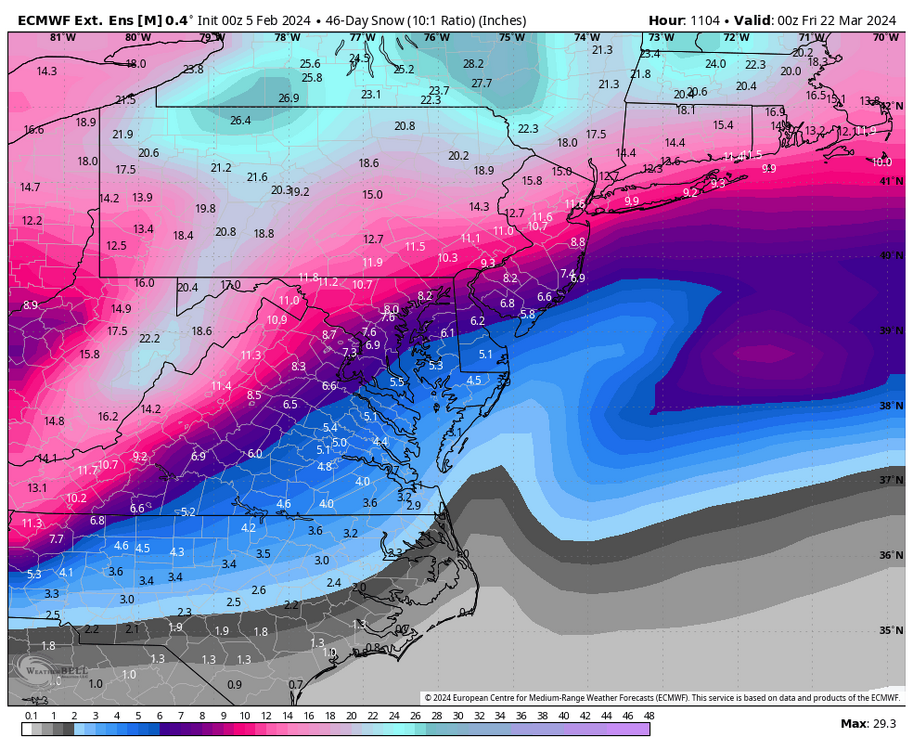
-
Richmond Metro/Hampton Roads Area Discussion
RIC Airport replied to RIC Airport's topic in Mid Atlantic
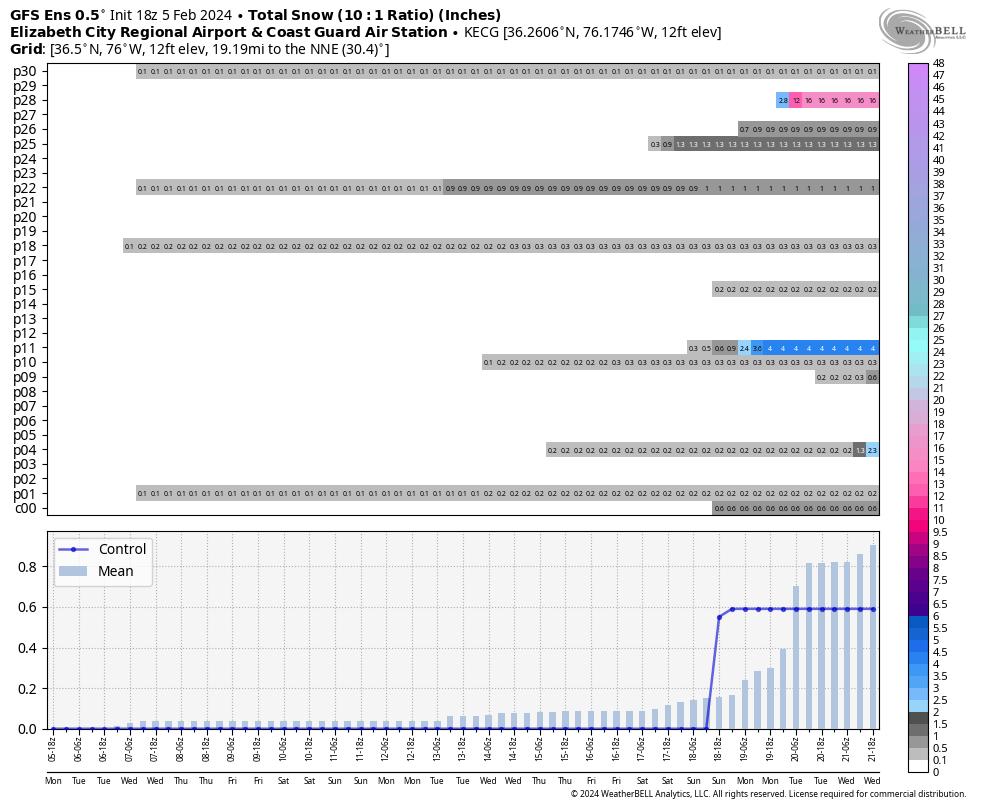
I peaked at the 18z GEFS; this was the best run all day. Had a few good hits between the 18th and 20th. Just needs some consistency as its earlier runs and even the 00z and 12z EPS were unremarkable.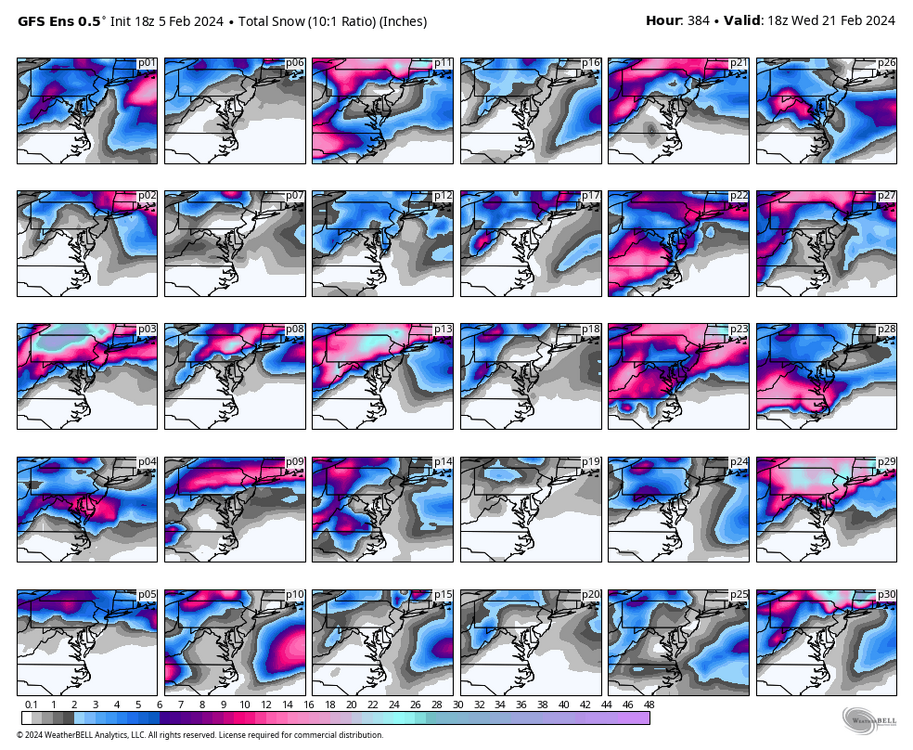
-
Richmond Metro/Hampton Roads Area Discussion
RIC Airport replied to RIC Airport's topic in Mid Atlantic
I was not impressed with today's runs, but that doesn't mean things won't change come tomorrow or later this week. We need to wait until the pattern evolves. I think it's still early. And trust me, I am impatient. I truly hope we can score in our area, and we should if history is a clue. -
Richmond Metro/Hampton Roads Area Discussion
RIC Airport replied to RIC Airport's topic in Mid Atlantic
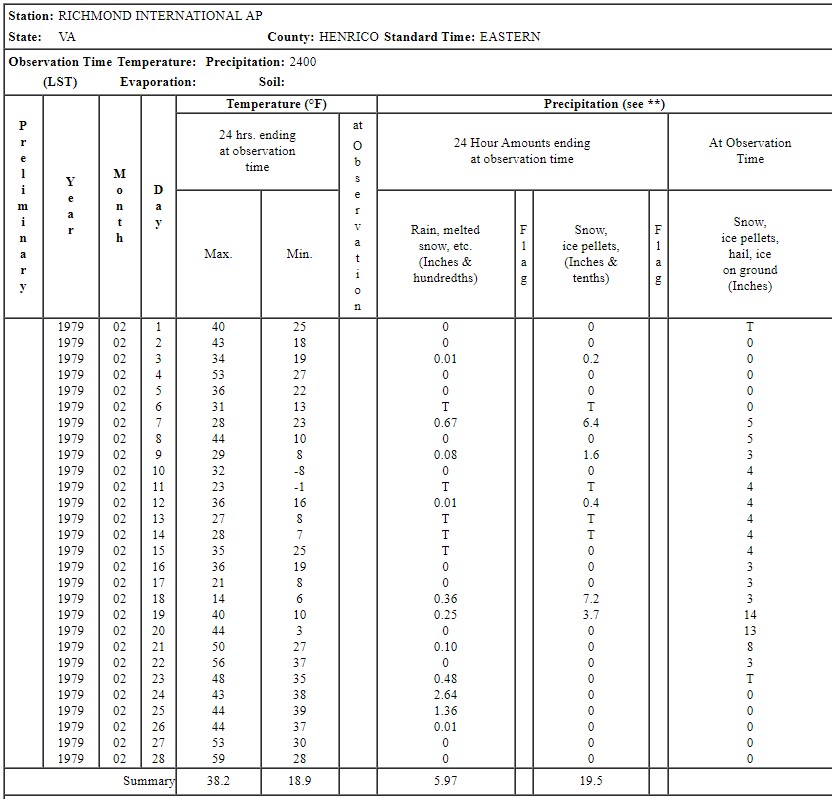
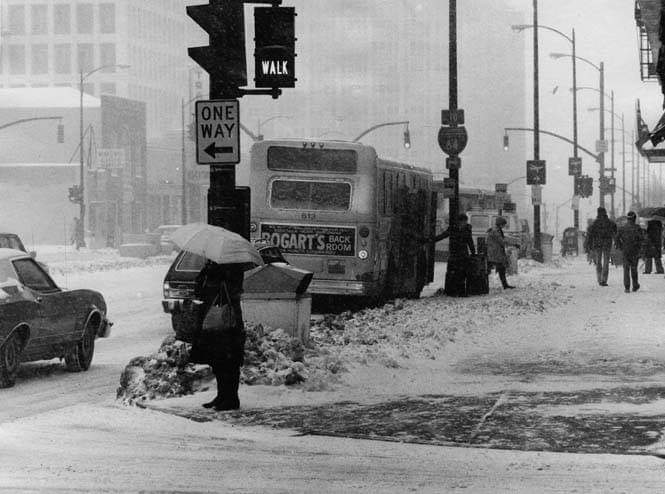
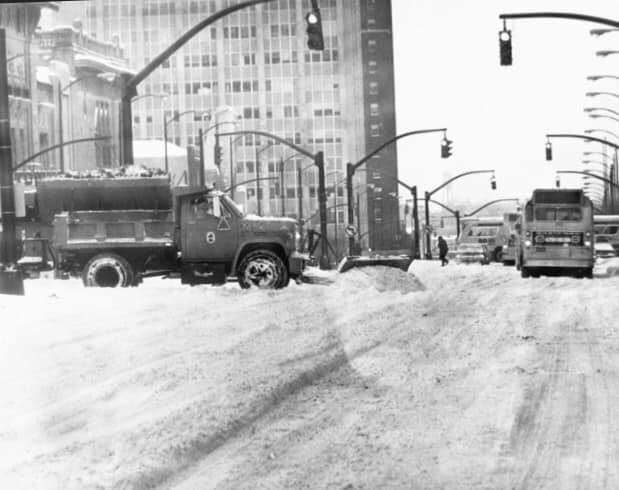
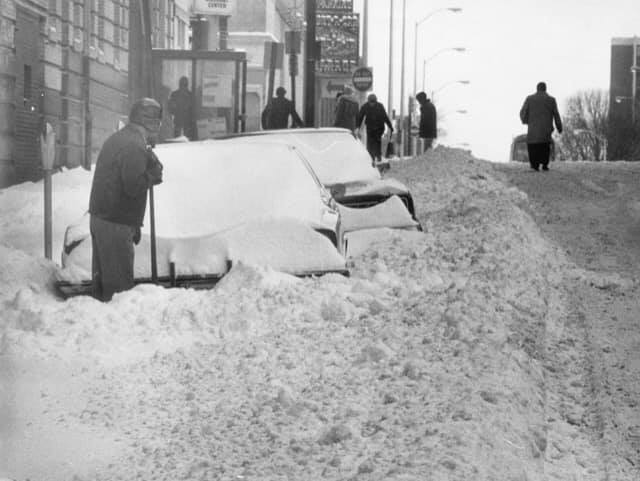
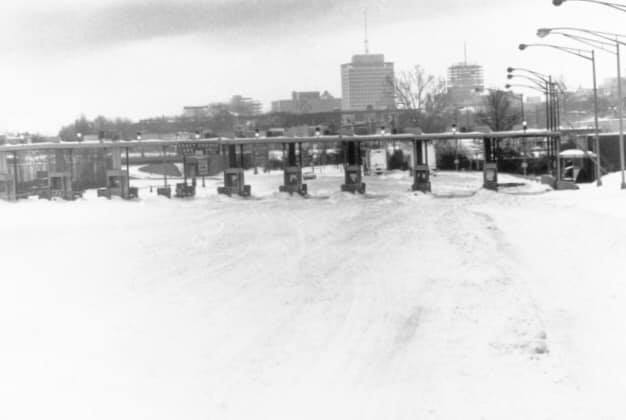
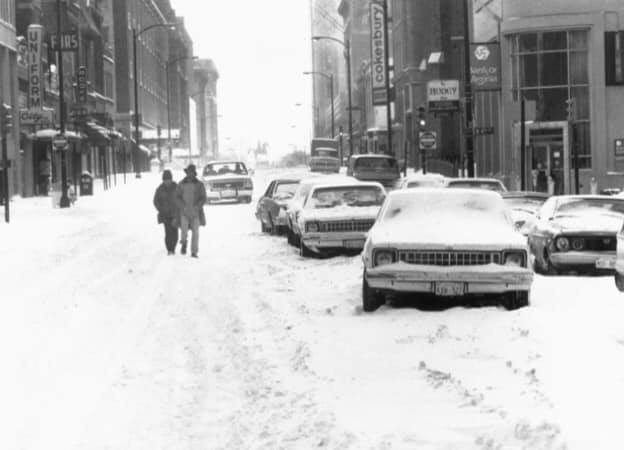
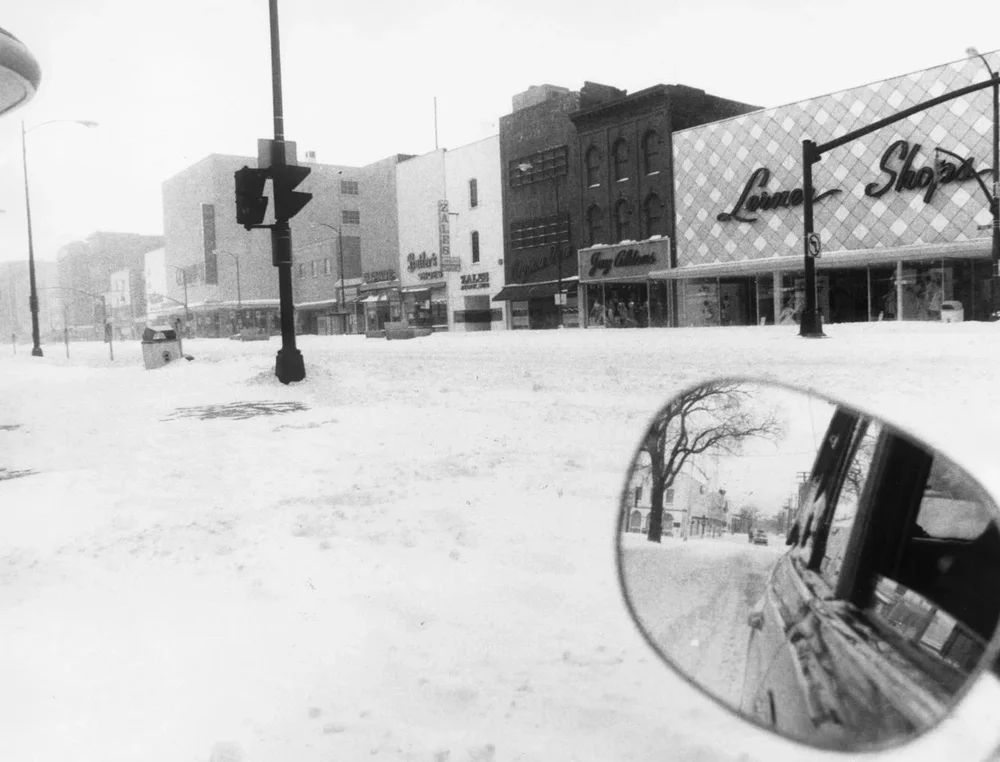
I found these in the RTD archives. They should have listed the location in the last photo, but it's probably the same area. I wasn't born until 6/1981, but I could recognize where these were taken. All the people, the buses, and the snow plows show how we were more accustomed to getting snow than we are today. The below was taken downtown after the January 2016 storm, notice no people, no cars/busses, no plows. Interestingly, there were already 3 to 4 inches of snow on the ground from a 6.4 inch snowstorm that hit back on 2/7/1979. Look at how deep the snow depth got on 2/19/1979. That was also a frigid month. Richmond hit -8°F a few days after that storm. It's too bad we haven't seen many months with this type of cold/snow combo since. February 2010 featured a 16-day stretch with snow on the ground, the longest stretch January 1996.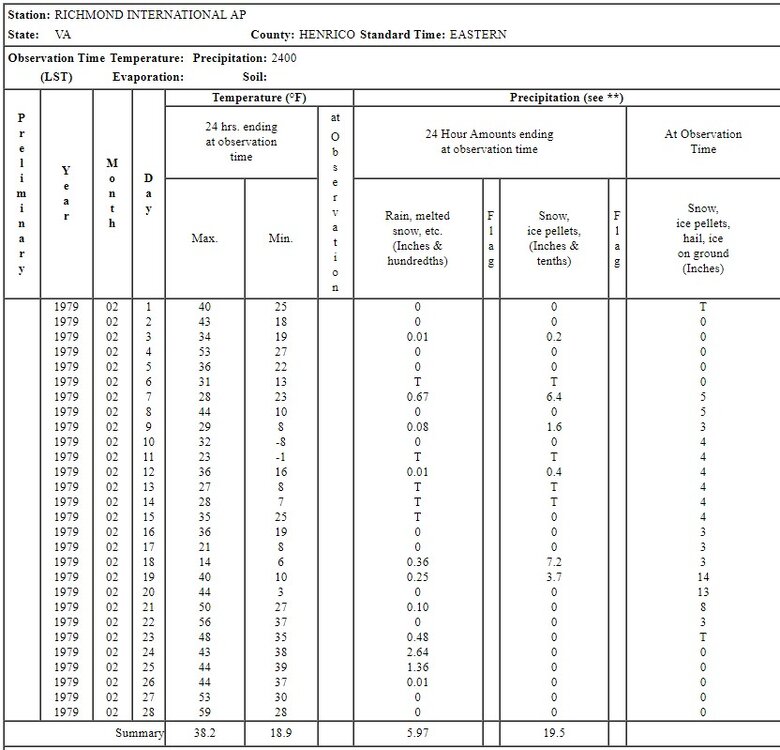

-
Richmond Metro/Hampton Roads Area Discussion
RIC Airport replied to RIC Airport's topic in Mid Atlantic
18Z GFS has a hybrid situation where snow turns to ice for President's Day. Then, somehow, as the coastal gets going, we lose the cold at the surface, and any ice turns to rain for everyone. This is at the end of the run, but bottom line there IS STILL a storm around that time. -
Richmond Metro/Hampton Roads Area Discussion
RIC Airport replied to RIC Airport's topic in Mid Atlantic
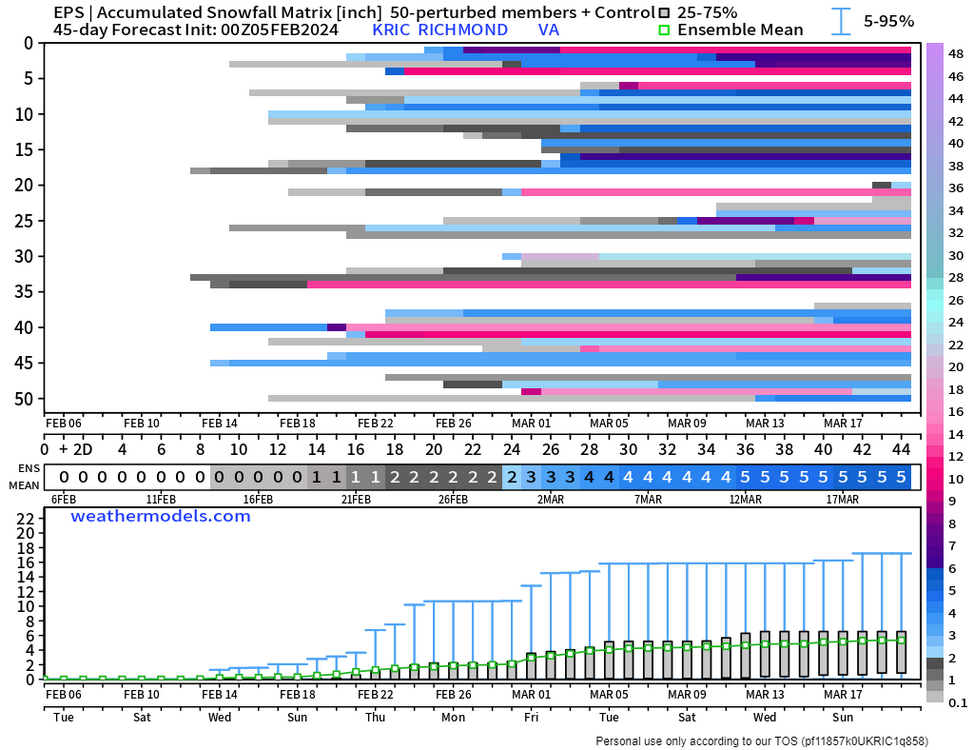
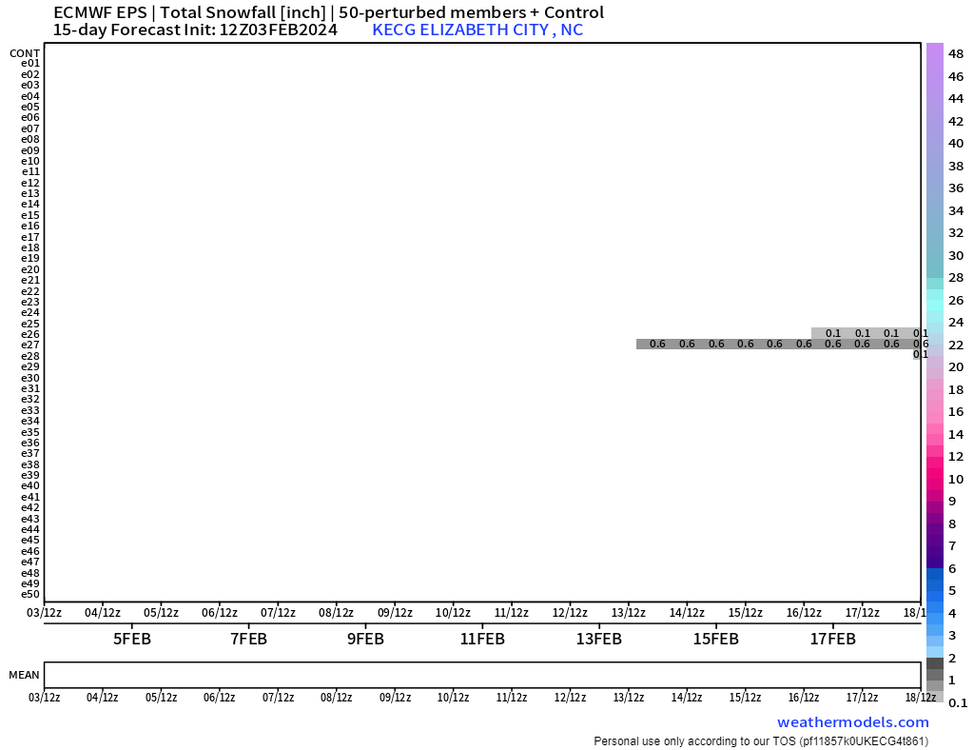
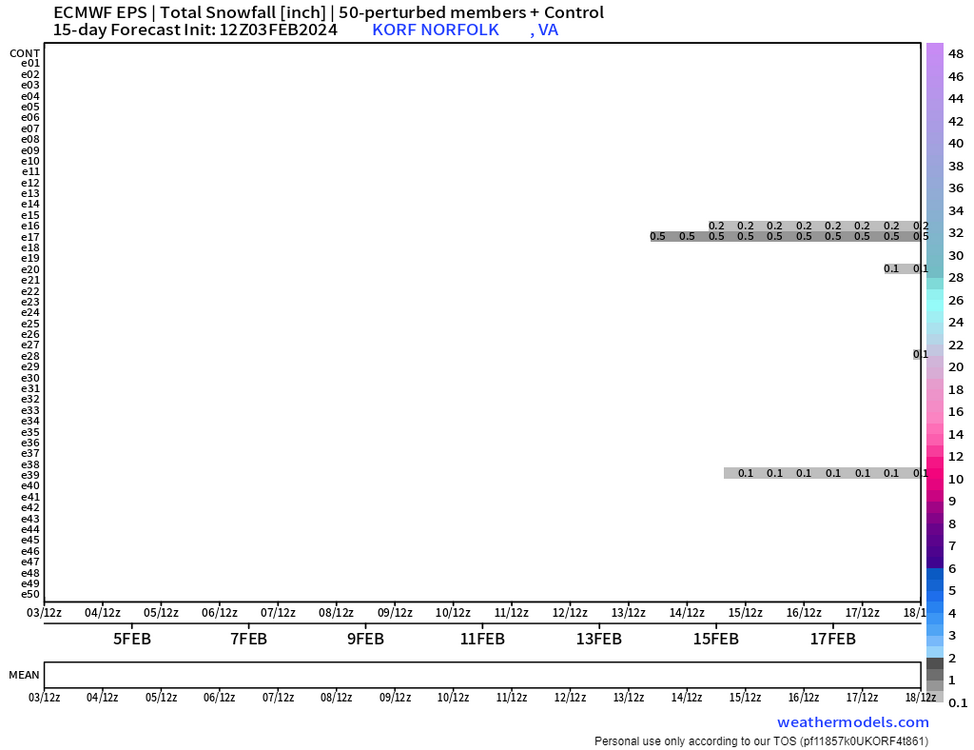
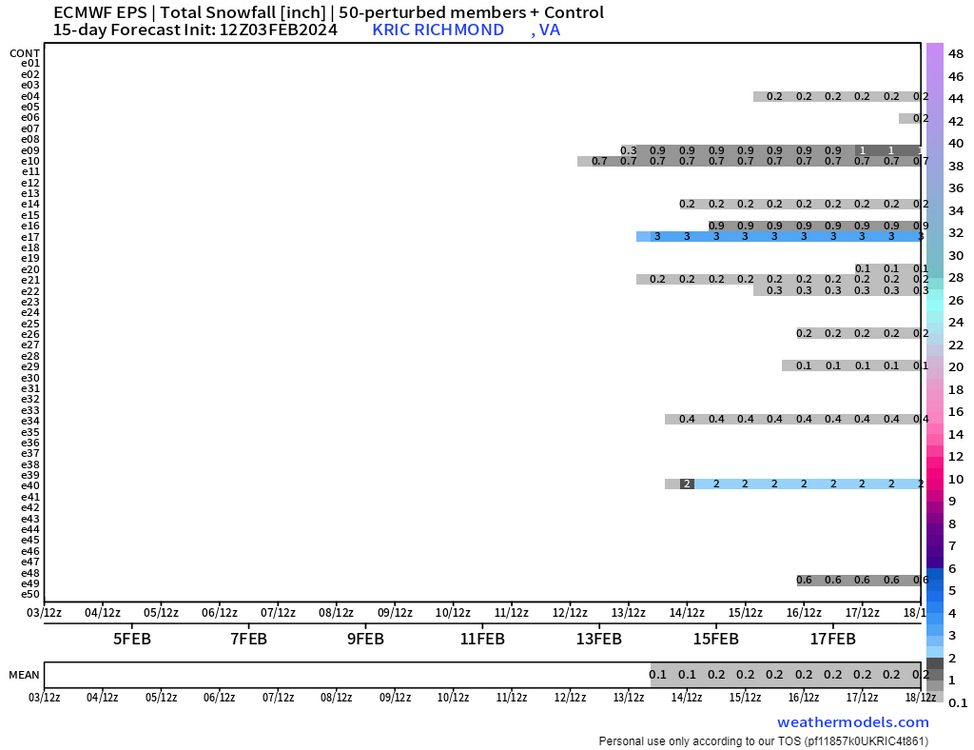
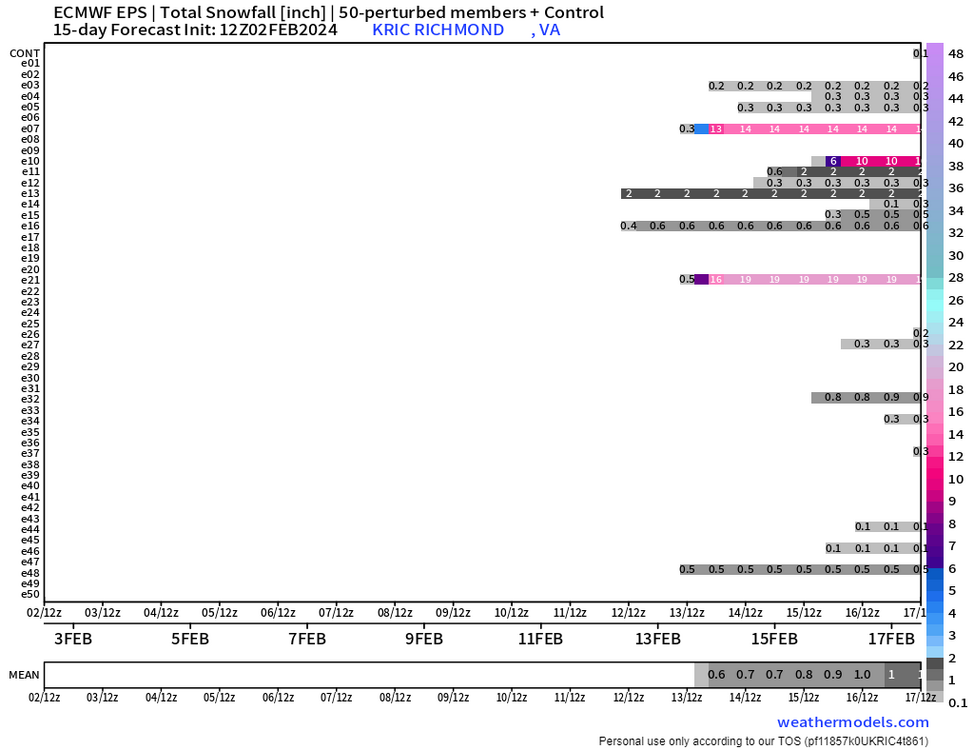
Still a great look at H5, but only a few minor hits on the EPS snow maps from about the 14th to the 19th. One thing that I am starting to get concerned about is the lack of true arctic air I'm seeing at the end of these ensemble runs, but perhaps with the right timing it can get "cold enough" if we get some good dynamics and a good storm track.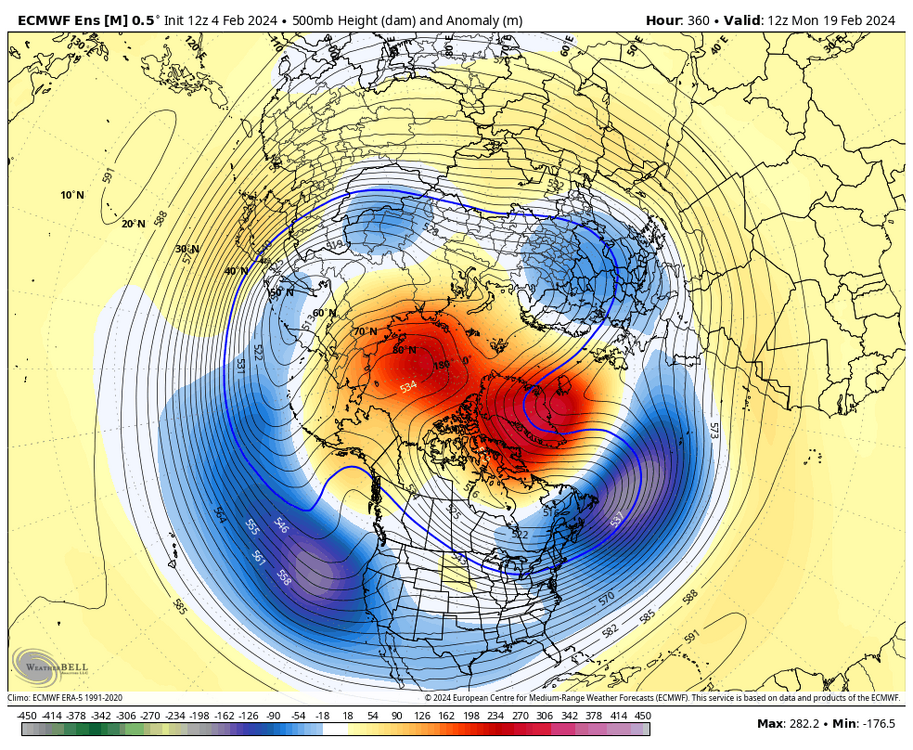

-
Richmond Metro/Hampton Roads Area Discussion
RIC Airport replied to RIC Airport's topic in Mid Atlantic
People are floating around PD III because we had a KU on Presidents Day in 1979 and again in 2003. RIC recorded 10.9" from PD I, one of the coldest snowstorms in the period of record, rivaling the February 1899 Blizzard. Temperatures in Richmond during that snowstorm were only around 10°F. I would've loved to have been alive to experience it. Here are some photos I found of it. Does anyone recognize these areas? Unfortunately, the 2003 storm (PD II) did not meet expectations for areas south of Fredericksburg, but it was still a very impactful event. I had the AKQ graphic saved for many years until an old hard drive crashed. The graphic had 14.2" for RIC. However, there was only about 3-5" across the RIC area because even though the surface temperatures were only around 20°F during the height of the event, precip was mainly in the form of IP. The storm came in 3 pieces over several days. It started as rain, then it was forecasted to turn to ZR/IP, and then +SN once the coastal got going. Instead, we got the IP/ZR as the colder air filtered in, then got dry slotted. Then, the coastal cranked too far north of us to reap the benefits, something that thankfully didn't happen in the 2016 storm. Perhaps, if and when there is a PD III, it'll be on par with PD I.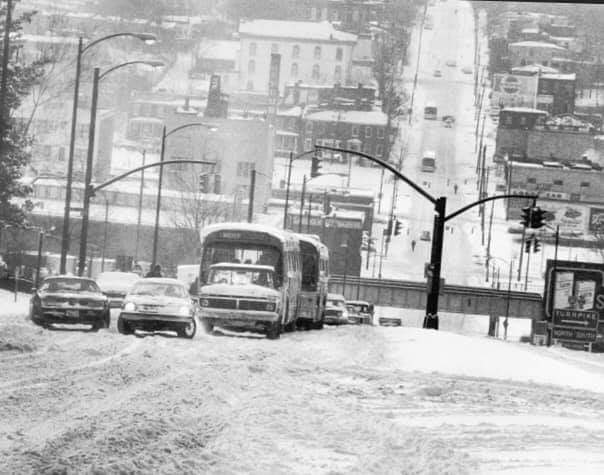
-
Richmond Metro/Hampton Roads Area Discussion
RIC Airport replied to RIC Airport's topic in Mid Atlantic
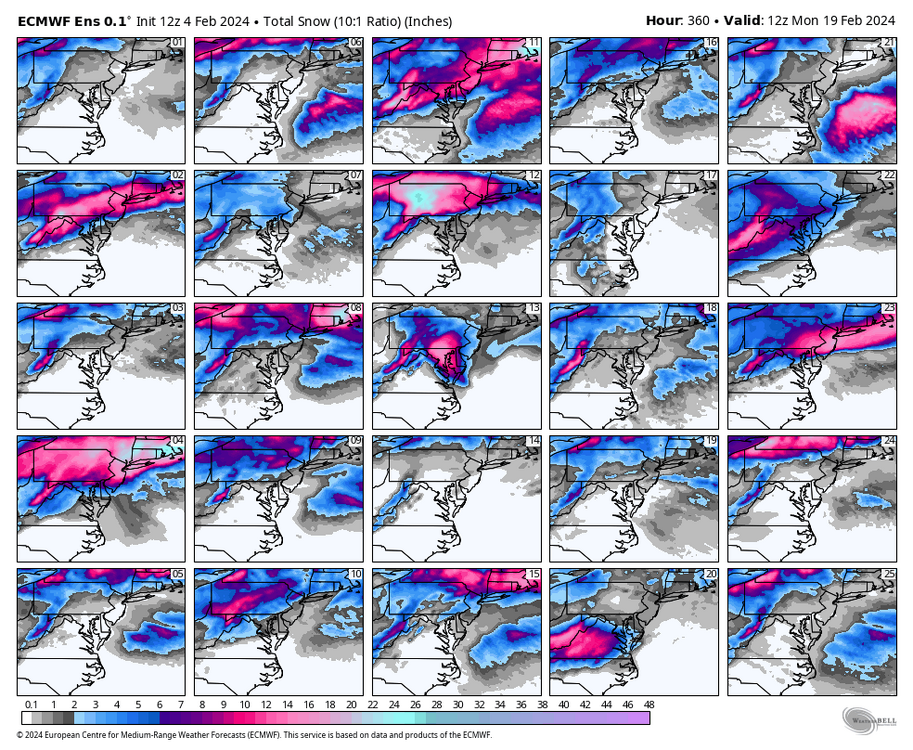
A few big hits on the 12Z GEFS on the 18th-19th.
-
Richmond Metro/Hampton Roads Area Discussion
RIC Airport replied to RIC Airport's topic in Mid Atlantic
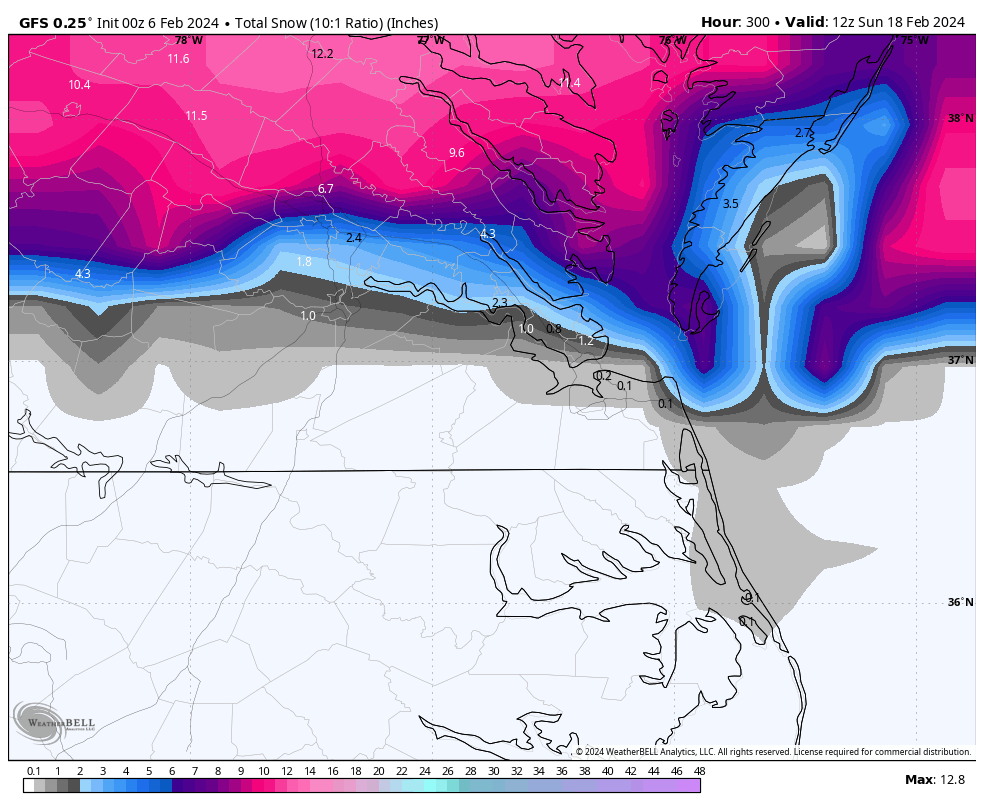
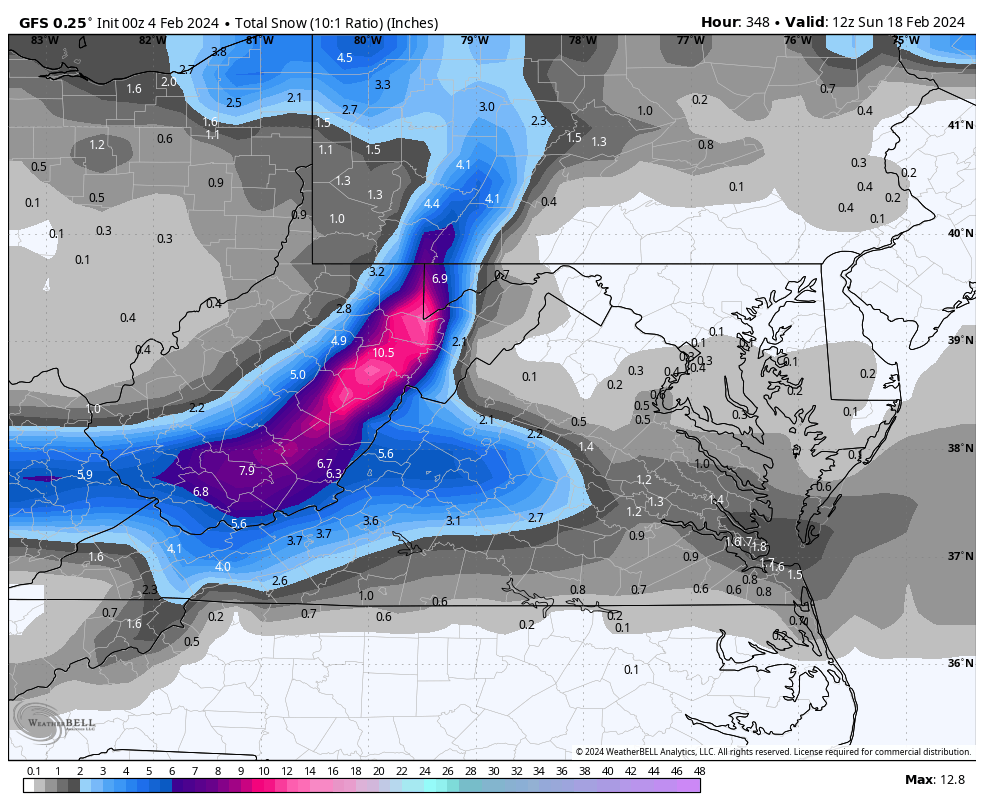
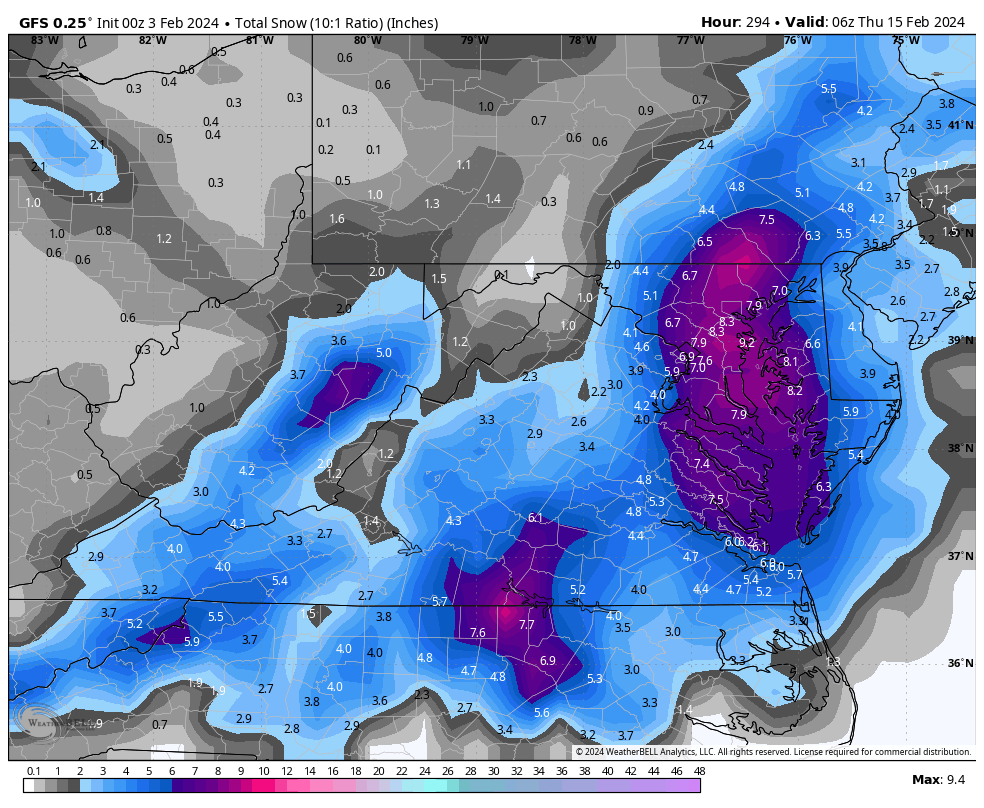
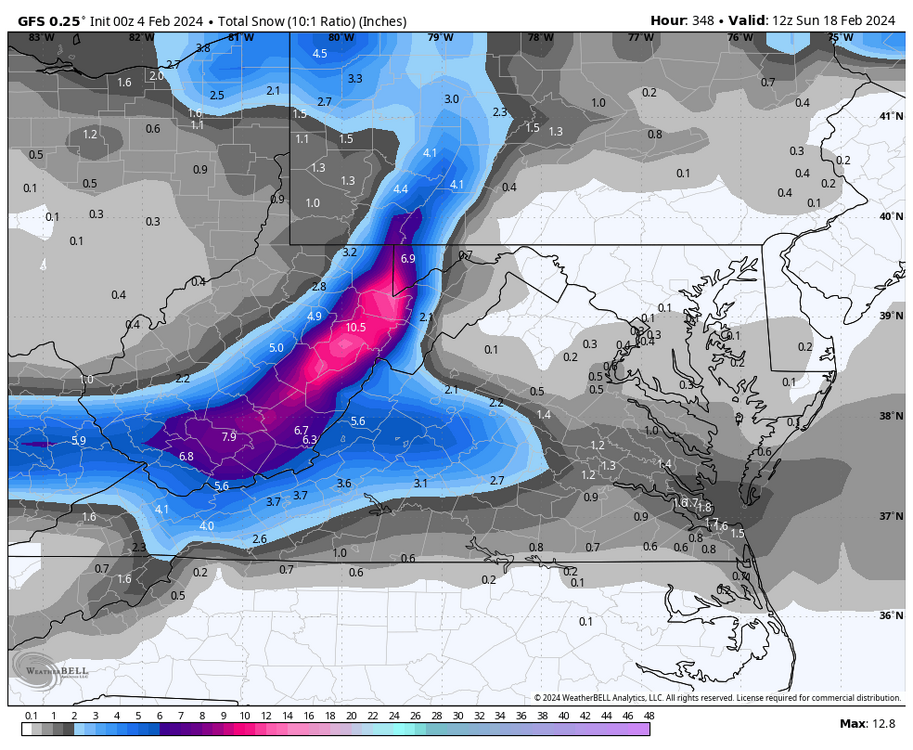
The 00z GFS brought back a storm. This time, it's on 2/18. I'm sure there will continue to be fluctuations for at least the next 7 -10 days as we approach the next favorable "window" for snow. Posting the maps to keep hope alive, recognizing that 6z could take it away.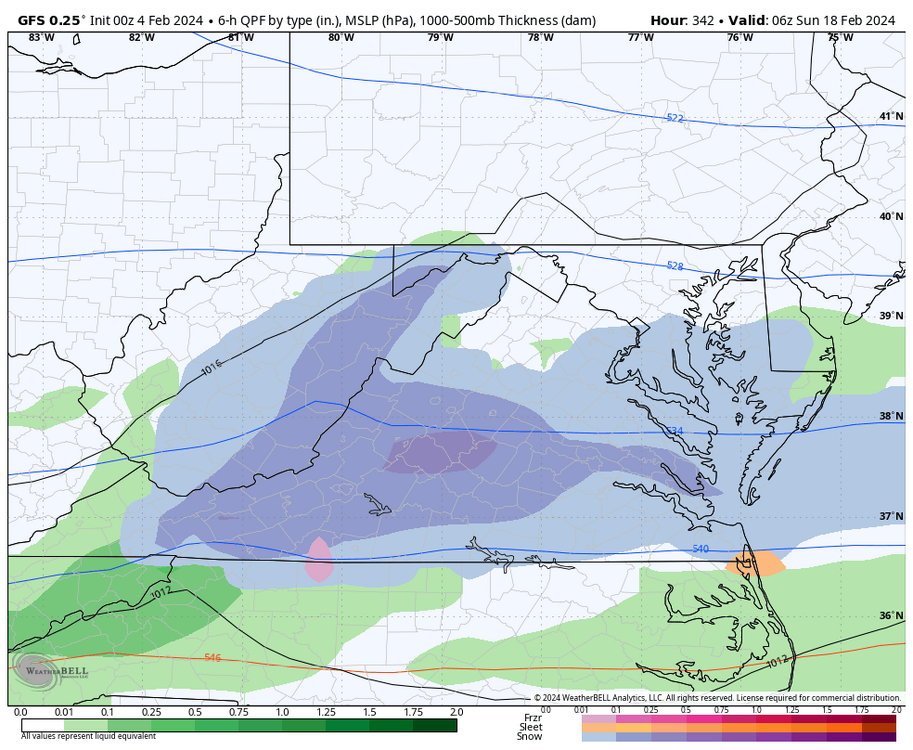
-
Richmond Metro/Hampton Roads Area Discussion
RIC Airport replied to RIC Airport's topic in Mid Atlantic
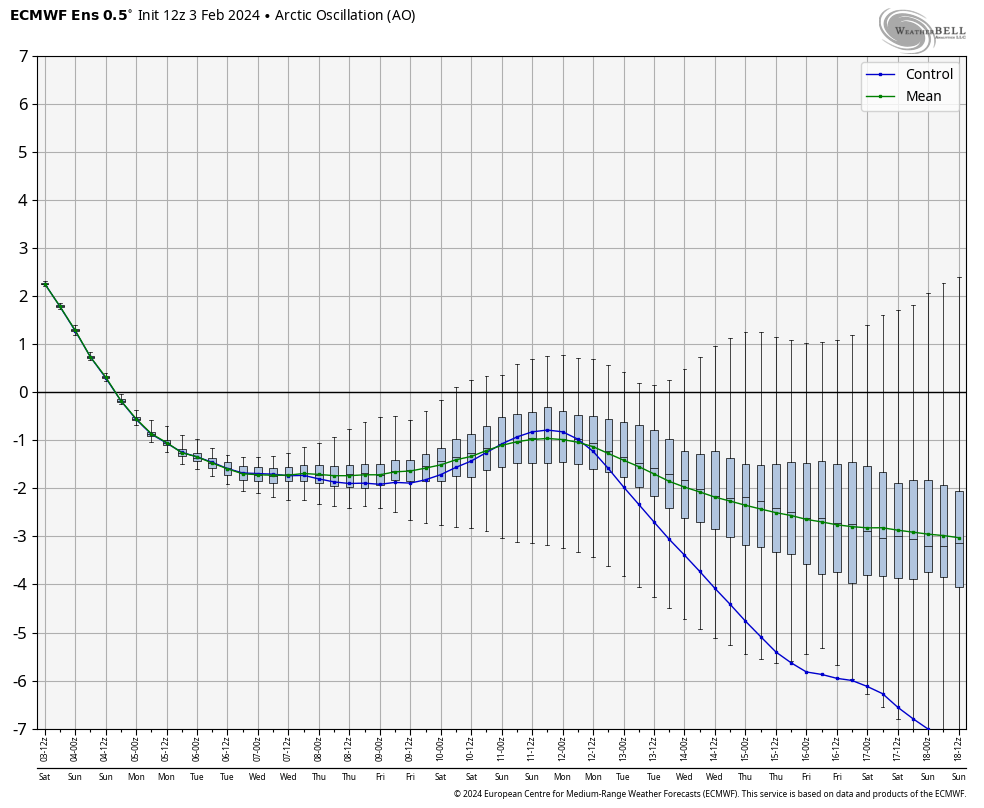
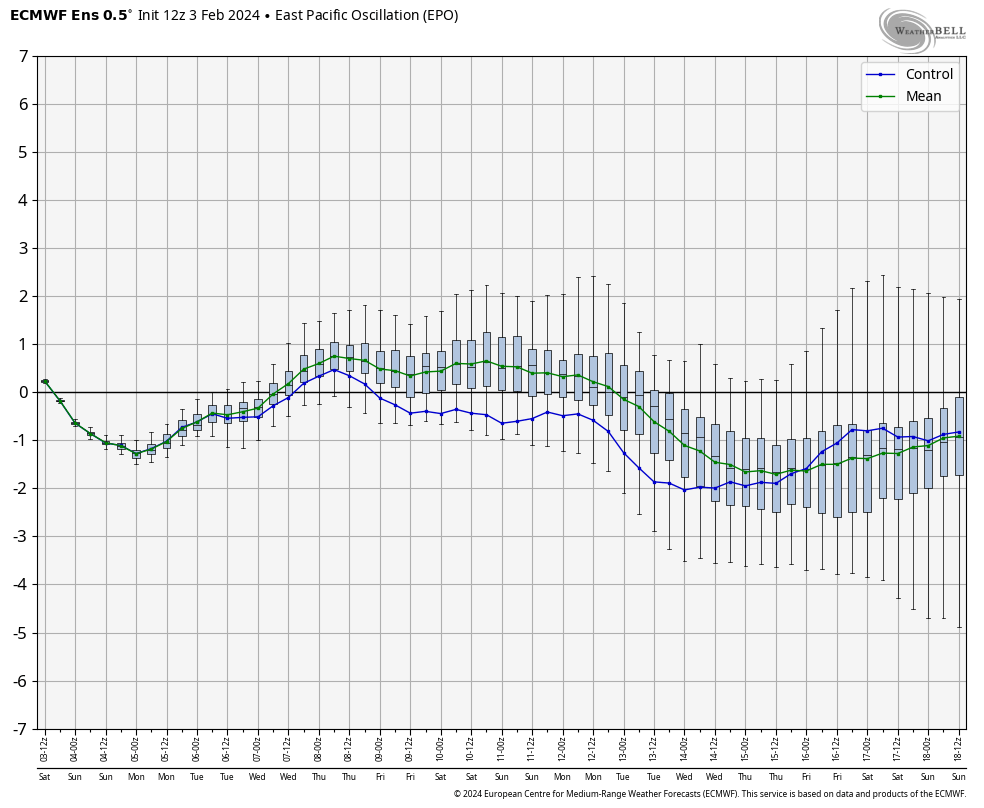
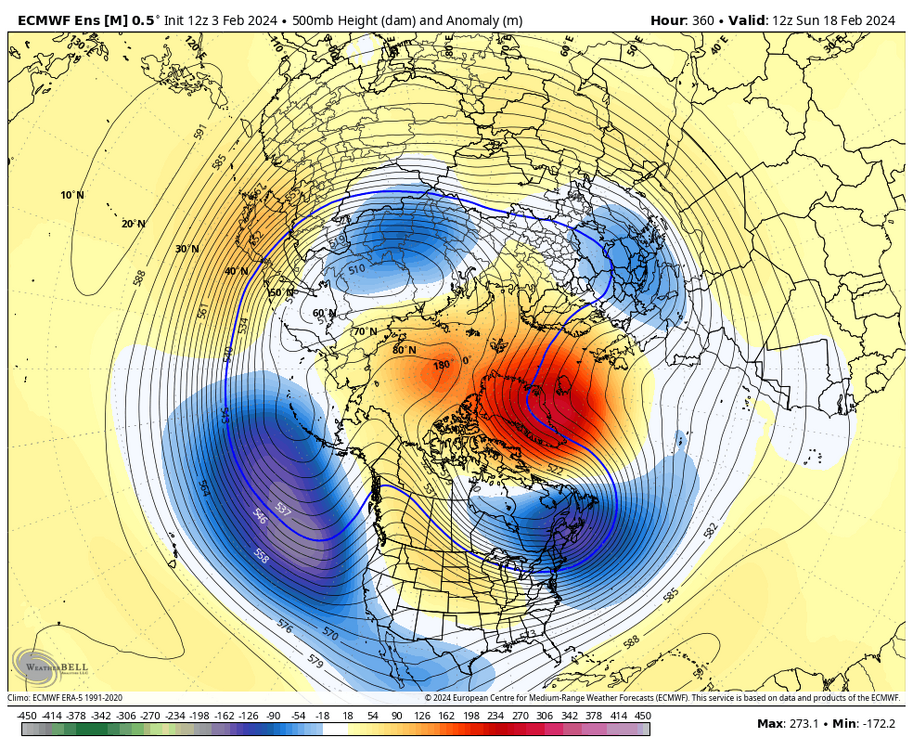
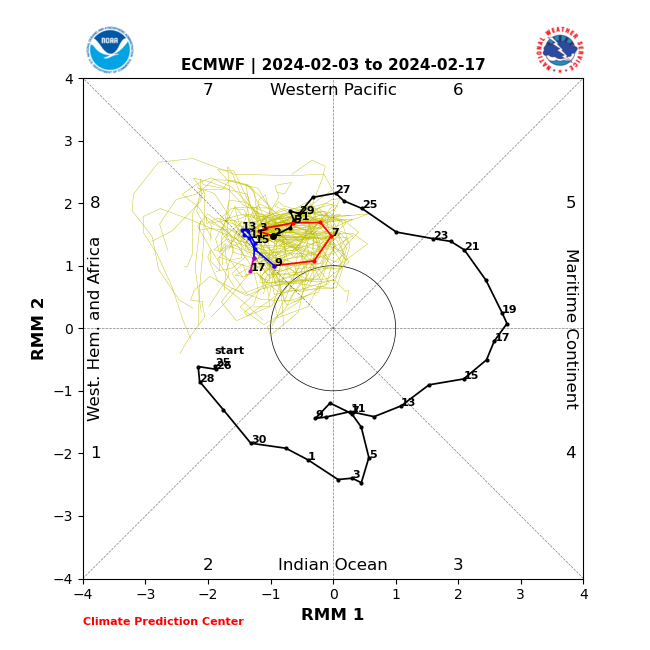
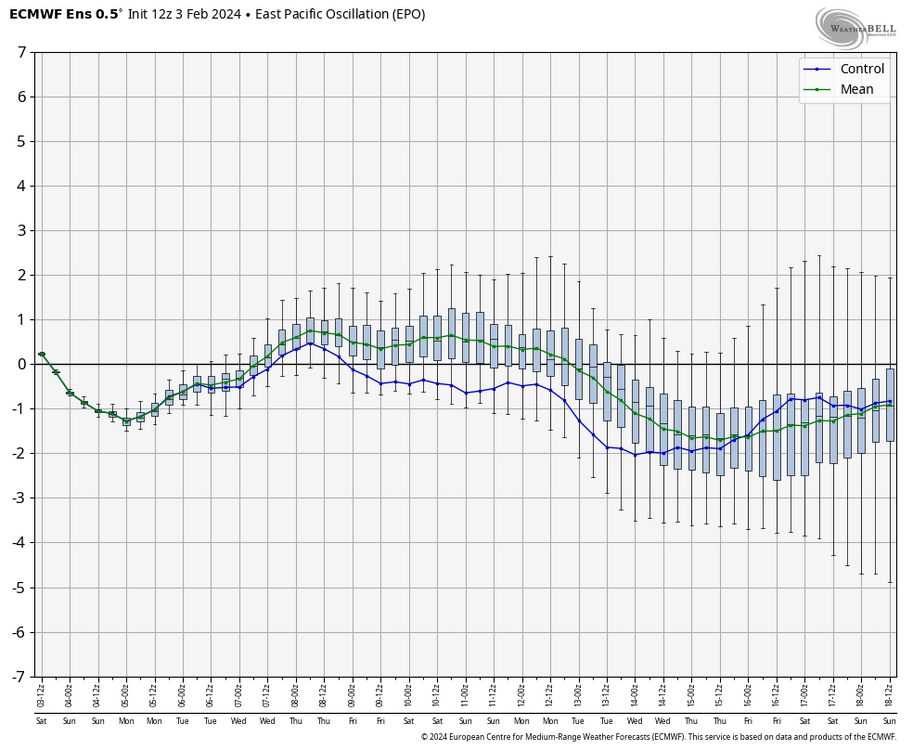
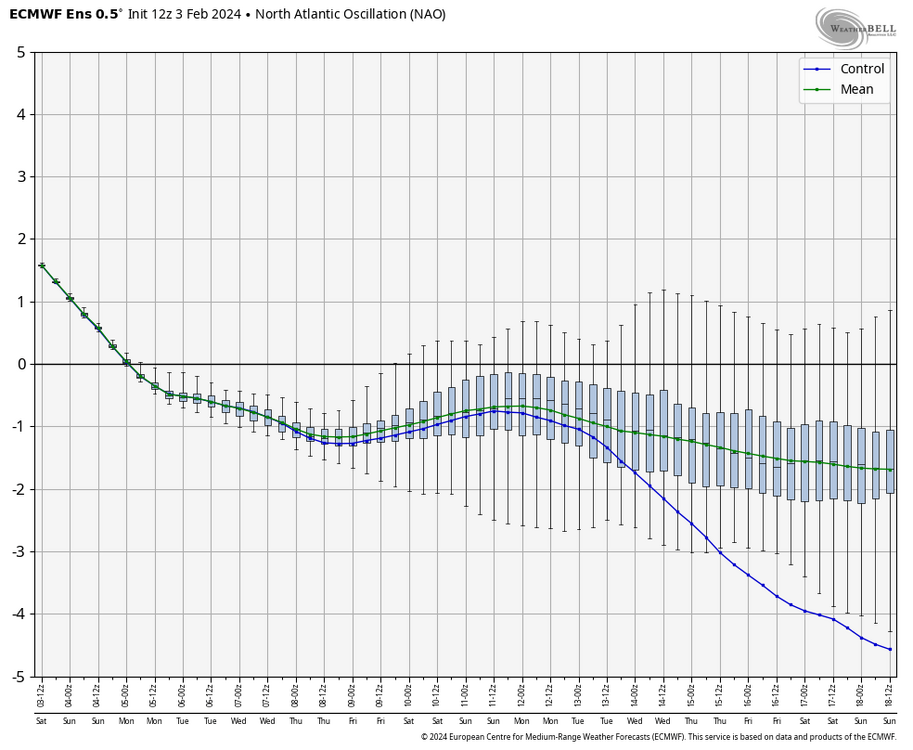
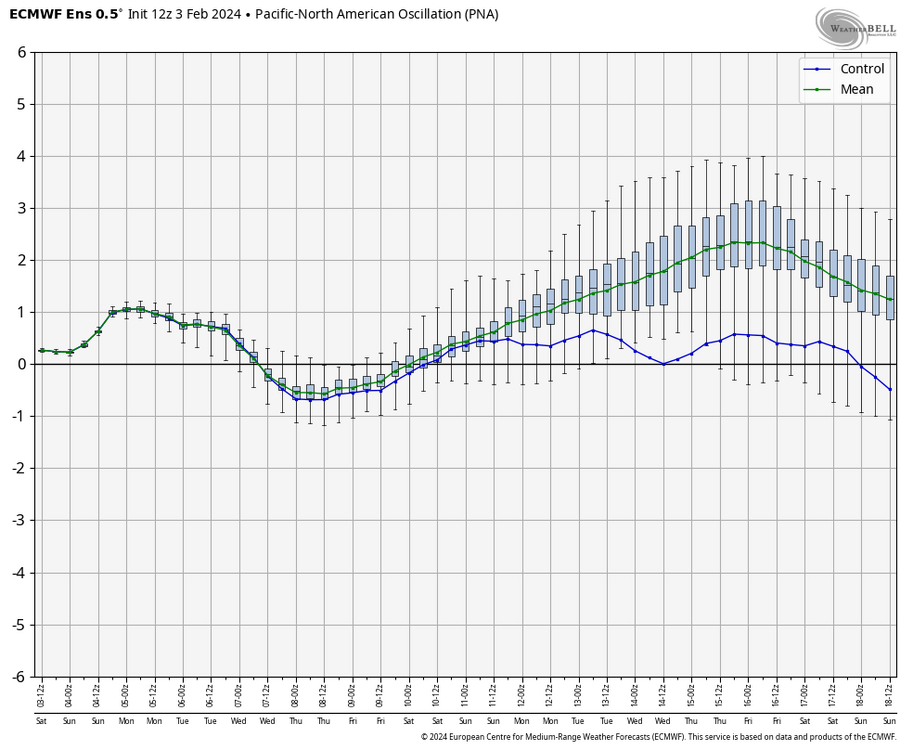
Nothing notable, in terms of snowstorms at least, on the 12z EPS either. At the end of the run, we still have nice -NAO, -AO, and -EPO, a western ridge, and a split flow. There is also a nice vortex over SE Canada and lower highs in the 50/50 region, so it's hard to see why this "look" won't translate to a storm at some point, especially when all the teleconnections are where we want them to be.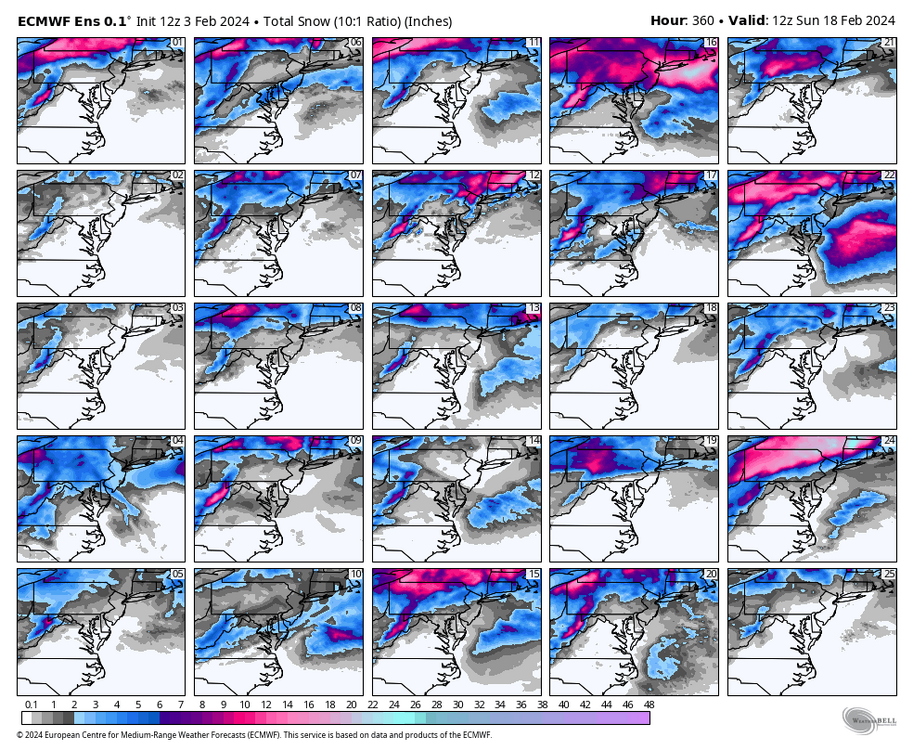

-
Richmond Metro/Hampton Roads Area Discussion
RIC Airport replied to RIC Airport's topic in Mid Atlantic
6z and 12z GFS were indeed less enjoyable than the 00z run. 6z GEFS had a handful of hits, and 12z GEFS even fewer. Everything at H5 still looks good toward the end, so hopefully, this was just a fluke run, and the EPS offers more hope. -
Richmond Metro/Hampton Roads Area Discussion
RIC Airport replied to RIC Airport's topic in Mid Atlantic
The 00z GFS has a storm for Valentine's Day. Plenty of time to watch, just happy to see storms popping up in the LR.

-
Richmond Metro/Hampton Roads Area Discussion
RIC Airport replied to RIC Airport's topic in Mid Atlantic
Yeah, and it happens more often than you'd think. Snowstorms like 1/4/2018, 1/29/2014, 12/26/2010, 12/26/2004, and 2/6/1980 where occasions where someone in Hampton Roads got 10-15"+, while RIC only got T-3". Sometimes, we share, such as 1/7/2017, 2/26/2015, 1/3/2002 and 2/18/1989, where RIC gets 5-8", but Hampton Roads is in the bullseye. Yeah, the coastal formed and stalled long enough, and the death band formed and stayed right along I-95. Part 1 was just light to moderate snow with the overrunning before we had precip-type issues. RIC still picked up 6.1" just from that, but it was far less than we were hoping for at the time, and having to wait on the low to crank up as the models indicated, was aggravating and almost suicidal, but it worked out. I was bracing for a repeat of 12/18/2009 or 2/16/2003, where we only got the initial and didn't get anything from the coastal like the models showed. RIC missed reaching blizzard criteria because the one hour in the middle gusted to 32mph, not 35mph. We needed 3 consecutive hours of 35mph+. *Year is wrong on the graphic.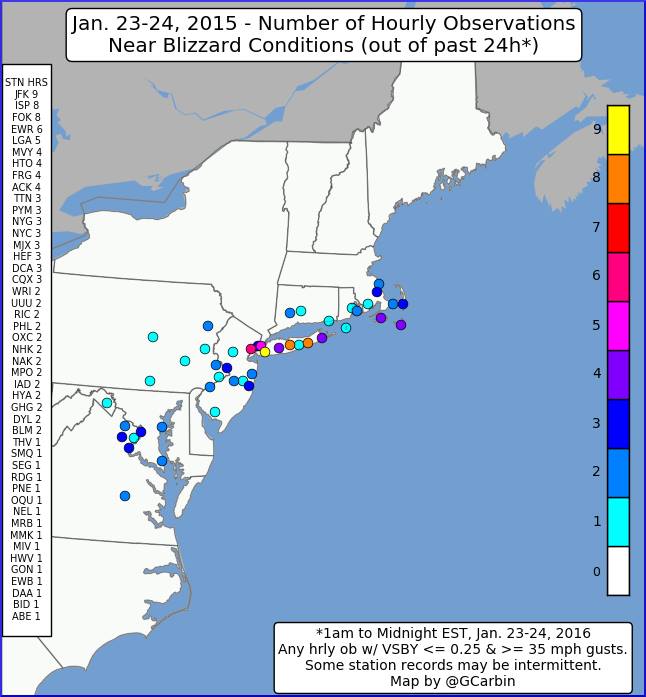

-
Richmond Metro/Hampton Roads Area Discussion
RIC Airport replied to RIC Airport's topic in Mid Atlantic
I agree. I wish we could return to the old days when the Miller A's happened regularly. Another good scenario is a southern slider (some call it Miller C), like 12/9/2018, 2/16/2015, or 1/30/2010, where there is one moisture slug and no mixing issues. OTTOMH, the last Miller A's that worked out were 2/12/2014 and 3/1/2009. We are getting more hybrids now, like 1/23/2016. I also am okay with those that form off the SC/GA coast and move north, like 1/25/2000 or 2/16/1996. -
Richmond Metro/Hampton Roads Area Discussion
RIC Airport replied to RIC Airport's topic in Mid Atlantic
1/29/2014 is another SE VA/NE NC snowstorm that often gets overlooked, @Stormpc.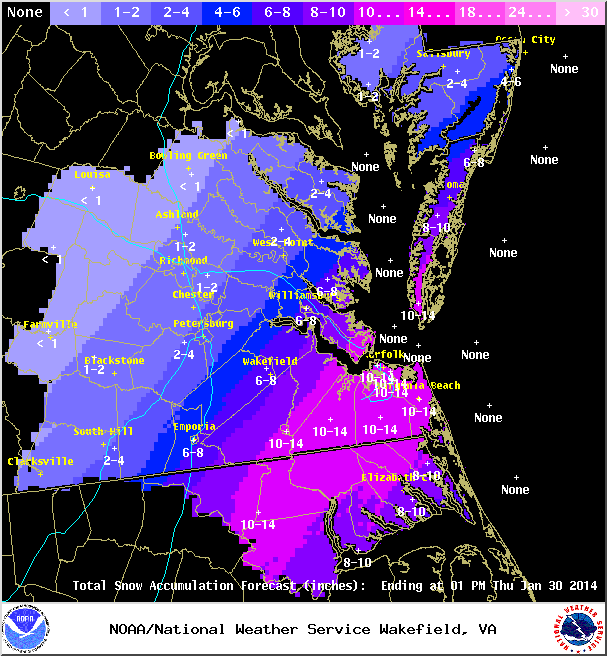
-
Richmond Metro/Hampton Roads Area Discussion
RIC Airport replied to RIC Airport's topic in Mid Atlantic
The winter of 2021-22 was frustrating, but there were numerous opportunities. I remember us tracking legit threats every week that were all happening on the weekends that January, from the 1/3/22 storm that trended too far north at the last minute to the two storms that tracked too far east barely giving coastal areas snow, but not enough in Richmond. Also, the 1/16/22 storm tracked up the Piedmont while we were in the upper teens to low 20s at the start but managed to reach the 50s six hours later. A couple maps I saved from that event.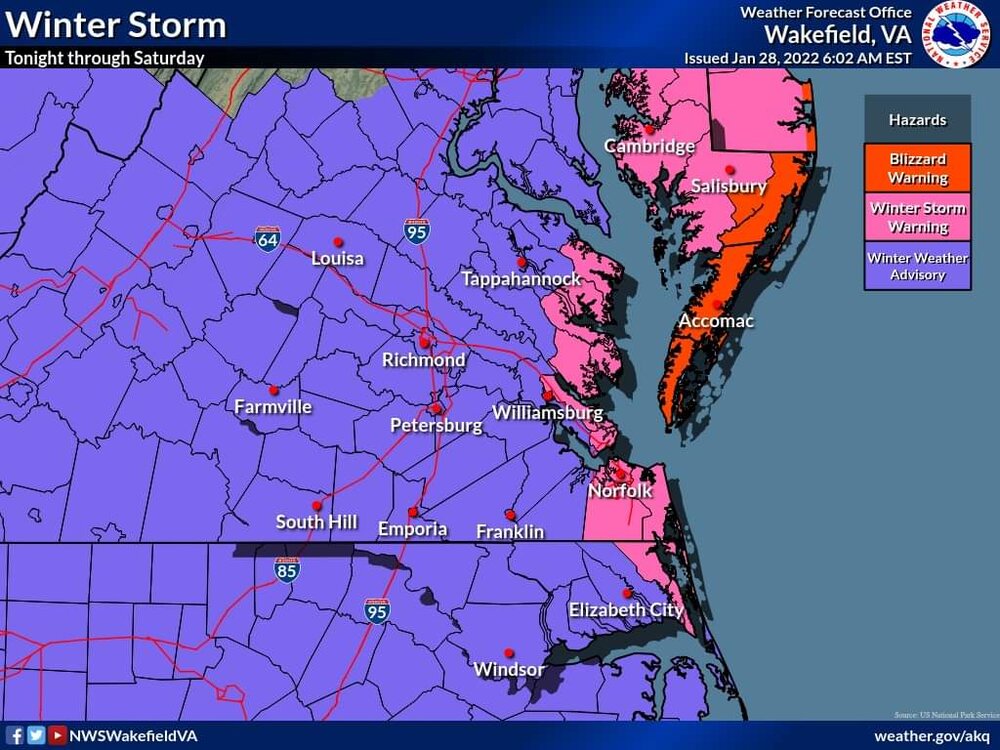
-
Richmond Metro/Hampton Roads Area Discussion
RIC Airport replied to RIC Airport's topic in Mid Atlantic
Yup, and new hits popped up on the 12z EPS. Hopefully, these charts light up in the coming days.

-
Richmond Metro/Hampton Roads Area Discussion
RIC Airport replied to RIC Airport's topic in Mid Atlantic
Yeah, it can be a weird place. I know that was just the February list, but there seems to be a greater return in La Nina winters than at Richmond, where there is clearly an El Nino correlation to higher snowfall. Looking at 2021-22, 2017-18, and 2010-11, and 1988-89 as just several examples. ORF was also one of the few stations that had an increase in its average when the 1991-2020 30-year climate data was published. Also, many in this forum probably didn't realize that ORF got about as much snow in January 2022 as DCA did. Not to mention getting two blizzards two years in a row and close to getting a third at the end of January 2022, as AKQ only included the Eastern Shore in the 1/28/2022 Blizzard Warning. 1/3/2018 1/7/2017.png.eb2b175b71365d10679b3c1bd1ac6f0e.png)
-
Richmond Metro/Hampton Roads Area Discussion
RIC Airport replied to RIC Airport's topic in Mid Atlantic
Wakefield just sent out the January Summary. February may deliver way more snow, at least we hope. -
Richmond Metro/Hampton Roads Area Discussion
RIC Airport replied to RIC Airport's topic in Mid Atlantic
As promised, here is the Norfolk list, beginning with the most recent. I did 2 inches or more since 4 inches + was shorter than Richmond's. I'll probably do 2" or more for both cities for March, which I'll post in the coming days. Data was less kind after about 1990, and neither city has had much snow in February since 2015. February Snowstorms 2" or more at Norfolk (since 1891) 5.6” February 25-26, 2015 2.1” February 24, 2015 3.6” February 16, 2015 3.8” February 9-10, 2011 2.2” February 15-16, 2004 3.9” February 16, 1996 7.1” February 3-4, 1996 9.0” February 24, 1989 15.4” February 17-19, 1989 5.2” February 5-6, 1984 6.5” February 9-10, 1980 12.4” February 6-7, 1980 7.0” February 18-19, 1979 5.1” February 7, 1979 6.2” February 2, 1978 3.9” February 10, 1973 2.1” February 4-5, 1971 2.6” February 3-4, 1970 2.0” February 29, 1968 5.1” February 9-10, 1967 3.9” February 14, 1965 3.6” February 11-12, 1964 6.3” February 26-27, 1963 3.9” February 13, 1960 2.1” February 3, 1951 12.4” February 10-11, 1948 5.8” January 31-February 1, 1948 4.2” February 23, 1947 5.8” February 27-March 1, 1941 6.0” February 28, 1937 11.0” February 7, 1936 6.0” February 25, 1934 2.0” February 9, 1934 2.9” February 13-14, 1929 3.0” February 27, 1924 2.0” February 5, 1923 6.0” February 15, 1922 2.8” February 5-7, 1922 5.1” February 13-14, 1916 3.0” February 24, 1914 3.7” February 13-14, 1914 4.0” January 31-February 1, 1910 2.5” February 20, 1907 3.1” February 26, 1904 7.0” February 10-11, 1904 8.8” February 15-17, 1902 6.0” February 23-24, 1901 13.5” February 11-14, 1899 2.8” February 16-17, 1895 5.6” February 7-8, 1895