

Fozz
-
Posts
32,608 -
Joined
-
Last visited
Content Type
Profiles
Blogs
Forums
American Weather
Media Demo
Store
Gallery
Posts posted by Fozz
-
-
19 minutes ago, Jersey Andrew said:
But NYC capitalized in late February and then Boxing Day Blizzard. I lived outside the city at the time and that six year period 2010-2016 was beyond amazing for snowstorms.
Yes they had an incredible run. So good that they surpassed the average snowfall for State College for a little while, which used to be unheard of.
-
31 minutes ago, LeesburgWx said:
Ok cool, so breaking this down further, this means my popcorn eating entertainment of weenie meltdowns is likely going to be best found in the NE/Bos area forum if this pattern sets up as advertised.
You should've been around in 2010. The New York crowd really lost it when Feb 6 2010 completely screwed them over. Most of New England (outside the mountains) got screwed over and over again throughout the season.
In the end, I almost felt bad for them. Of course, the key word is almost.
-
 1
1
-
 5
5
-
-
1 minute ago, pazzo83 said:
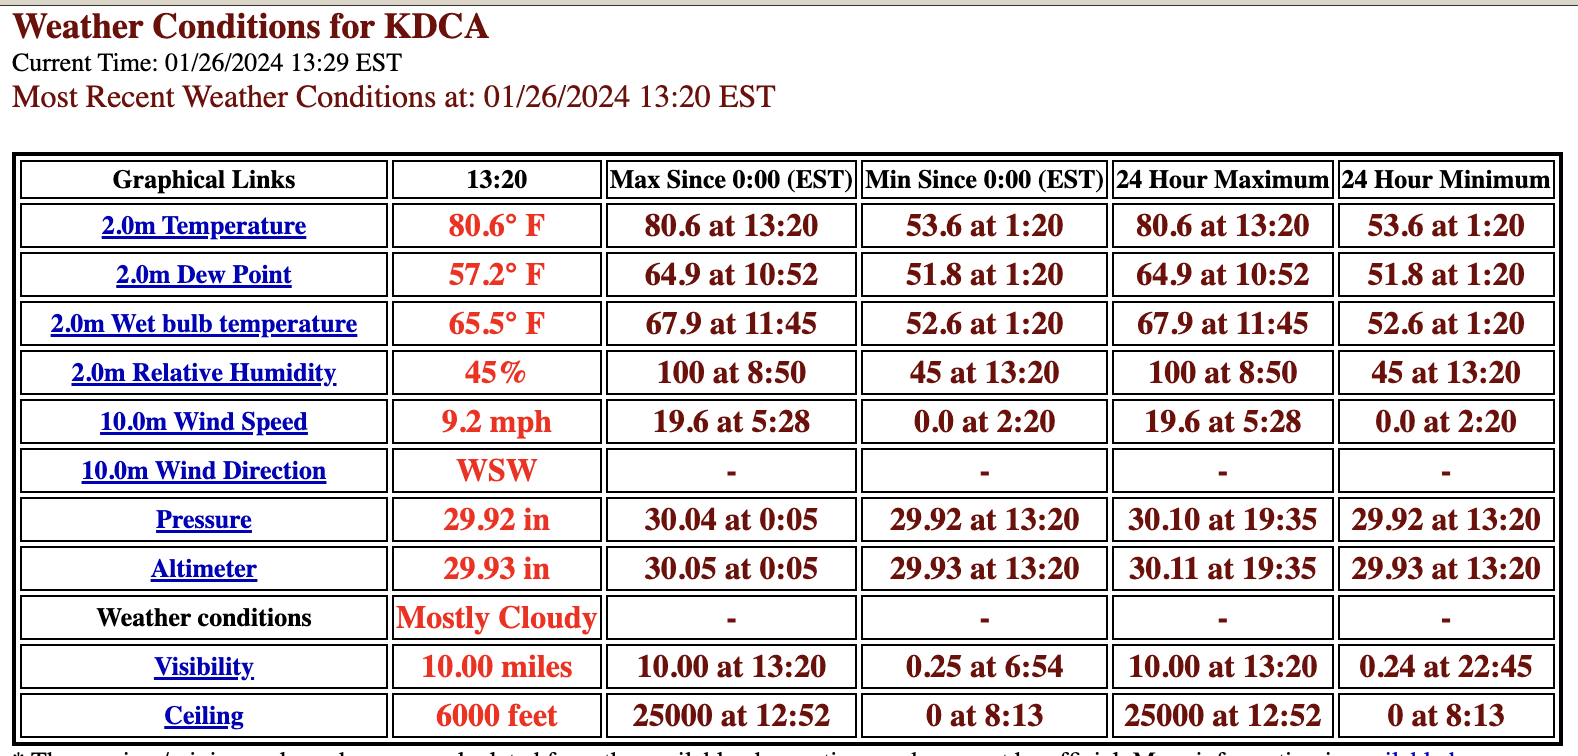
looks like BWI also just set their all time monthly high - 77F.
I’m surprised… I could’ve sworn we had some upper 70s January days in the past. I wouldn’t put it past BWI to hit 80 today but will probably just fall short.
-
32 minutes ago, pazzo83 said:

It’s a historic day (in a sad way imo) for DC’s climate history. There’ve been many close calls even in the distant past, but I’m pretty sure today is the first time DC has ever recorded 80 in January.
-
 2
2
-
-
These March 2001 jokes just don’t hit the same way for those of us who are under 35
-
4
-
1
-
-
11 minutes ago, CAPE said:
Could head out to Canaan to chase an inch?

Might as well just head to the Poconos instead
-
Just now, CAPE said:
This has been showing up on guidance for awhile now. Probably our first legit shot at something, despite marginal cold air availability.
I'll be out of town so you can bank on it.
3-6" for the coastal plain and 6-10" N/W is my first call.
-
 1
1
-
-
10 minutes ago, Terpeast said:
Yep, I was here visiting my mom for Jan 2016. But I didn't post much here because I was going through some personal stuff (a divorce)
I did enjoy the storm, we got about 30"
That's amazing. Hope we can get something similar this month.
-
4 minutes ago, Terpeast said:
Agree. Droolworthy. If this H5 anomaly map verifies for a full month, and we don't get a HECS - or at minimum - a top 10 KU, I would be disappointed. Very disappointed.
Yeah we'd better get a big one. Were you here in Jan 2016?
I know you missed out on a lot of them, except Dec 2009. And even for the rest of us it's been 8 years now. I will say I haven't felt this confident about it since 2016.
-
2
-
-
12 minutes ago, AtlanticWx said:
wait i thought it was tho? didn't it reach 1.5 C at one point
It was a strong Nino but not a super Nino.
-
Looks and feels almost like last week didn't happen at all.
Yesterday was really the last day of the snowpack and the day it basically disappeared. Now we have very few traces remaining. It was a solid 9-10 days.
-
1
-
-
2 minutes ago, IronTy said:
Does that translate to 7" at DCA?
A 40” season in psuhoffman’s area is just slightly above average.
But a 40” season in DCA is historic.
-
1 minute ago, mattie g said:
I'm not well-versed enough to know just how good a look is. I mean...I know when something looks good, but just how much better can the one in WW's post above get?
I’d like to see lower heights near NF and not a WAR if you want to be super ambitious. But overall it’s a great look for a 1 month period.
-
 1
1
-
-
6 minutes ago, Ji said:
then 95-96 after 94-95.....2003-04 after 2002-03.... 73-74 wasnt awful.....
How did 2016-17 end up so atrocious?
-
1 minute ago, pazzo83 said:
it's representative of the million people who live in DC/Arlington/Alexandria, with some minor variation. It's not supposed to represent some way out suburb. We had these same arguments in the NYC forum where folks in like way out NW NJ were pissed at Central Park's climate record/obs/whatever. Well ok, it's the climate site for NYC not your random suburb. Sorry.
Yes it is representative of most people who live inside the beltway, though even there DCA seems to be on the lower end of the range.
But that’s very different from representing the entire DC/Baltimore metro area. Especially when even people east of the fall line say that it doesn’t reflect their winter climate.
-
1
-
-
Mdecoy just needs to wait a few weeks then he won’t have to go very far to chase.
-
1
-
-
2 minutes ago, IronTy said:
Then who's data has been deemed acceptable for the subforum - can you provide it?
I think BWI and even IAD are much more representative of the region.
-
5
-
-
2 minutes ago, IronTy said:
I mean yeah, no duh areas north and west get more snow and later. But DC is the largest city central to this subforum and has good historical data so that's what I look at. If I'm looking for a 5" snow then ok, March is in the game...but a MECS or HECs...historically the odds are basically zilch.
DCA is not representative of this region and should not be used to generalize the winter climo of the whole area. It has good data but it’s a very warm spot at zero elevation on a river in the center of a heat island.
-
8
-
-
14 minutes ago, IronTy said:
There has been a number of posts about how we're still in the game well into March in this thread. So I went and looked at historical snow totals at DCA by month. According the the data I saw, we've only gotten double-digit snow totals for the entire month of March twice in recent eras. Once I think was 2014, and before that it was either was like 1959 or 1969 or somewhere there about. So I don't get where the March optimism comes from.
The March optimism comes from the longwave pattern that is projected all the way until at least mid-March.
DCA averages around 12” for the whole season, so it will really take a lot to get nearly a whole season worth of snow in just the last 2-3 weeks of it being realistically possible to snow.
Also, places north and west of DCA do a lot better in March than DCA does. IAD has had many more double digit March totals than DCA since 1960. If you’re in the coastal plain then you might need to temper your March expectations but even then the first half of the month can still work. -
Just now, Ji said:
Giving psu Feb 2003 vibes
Sent from my SM-A515U using TapatalkYeah I didn't want to say it but if everything goes our way this could be an appetizer for something bigger down the line.
-
1
-
-
GFS is showing a possible signal for the week of Feb 5th.
ETA: looks like a suppressed southern slider. Probably worth keeping an eye on that window.
-
2
-
-
Weeklies are showing a very strong signal for the VDay to PD period, especially with such strong mean height anomalies 3 weeks out. Also could be a 50/50 low. Everything looks locked and loaded.

-
12
-
-
If this turns out the way the Euro weeklies are advertising, then a 30”+ season for the cities should easily be in play. Maybe 40+ if we get a HECS.
-
6
-
1
-
1
-
-
21 minutes ago, Blizzard of 93 said:
The Euro weeklies then lock the good pattern in from the second week of February through early March.


Seems like the weeklies just lock a very stable eastern trough and Greenland block throughout the whole run.
Can it be trusted that far out, or is it simply projecting based on Nino climo?


Jan/Early Feb Medium/Long Range Discussion Part 3
in Mid Atlantic
Posted
Honestly they probably had multiple storms with those rates, so I can't say. I'd guess either Boxing Day 2010 or Jan 2011.