
40/70 Benchmark
-
Posts
72,920 -
Joined
-
Last visited
Content Type
Profiles
Blogs
Forums
American Weather
Media Demo
Store
Gallery
Posts posted by 40/70 Benchmark
-
-
54 minutes ago, TauntonBlizzard2013 said:
4.16
1.66
Boned again.
-
I know Chris was not in this camp, but I remeber when a large contigent of folks were theorizing that the favorable extra tropical Pacific last decade was a semi-permanent change due to CC, too.
-
 2
2
-
-
12 hours ago, Stormchaserchuck1 said:
Check this out Ray.. PDO and SSTs across the Tropical Pacific to Indian Ocean in May-July clearly lead it

You mean there is a positive correlation between the equatorial Pacific waters during the summer and the subsequent winter season NAO?
-
I really don't understand how waiting for more data and a larger sample can be wrong.... I don't disagree regarding what has been happening, but I think any implications concerning the future, aside from general warming, need to be tempered for now.
-
 1
1
-
 1
1
-
-
6 minutes ago, bluewave said:
My point is that any winter month when some portion the coldest departures in the Northern Hemisphere are found in the CONUS is becoming less frequent. Plus when you add a less intense cold pool like last January centering in the U.S. the results aren’t as extensive or intense as past instances.
The cold pool departures last January were much less impressive than the last time the coldest departures were in the CONUS like February 2021 and February 2015.
Getting a replica of 2015 has several challenges that I can see. First, the planet has had two tremendous baseline jumps in background temperature during 2015 into 2016 and an even greater jump the last 2-3 years. So this naturally weakens the cold pool.
Second, the more extensive warming of the WPAC has been associated with a faster Northern Stream of the Pacific Jet. The faster jet keeps sending pieces of energy into the NEPAC blocking causing it to weaken. So we haven’t able to reach the blocking levels there we saw in 2013-2014 and 2014-2015. This was the case over the recent 2024-2025 winter.
Third, getting a weak Modoki El Niño like February 2015 has been a challenge with the WPAC warm pool expansion. So the attempts in 18-19 and 19-20 didn’t work out.
Yes, this also plays into the pattern, which has sucked for the past 8 years or so. I understand that although you won't admit it, you strongly hedge towards this being permanent. I am not there yet.
We will find out in a few years.
-
6 minutes ago, PhiEaglesfan712 said:
What's impressive about the 2014 and 2015 cold outbreaks is that they didn't really get going until after the new year, and they went on for 2-3 months, not really letting up until the end of March.
I don't think anyone entirely understands the factors that determine how impressive the cold source becomes for a given season...while we can be sure that the trend is for it to become less impressive, its not a perfectly linear progression, so any given year moving forward may have a more impressive reservoir to tap.....though clearly the odds diminsh with time.
-
28 minutes ago, bluewave said:
The patterns we get are the function of the warmer temperatures and higher overall 500 mb heights. So the ridging potion at 500mb occupies more real estate than the troughs. Smaller troughs or cold pools have less overall cold.
The Northern Hemisphere cold pool was near the lowest on record this past winter. This is why even though the coldest temperatures on the planet in January were located in the CONUS, amount of cold was so limited that the monthly cold ranking for the CONUS was only the 33rd coldest January. It’s also why Canada was so warm with a record low sea ice on Hudson Bay. The cold into the Northeast was very limited relative to other times the coldest temperatures in the Northern Hemisphere were in the CONUS.
Okay....so the earth is warming. Thanks for the striking revelation.

My point is that while a relica Feb 2015 pattern wouldn't be as cold as it was then, it would still be much colder than this past January. I get the impression that you think that it would be similar to this past January and I have to disagree. The PNA (west-biased) and WPO were ideal for cold delivery to the NE US that season....last year they were not.
-
11 hours ago, Stormchaserchuck1 said:
A big part of the "heatwave near Japan" has kept the WPO +

It doesn't just effect the PNA.
That is precisely what I have been saying....the persistent +WPO is a byproduct of the west Pac heatwave.
-
4 minutes ago, bluewave said:
I would have to disagree with you. The shrinking cold pool makes it difficult for any combination of teleconnection indices to deliver the coldest departures into the Northeast during top 20 monthly and seasonal Arctic outbreaks for the CONUS and Northeast.
Getting a so called right combination of teleconnections becomes statistically more difficult. The closest we came was January 2022 at the 21st coldest January in the Northeast since 2015. If the Arctic outbreak from late December into January 2018 lasted longer than we could have pulled it off.
But this diesnt mean that it’s impossible, just statistically more difficult. We’ll see if we can sneak one in during the coming years. Obviously, it could require a major volcanic event.
I don't understand what you are disagreeing with....if getting cold into the northeast is becoming more difficult, but admittedly not impossible, then how on earth do you contest the notion that the pattern has has some influence independent of the background warming??
Makes zero sense.
-
1
-
-
2021-2022 was the only -WPO winter since 2016-2017.
-
6 hours ago, bluewave said:
The coldest departures have been finding a way to miss the Northeast like with a +PNA in January 2025 and a -PNA in February 2021. Our last top 10 coldest month back in February 2015 was a strong +NAO. But if the cold pools were bigger in January 2025 and February 2021, then the Northeast would have been much colder. February 1979 was one of the lowest February -PNAs at -1.82 and still stands as the coldest 2 week period since the 1960s on Long Island.
Minimum 14-Day Mean Avg Temperature
for ISLIP-LI MACARTHUR AP, NY
Click column heading to sort ascending, click again to sort descending.1 11.4 1979-02-06 through 1979-02-19 0 2 11.5 1979-02-07 through 1979-02-20 0 3 11.9 1979-02-05 through 1979-02-18 0 4 12.5 1979-02-08 through 1979-02-21 0 5 13.4 1979-02-04 through 1979-02-17 0 6 13.8 1979-02-09 through 1979-02-22 0 7 14.6 1967-12-31 through 1968-01-13 0 8 14.8 1967-12-30 through 1968-01-12 0 9 15.0 1979-02-03 through 1979-02-16 0 10 15.4 1979-02-10 through 1979-02-23 0 Yea, February 2015 had an immaculate Pacific pattern. I didn't say that the size of the cold pool doesn't matter...I said its BOTH, the pattern and the size of the cold pool. You seem to struggle to accept that.
-
4 hours ago, bluewave said:
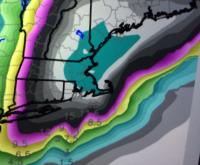
The storm track through the Great Lakes again greatly reduced the snowfall potential around the NYC Metro and other coastal regions. This is a great storm track for areas away from the coast as was the case with the record snows from Toronto to Montreal.
The cold focusing closer to the center of the North American continent has been a repeating theme since the big step up in global temperatures in 2015-2016. My guess is that the shrinking cold pool has been limiting the geographic coverage of these Arctic outbreaks. We haven’t had a top 10 coldest month in the Northeast since February 2015.
Its a combination of shrinking overage AND predominately -PNA/+NAO/+WPO.
-
35 minutes ago, CoastalWx said:
Only one doing that, is Ineedsnow
Eh....I may gave a quick rub n tug...
-
 1
1
-
1
-
-
11 minutes ago, dendrite said:
Record low maxes for today…
ORH 46
BOS 47
PVD 48
PWM 48
BDL 49
BTV 49
CON 51All except BTV occurred in 1909.
Must be CC.
-
 2
2
-
1
-
-
Just now, Typhoon Tip said:
just grousin'
I think we've been in it all week. Gaia's jammed our heads up its ass since Monday -
This would have been an awesome event in winter....I would have had 20", while Scooter had 5" of slush. Dendrite would have had a 30" deform band.
-
2 minutes ago, snowman19 said:
There’s a very huge difference between saying something is “likely” and being “confident” in a very cold and snowy winter and using 13-14 as an analog in May when the start of winter is 7 months awayI'm just joking...kind of, but its honestly true....tough to go wrong assuming -PDO and la Nina.
-
4 minutes ago, Typhoon Tip said:
meh, front versus back of the balls - even stench
To me there is a difference between cloudy with showers, and pouring rains with 50mph gusts, but yea...neither day is particularly conducive to rounds of naked corn hole....no.
-
1
-
-
54 minutes ago, jbenedet said:
Only consolation is this all started to roll in yesterday instead of Friday. Would have wiped the 4 day— MDW.
Today and tomorrow are worst and it’s a slow climb from there…
I think today is worst, and slow climb starting tomorrow.
-
1
-
-
1 minute ago, bluewave said:
Yeah, but Philly to NYC Metro would have had issues with the strong easterly flow.
Yes, absolutely....even Boston would have some issues.
-
27 minutes ago, snowman19 said:
You should be confident in nothing in May regarding how this upcoming winter will play outExcept a -PDO and cool ENSO
-
1 hour ago, bluewave said:
This happens every spring once the gradient between Siberia and the WPAC relaxes. So this is the normal seasonal weakening of the Pacific Jet allowing more cutoff lows. But even if this was January there would still be mixing issues near the coast since the primary low cut to the Great Lakes before the coastal got going. This would have been a great snowstorm for the interior regions and ski resorts.We can remember the big Nor’easter back on April 4th last spring.
It may also be easier to get the height rises near Iceland in the spring for more NAO dominant blocking due to the North Atlantic Jet also weakening during the spring as the gradient between the Arctic and equator weakens. Recent studies have found the North Atlantic winter jet has been getting faster.
4-4-24 Nor’easter
This system would have crushed interior SNE, including my area.
-
14 hours ago, PhiEaglesfan712 said:
2018-19 was a nearly identical winter to 2016-17. Both were C to C- winters, with a lot of nickel-and-dimers, but no real snowstorm. Both are notable for having their most notable storm outside of the DJF period (18-19 in mid-November, and 16-17 in mid-March). 18-19 did have its moments of cold (November and March were well below average, and DJF was only about +1, +2 above average), while 16-17 was a blowtorch pretty much all winter (with the exception of March).
SNE did significantly better in the former....near average snowfall in 2016-2017.
-
-

May 2025 Obs/Discussion
in New England
Posted
Kind of reminded me of April 1, 1997, too.