
JC-CT
-
Posts
17,866 -
Joined
-
Last visited
Content Type
Profiles
Blogs
Forums
American Weather
Media Demo
Store
Gallery
Posts posted by JC-CT
-
-
Just now, dryslot said:
It has that "flaccid" look to it.
He might "limp" his way to a warning event
-
Just now, dryslot said:
lol

Kevin really gets the "shaft" there
-
 1
1
-
-
1 minute ago, ORH_wxman said:
Yeah I agree it looks a bit better.
I look at the ICON for giggles because it's there now, caveat that I think it is a horrible model. But look how much different the 12z run initializes the northern stream in Canada vs the 12z NAM. None of the models have a clue what is actually up there.
-
can only compare the black and whites to 0z, but the 12z rgem at 24 hours is definitely more phased than 0z
-
1 minute ago, NeonPeon said:
Hoping to jackpot
hereis a recipe for disappointment.fyp, and I agree
-
1 minute ago, NeonPeon said:
I like where I'm at, but I think banding will favor just east and just west of here, and its just starting to show in the models.
a bit self-contradictory unless you hate snow.
-
4 minutes ago, dendrite said:
He has those fronto maps on TT now so he doesn't have to wait for a text from Shabbs. Of course that's just H7 so the banding could be a little west of the best H7 fronto. IOW, the NAM has it west of him. lol
Do the best VV line up just west of the frontogenesis?
-
2 minutes ago, Ginx snewx said:
Still think 6-12 CT river to RI Border 12+ east of there
Just say it..."I agree with Kevin"
-
There is some nice banding across the center of CT that run.
-
1 minute ago, CoastalWx said:
If that thing slowed.......
or if the northern stream s/w came in a bit stronger for a sharper trough and earlier capture...
-
Just now, CoastalWx said:
srn s/w is a hair faster than 6z, but nrn stream better. Not sure if it means much yet.
It probably means it will go to town for the coastal plain but sharper cutoff to the west.
-
Just now, Weenie said:
It's definitely 2-3mb stronger and slightly farther west
look at the 500mb height and vorticity maps.
-
I actually think the NAM will have a better phase this run.
-
2 minutes ago, Weenie said:
Just amateur observations but not only is the HRRR trending west by 50 or 60 miles every run, but the trof is digging down slightly further each time. Probably just noise though
I noticed it too. Not just at the end of the run.
-
 1
1
-
-
3 minutes ago, OceanStWx said:
Well not all CDFs look like a perfect bell curve like I described.
Some have a big low end tail, but a sharp high end. Sometimes all models say rain and there is no CDF to work off of. It’s definitely not a fool proof system, but it can provide some windows into the guidance.
It works best for large, widespread snow events.
So it is a true CDF based on models?
-
1 minute ago, dendrite said:
PF just had a stroke
He's expecting 2' of powder and ends up with a coating lol
-
Just now, Chrisrotary12 said:
Here is the map that I ran with for my blog yesterday afternoon.
That's solid for SNE outside the berks. I think you missed the upslope potential though.
-
Just now, OceanStWx said:
Right. The only “setting” we do is by moving our expected amount.
If the CDF has a 12” range, and our expected was 8”, the max/min would be something like 2-14”.
If we then decide to increase snow amounts to 11”, that max/min becomes something like 5-17”
How does it sometimes end up that the expected will be almost exactly the high range, like 10" expected with a high range of 11", but the low range will be like 2" or something?
-
Just now, Hoth said:
We'll just set our expectations low and hope for a surprise.
Dylan's map is reasonable IMO as long as someone doesn't look at it and only see the high end of the range.
-
1
-
-
1 minute ago, Hoth said:
Well, first off, congrats to NoPoles and Jimmy for finally catching a break. Second, my visual hallucinations continue. Looks to me like the n/s is already starting to slip down the backside of the s/s. I just keep thinking, "how is this not coming more west?"
Hey, I was considering posting about it but then I thought it was so low probability that it wasn't worth it to weenie over. But if there are any tricks left up this one's sleeve, it is with the northern stream. A lot of it hasn't been raob sampled yet, including the energy that creates that late diving shortwave, which could affect the trough orientation ever so slightly one way or the other.
-
4 minutes ago, OceanStWx said:
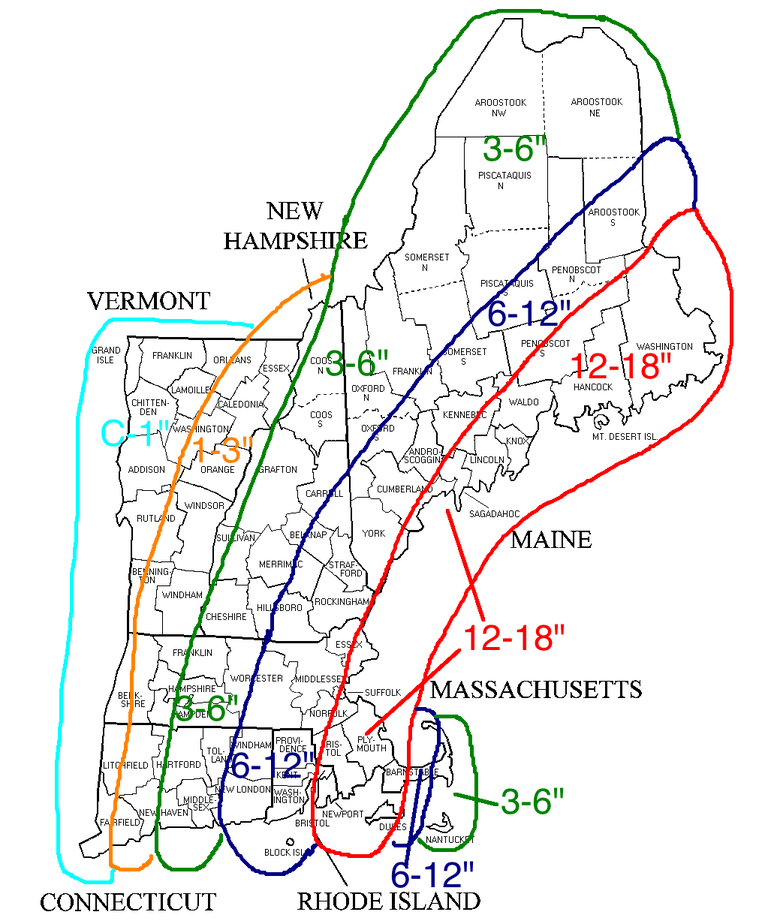
The basic premise is we create a snowfall forecast. WPC has an “ensemble” that is a blend of many models. From that blend they develop a cumulative density function that is the total range of snowfall amounts. Our forecast becomes the center of that CDF. And the 10/90th percentiles of that CDF are the maps you see.
So if we shift the forecast, that shifts the 10/90th percentiles.
But you aren't setting the high and low maps yourself, right? I feel like the confusion is that people think there was any thought put into them. I am under the impression that the only thing the local office controls is the expected amount.
-
3 minutes ago, OceanStWx said:
It’s a combination of all guidance (some
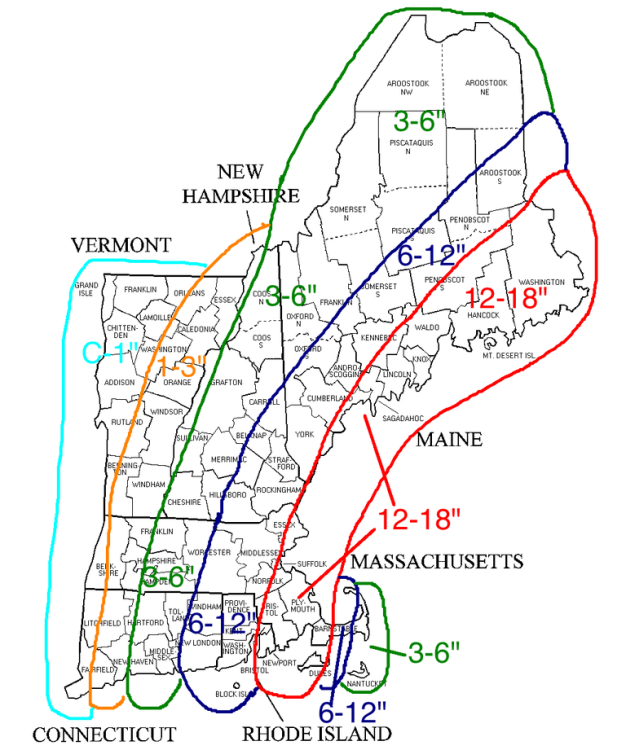
good, some bad). So it incorporates all whiffs, amped runs that rain on the Cape. So one way to look at it is this is showing is the highest confidence for significant amounts of snow is that 6” area. Basically that’s their high floor.
It's computer generated from wpc ensembles? I thought I read that somewhere
-
25 minutes ago, CoastalWx said:
It make sense, it's saying this is the least likely scenario.
Chris has told us a few times that they have no control over those maps, they are based on WPC as compared to the local office forecasts or something.
-
Just now, codfishsnowman said:
you said 6-12 back to Albany lol at one point
But the low end was always for you regardless.
-
1
-

March 13th ... west Atlantic bombogenesis type low clipping SE New England, more certain ...may be expanding inland
in New England
Posted
the ggem
holy ridiculousness