

TWCCraig
-
Posts
2,572 -
Joined
-
Last visited
Content Type
Profiles
Blogs
Forums
American Weather
Media Demo
Store
Gallery
Posts posted by TWCCraig
-
-
HRDPS has 95 for BDL (Windsor Locks), Connecticut tomorrow. BDL is sitting at 92 right now so mid 90's for tomorrow would be a good bet there. Crazy to be talking temps near 100 degrees in New England in April
-
 2
2
-
-
Solid 80 degrees here still with good breeze off the water
-
82 and sunny
67 degrees just a couple miles to my SE. Happy to not be in the sea breeze today!
-
1
-
-
72 and cloudy
-
NYC is currently tied with 2012 for the warmest January 1st-March 30th period on record.
Click column heading to sort ascending, click again to sort descending. RankEnding DateMean Avg Temperature Jan 1 to Mar 30Missing Count1 2023-03-30 43.1 1 - 2012-03-30 43.1 0 3 2020-03-30 42.4 0 4 1990-03-30 42.1 0 5 1998-03-30 41.7 0 6 2002-03-30 41.4 0 7 2016-03-30 40.2 0 8 1949-03-30 40.0 0 9 2006-03-30 39.8 0 - 1991-03-30 39.8 0 11 1953-03-30 39.7 0 -
1
-
 2
2
-
-
Down to 32. Moderate snow, coating on most surfaces, streets wet
-
Need your snow fix? Here's a live feed from Maine with lots of deer. If only it was here!
-
3
-
-
5 minutes ago, psv88 said:
Mix line is in central NJ, unlikely it’s sleet
Pretty sure it's ice pellets. Under decent radar returns right now but my visibility is pretty high. I was under heavy snow before
-
2
-
-
1.5" OTG
Snow/sleet mix
-
2
-
-
Most roads covered except avenues and highways. Even those have some snow. Dumping
-
Heavy snow and breezy
-
Solid coating down
Moderate snow
-
1
-
-
Mostly snow now!
-
Just drove down the Sagtikos, middle of island is mostly snow. Once I got to the south shore it was mostly sleet
-
1
-
-
Just now, TugHillMatt said:
Saw this map...do you guys really have "leafout" there in NYC already?
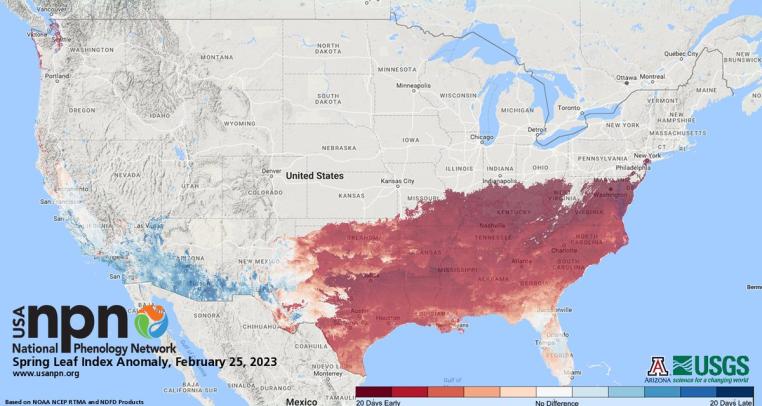
No leafout but silver maples are budding and daffodils are sprouting
-
1
-
1
-
-
The difference is probably resulting from using different climate averages. Tropical tidbits looks to be using CFSR 1981-2010, Weatherbell is using ECMWF ERA-5 1991-2020. Weathermodels.com appears to be using some 20-year average. The differences could also be resulting from whether it's a instantaneous snapshot of temperature anomalies, or the average of the anomalies over the past 6 to 12 hours
-
High of 69 and dropping now with increasing clouds and a sea breeze, so I've never got into the 70's but glad to see ISP's record fall. HRRR, RGEM, HRDPS did great with temps today
-
ISP at 69
Officially breaks the all-time warmest February temp on record. Original record was 68 set last year
-
3
-
-
Most sites on Long Island are 60+ already except Montauk. Already exceeding the lower-end model forecasts for today. RGEM, HRDPS, HRRR had the right idea. HRRR has 71 later for ISP. Would be the all-time record. We'll see, we have clouds and the sea breeze which could easily prevent that
-
1
-
-
HRRR has 70's tomorrow before some late afternoon rain moves in

-
1
-
2
-
-
-
If NYC doesn't get 8 more freezes by the end of the month, this winter (Dec-Feb) will have the fewest number of minimum temperatures below 32 degrees on record. NYC has 24 so far
December through February RankSeasonNumber of Days Min Temperature <= 32Missing Count1 2022-2023 24 18 2 1997-1998 32 0 3 2011-2012 33 0 4 2016-2017 35 0 - 2001-2002 35 0 6 2015-2016 36 0 7 2019-2020 38 0 - 1931-1932 38 0 9 1998-1999 41 0 10 1982-1983 42 0 If we count the whole season from fall to spring, 2012 looks tough to beat but top 5 is very possible
October 1st through May 10th RankEnding DateNumber of Days Min Temperature <= 32 Oct 1 to May 10Missing Count1 2023-05-10 27 89 2 2012-05-10 37 0 3 2002-05-10 47 0 4 2020-05-10 48 0 - 2016-05-10 48 0 6 2017-05-10 49 0 - 1998-05-10 49 0 8 1999-05-10 52 0 9 1983-05-10 53 0 10 1991-05-10 54 0 -
1
-
1
-
 1
1
-
-
60 and sunny
Awesome day
-
3
-
-
Just now, coastalplainsnowman said:
Is it noteworthy that Montauk hit 0 while White Plains only got down to 1? Westhampton hitting 0 I understand, what with its freakish radiational cooling, but Montauk? I thought that was interesting.
It wasn't the radiational cooling this time, it was cold air advection. The core of the cold was to our north & east, so places north & east saw colder temps than those further west.
-
2
-
.png.08657ae96d293ee71957c2560a527d37.png)
May 2023
in New York City Metro
Posted
Beautiful day, 78 degrees.
Take note, those "clouds" to our northeast are not clouds but smoke from wildfires raging in Alberta and British Columbia in Canada. Impressively thick smoke from thousands of miles away