
hooralph
-
Posts
1,317 -
Joined
-
Last visited
Content Type
Profiles
Blogs
Forums
American Weather
Media Demo
Store
Gallery
Posts posted by hooralph
-
-
Just recorded 100.3 in shade along Madison Ave at 75.
-
 1
1
-
-
2 minutes ago, LibertyBell said:
Why has Boston been hitting 100 more frequently than we have Don? They are to our northeast and the waters are much colder there.
Southwest wind blows heat from the city right across to the airport.
-
1
-
-
Just recorded 96 at Bethesda Terrace in CPK but there’s a breeze blowing at me from the lake.
-
-
-
-
I am here to bring you ground truth. Currently walking from Riverside across to east side.
first measurement 97.3 in shade on West End
-
1
-
-
It’s so much more tolerable this morning with the breeze vs yesterday.
-
12 minutes ago, LibertyBell said:
Thanks Ralph, I think you were the one who measured the actual snowfall in Central Park too!!
lol. No, I've never been that ambitious to trudge over there for a measurement. I just consider my Riverside Park measurements to be a good enough proxy.
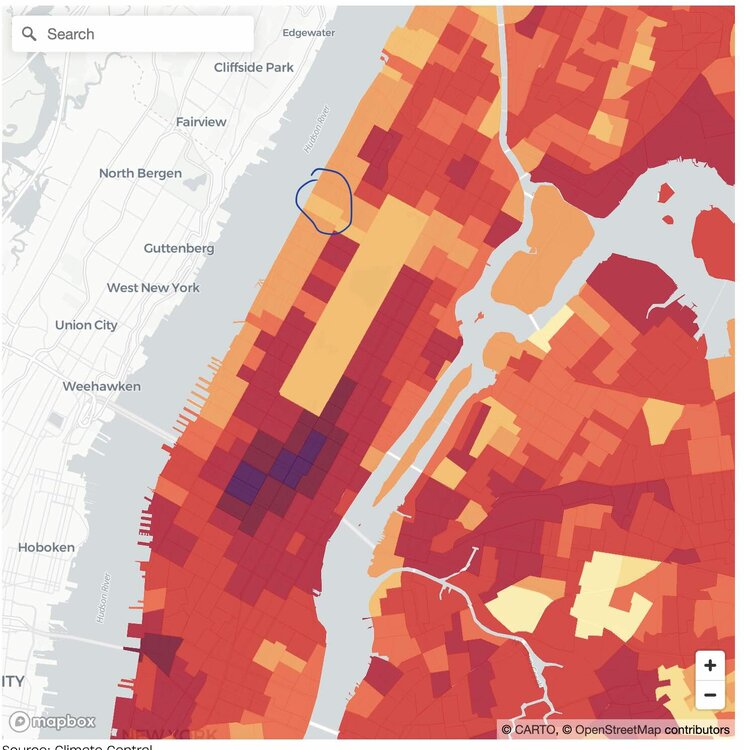
And honestly, the temp at my location might be one of the better proxies for CPK you'll find. Per this map from a few years ago we are lucky enough to live in one of the "coolest" spots in Manhattan - this little tongue that extends to the river in the low 100s.
-
 1
1
-
-
3 hours ago, LibertyBell said:
Maybe someone can take a digital thermometer into Central Park and take a picture of it in there like we sometimes do when there's an errant snowfall total there.
I might.
-
4
-
-
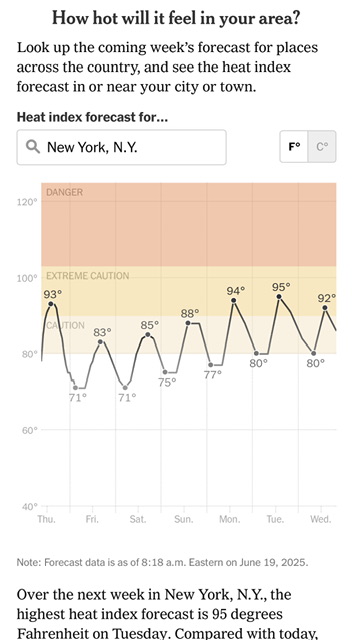
So ah, anyone know what the NYT uses for their model? Props to them for calling attention to the coming heat but… they have the heat index maxing out at 94/95 for NYC.
-
9 minutes ago, psv88 said:
NWS is running on fumes, we are lucky there are warnings at all.
Push alerts came in as it was pulling out.
-
Going to call out - in case we are tracking these things now: the severe thunderstorm warning area seems off (looking at RadarScope) - we had no warning here.
this seemed to not match radar:
* This severe thunderstorm will be near... Mott Haven and Midtown Manhattan around 1040 PM EDT. Laguardia Airport and Jackson Heights around 1045 PM EDT. East Tremont around 1050 PM EDT. Co-op City around 1100 PM EDT. City Island around 1105 PM EDT. -
Hail! and frequent lightning on UWS.
-
2
-
-
Wife and walked across Manhattan (from the Hudson to 1st Ave). On our way back we were in Central Park and I noted how it suddenly felt warmer - muggy - because the wind had stopped. Then the east wind started cranking. Amazing. A back door front reminiscent of Boston in April.
The CPK obs show it - wind was calm at the 16:51 reading and it was still 79.
-
Incredible, dense, shipwrecking fog on the Hudson.
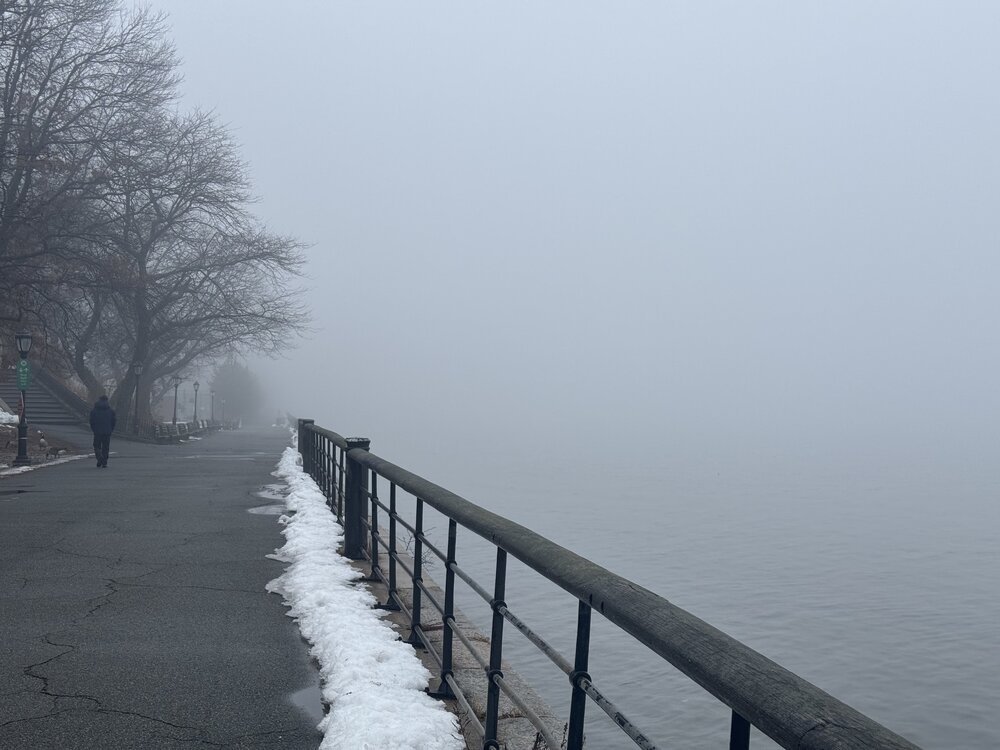
-
2
-
-
As soon as I hear "kicker" I'm out.
-
1
-
 2
2
-
-
-
Seems to be ending as a fine light snow. I’m guessing we pushed 3” here on UWS (saw the 2.8 at CPK which seems right for when it was reported). At least it’s not getting washed off the trees.
-
1
-
-
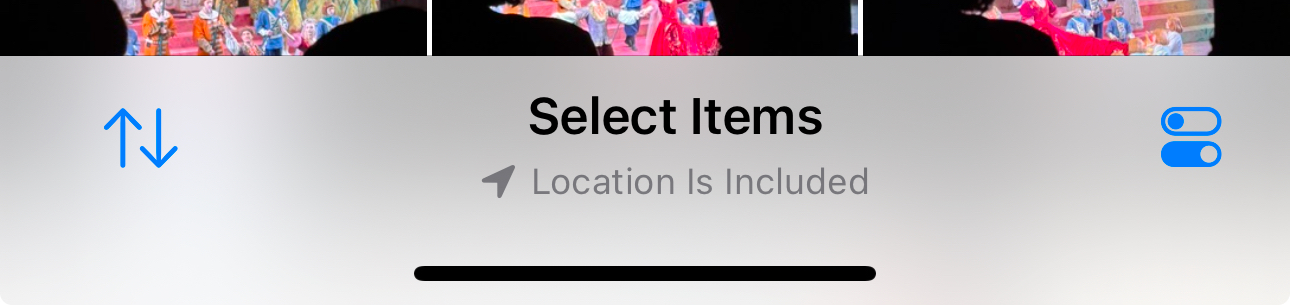
Re: picture uploads:
if you are on an iPhone using Safari, when you have the picture selection window open, there is a little toggle button in the bottom right. You can click that and select smaller file sizes.

-
Changed over to sleet on UWS at 9:45. I know because I went out for a short Jebwalk and was delighted to find it was still fluffy flakes. Within five minutes it was pinging on my hood.
I measured 2.5” on benches before the change over.
-
4
-
1
-
-
I’m excited for manhole explosion season here.
-
Forgive me if someone covered this but at CPK
- 30.0 avg temp for January
- -2.1 against average (32.1) going back to 1869, making it the 53 coldest out of 157.
-
-4 below average since 1990 (34). 8th coldest since 1990; only the following were colder:
-
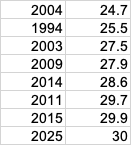
Also notable - out of that list, we move ahead of 2014 and 2015 when looking at high temperatures. (6th coldest avg high temp since 1990).
We will slide a bit to finish the month, but yes, it's been cold.
-
2 minutes ago, wdrag said:
You all are there. I kind of wish we had a camera on the board area 24x7 to match up to the ASOS there. I know there is UWS observer in our subforum. I cant keep up with all the chat here.
I also think the NWS and Feds at the White House could collaborate and get a daily observation going there using Climate accepted sensors and security vetted observation (security personnel?). The 0.4 at National doesn't seem representative of what I see on the White House lawn this morning. Minor point and not going to happen at both locations (CP and DCA) and this is why we regionalize snowfall info to not get to hung up on specifics. That harkens back to the PS/PC debate when we moved over to grids and wording from the grids.
I'll add the CoCoRaHs and NOHRSC snowfall analysis shortly for anyone to compare the initial thread ensembles vs reality and also the NWS multi sensor precip which showed 1/2" in the areas that I think got good banding, which also was well defined 24-48 hours in advance by the WPC snowbands extracted from the SPC HREF and confirmed by the FSU banding web site via the GFS.
I'm on the UWS, near the River, a little less susceptible to heat island, but more susceptible to any W wind and impact from the River. My tried and true method of sticking my fingers into the snow on benches and railings could not get me to 2".
-
1
-


Newark (interiors of NJ/se NYS/CT) Sun-Wed June 22-25 possibly hottest 3-4 day period this year (2025) with 2-4 100F+ days, possibly hottest June daily. NYC probably one 100 deg. HI exceeds 105 interior M-T June 23-24.
in New York City Metro
Posted
Just reached KNYC and it’s clocking a bit over 97 at the moment. In fairness, the station gets a bit of sun as you can see. It’s not shrouded in the trees. General assessment from my walk: 99-100 in the blocks on the UWS and 97 ish in the park.
the 100.4 was Madison Ave