
f2tornado
-
Posts
290 -
Joined
-
Last visited
Content Type
Profiles
Blogs
Forums
American Weather
Media Demo
Store
Gallery
Everything posted by f2tornado
-
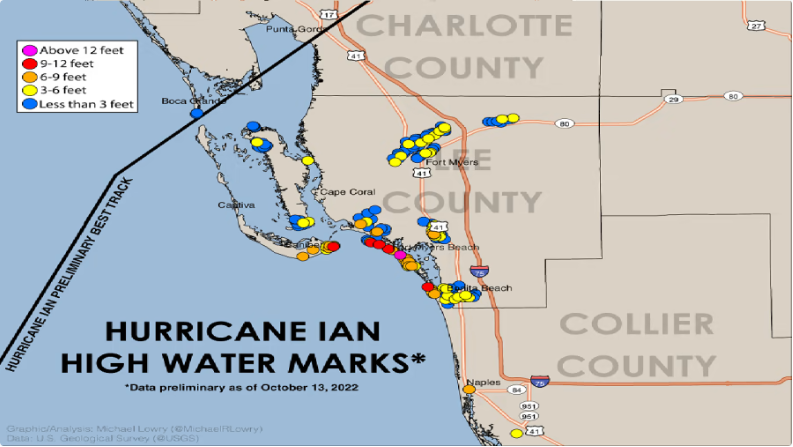
A highly localized area from Ian exceeded 12 feet that and aided by the bite shaped coast that makes a good collector of water. The RFQ of Ian was also more intense than Milton in terms of peak winds.
-
The shape of the coast immediately south of the landfall point is not as conducive to massive surge like would be possible in Tampa, Charlotte Harbor, or around Cape Coral. That said, I'm sure someone along Mansota got a significant beating regardless. The hype was legit. It just happened the storm took about as good of a track as it could to minimize absolute dollar value loss from storm surge. On the flip side, the track resulted in about a worst case scenario for flash flooding in the Tampa area. A lot of people are going to return home to big messes.
-
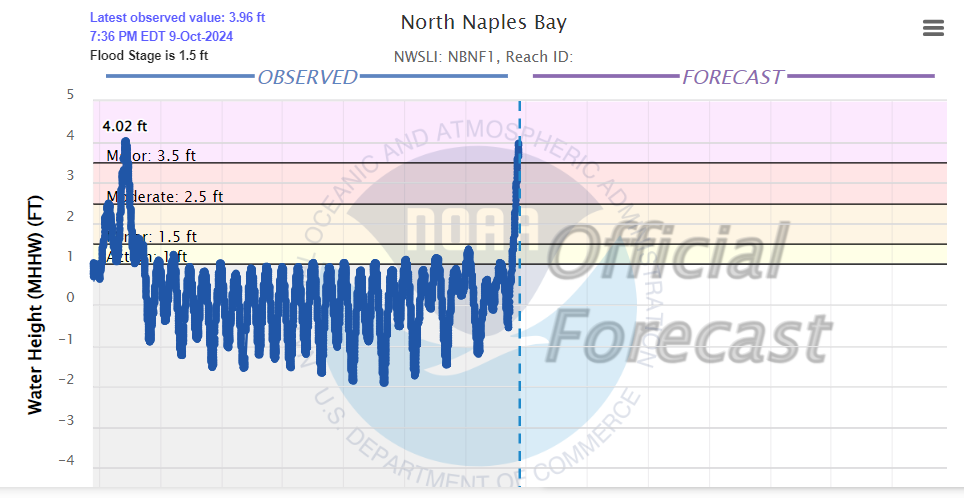
Naples up to 4 feet surge and rising rapidly,
-
Sure looks like that forecast bend to the right is occurring. If it holds, it spares Tampa from the worst surge effects but puts them square in the firehose. The overland flooding still do a lot of damage in that area. Starting to see water rises at Venice and Naples.
-
Wind is coming right off the bay.
-
But, they are progressing toward more populated areas along US 27. The entire SPC Tornado Watch area is primed.
-
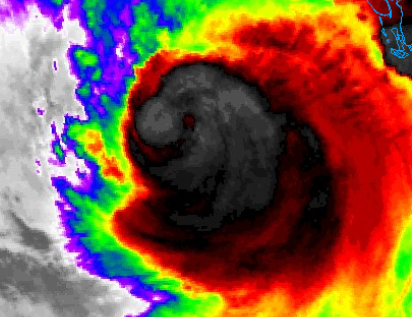
Maybe getting better defined on the IR but hard to base that on just a couple frames. Pretty small if the little "warm" spot is where its at.
-
It's certainly useful for mesoscale parameters. STP is bonkers this afternoon. Potential, if not probable, tornado outbreak.
-
The NAM is not a tropical model but offers disaster porn by taking a small eye the full length of Tampa Bay to go with 112 kt wind gusts in Tampa. For whatever reason, it doesn't suggest dramatic weakening prior to LF. The GFS is very similar on track and also looking relatively stout at LF.
-
In the synoptic realm, 977 is plenty for synoptic/global models to handle. That's a banger in the mid-lats. It's the smaller less mature storms models tend to be "screwy" with.
-
The 18z GFS mirrors the 12z ECMWF and is is spitting image of Project Phoenix 2.0. The 00z guidance may give us a better picture with a fresh set of obs and a fully bombed out storm. Of course, what's good for Tampa, if it transpired, would be bad for Fort Myers.
-
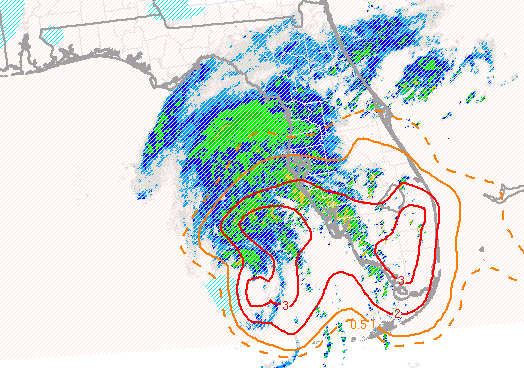
It's not the beatuty it was Wednesday morning but the coldest tops I've seen all day are sprouting near the center. We should see some enhancement as we get closer to the diurnal max. Model guidance ramps up the wind field in the right quad later tonight into the morning. Not exepecting much in the way of max wind increase but have a feeling the surge in Georetown vicinity could be fairly impressive given what must be a massive amount of IKE around this thing.
-
I didn't say that. I even said it's worthy of discussion (implying it's banter thread material). But, attributing one potent hurricane to climate change during a cold ENSO phase without supporting evidence is speculative junk "talking points" science.
-
Straight out of a talking points memo? A hurricane is weather, just like when someone in Chicago asks about that global warming when it's 20 below. That's weather too. Sea level rise is a worthy discussion, but not here, though I doubt the 2mm/yr rise changed the outcome much here.
-
Cape Coral cam definitely has water rising. https://www.webcamtaxi.com/en/usa/florida/capecoral-chiquitalock.html
-
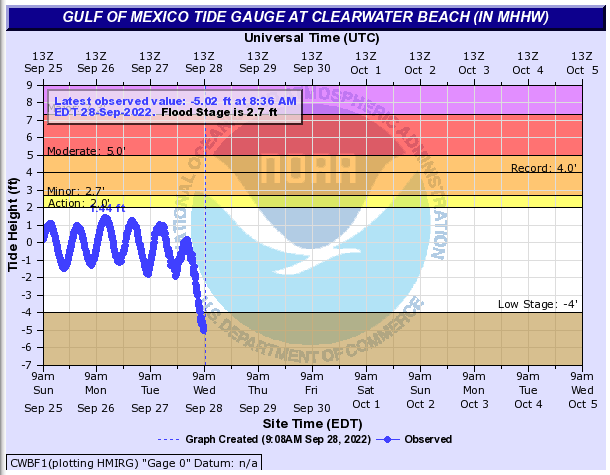
Potential record negative surge in the Tampa area. That's not good for what's on the other side.
-
Be careful what you wish for. The Hoover Dike around Okeechobee is widely considered one of the nation's most at risk to fail. Refer to the 1928 storm for a what if scenario.
-
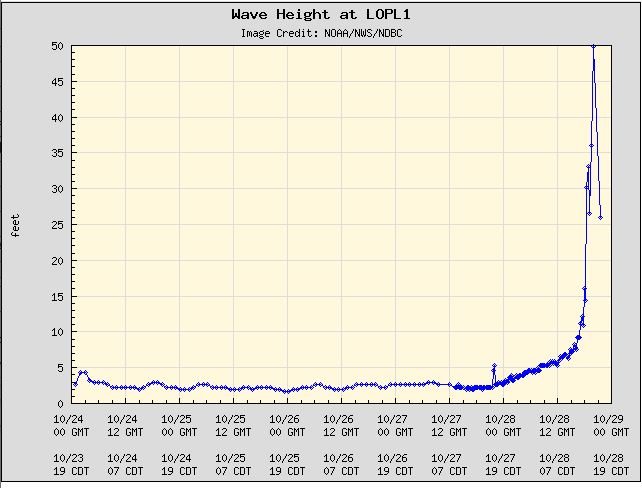
50 foot wave hit offshore platform. There is apparent video on Twitter.
-
Strongest radar echo about to hit the skyscrapers downtown NOLA. Can add an SS category for those winds. Bourbon Street cam doesn't look too crazy yet.
-
Bryan Norcross discusses this specific communication problem in a 2017 writing. This is a less elegant piece than I'm accustomed seeing from him. He has a number of good pieces easily found with a Google search showing where improvements in communication and could be warranted.
-
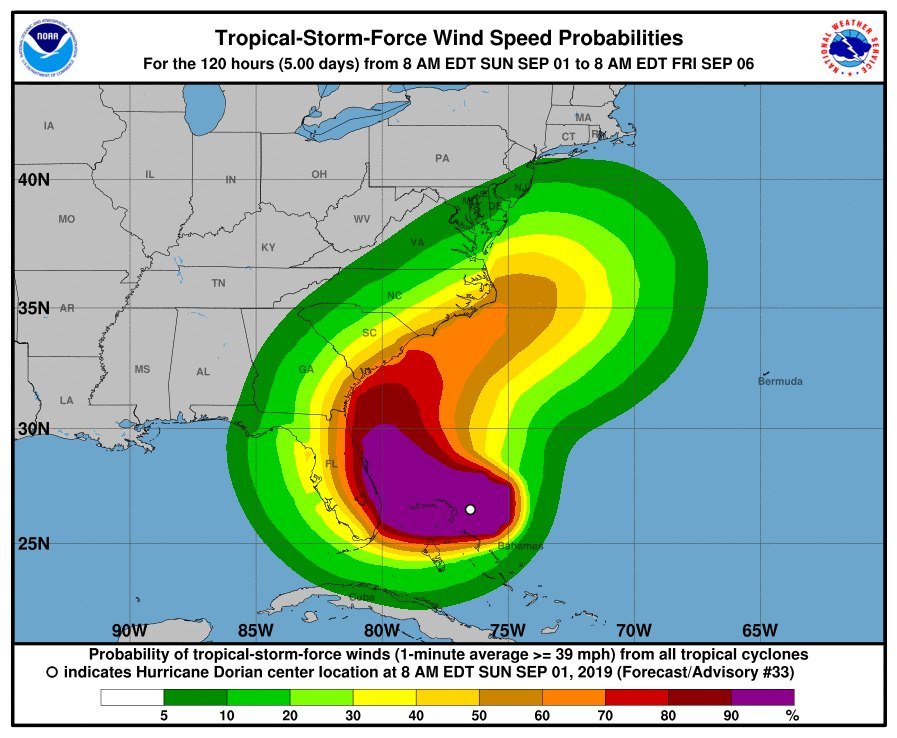
This will not be a popular opinion here. The BMX tweet would have been the end of it however ABC Nightly News turned the tweet into a hit piece on the President in an effort to stick him with a gaff. The President then lashed out at the reporter and the pile on began. I have rarely seen this kind of media passion to turn a nontroversy into a controversy. Consider the following published from BMX seven years ago AREA FORECAST DISCUSSION NATIONAL WEATHER SERVICE BIRMINGHAM AL 626 PM CDT THU AUG 23 2012 TROPICAL SYSTEMS ARE NEVER BORING OR EASY TO FORECAST AS ISAAC CONTINUES TO CHALLENGE. Kudos to the BMX forecaster who had the utmost confidence to publish an effective 0% forecast "no impacts... felt across Alabama" via Twitter in spite of the same office previously noting forecast difficulty with tropical systems. This conflicted, albeit slightly, with the NHC published probability distribution of TS winds covering a portion of AL. Further, it was somewhat inconsistent with the morning 9/1 Tallahassee AFD which covers southeast AL and stated, "The latest forecast for Hurricane Dorian from the National Hurricane Center continues to keep it east of the local area. While we still shouldn't let our guard completely down, the chance of impactful weather from Dorian occurring in our forecast area remains low". BMX should be no stranger to forecast uncertainty. Take a look at the forecast cone for Hurricane Isaac (2012) that at one time was nearly centered over BMX. In fact, the entire state of Alabama was enveloped within the cone before none of the state was in the cone. It should be noted, even though the entire state of Alabama was outside the forecast cone toward landfall, the Mobile area did experience some TS force gusts and impact from surge. The cone only represents the storm center forecast track. This is why NHC storm wind probabilities are smeared well outside the cone with time and why forecasters should be cautious speaking in absolute terms, particularly when the average error for a tropical system is about 200 miles on day 5.
-
Historic Tornado Outbreak April 27, 2011
f2tornado replied to CUmet's topic in Weather Forecasting and Discussion
The Fujita scale was a wind scale. Fujita linked up the Beaufort scale with the Mach scale. The F-scale actually went to F12 (Mach 1) but F6 was considered inconeivable (nor would resulting damage be recognizable from F5). Since wind could not be directly measured it was inferred based on damage. Even Fujita, before his death, realized his scale was not relevent to cheaply built suburban housing, hence the EF scale.


