

MANDA
-
Posts
3,030 -
Joined
-
Last visited
Content Type
Profiles
Blogs
Forums
American Weather
Media Demo
Store
Gallery
Posts posted by MANDA
-
-
Final call for my location 2-4. The 4 would be a gift. I think 2 to 3 will be closer to reality.
-
 2
2
-
-
16 minutes ago, sussexcountyobs said:
34.4" as we speak. Still have snow/sleet pack from yesterday. Everything is white and frozen solid. Currently 24°
Sitting at 25.4" here.
11/22-23/24 = largest event at 6.5".
1/20/25 = 6.1"
12/21/24 = 5.2"
Total 17.8" from those 3 events. The remaining 7.6" all came from 9 additional events that left 1.5" or less.
-
1
-
-
4 minutes ago, bluewave said:
Today is a great example of how much of a change can occur with an ensemble mean from 360 hrs to 240hrs. The biggest change at day 10 is the much deeper trough digging into the West around Valentine’s Day. So any speculation based on the present 360 hr run is going to look different when it gets to 240 then 120 and 0 hrs. This is why you want to maximize opportunities closer in since you don’t know what the pattern is going to look like from day 10 and beyond.
New run

Old run

To say there are some substantial differences on those two maps might be an understatement.
-
1 hour ago, BoulderWX said:
See ya on the next one. Some of us are quite happy with another couple of inches.
Hope ya get it on this first one.
-
1
-
-
1 minute ago, Stormlover74 said:
Seems most reasonable
Message from modeling last 24 hours is that any frozen accumulations (snow, sleet) will be light, on the order of 1 -2" for most locations. That is not to say it won't be a sloppy and slippery mess Thursday morning. Not going to do much to increase the snow totals for the season to date for anyone, especially the snow starved crowd. To sum it up.....Next.
-
5 minutes ago, eduggs said:
Warm day today with 50s popping up in a few spots. Feels nice in the sun.
Sure made for a quick melt of the overnight snow. Nothing left here. More like a mid to late March type melt than the 3rd. of February.
-
2
-
-
1 hour ago, NEG NAO said:
Middlesex/Union County NJ border at 11:50 A.M temp is 42 and not a trace of snow on the ground completely melted -its not melting up northern NJ yet ?
Just scant traces left here. Had 1.2" early this morning.
-
19 minutes ago, bluewave said:
That period may serve as a test of how far south we can get the gradient. Real battle setting up between the Southeast Ridge and -AO block over the top with its high pressure. Hopefully, we can eventually get the gradient far enough south so the areas closer to Central Jersey can cash in a bit. But with so much pattern volatility, we may not now how far south the gradient eventually drops this month until we get to within about 120 hrs of the event.
Might be more like 60-72 hours.
-
1
-
-
1.2" here with a melted total of .13".
-
1
-
-
-
That is a cold looking pattern for around mid-month. It is 10-14 days out so we'll see if it backs off as time goes on but will be impressive if it verifies. We'll need to get our snow before pattern potentially becomes suppressive, at least for a while around mid-month.

-
1
-
-
Most robust we've seen in quite a while.
We will see what ptypes fall where. Just nice to see the QPF for a change.

-
2
-
-
59 minutes ago, Yanksfan said:
I want a damn KU event. We’re overdue. Make it happen!
KU or BUST in my opinion. Bring it or get me to Spring. Don't need or want these little nuisance events. Beyond annoying at this point mostly because they are just another excuse to do another major salt dump.
And I will add that no matter how "favorable" this upcoming patter looks to some it is not even close to anything that would yield a KU event. Like I said yesterday I know some locations in this sub forum are snow starved and will take anything and I wish you all well, I really do but I can do without the little events.
-
12 minutes ago, MJO812 said:
We will snow this month. The question is how much. Going to be an interesting month .
Can't say I disagree with this statement. Much will depend on the push of cold air from the the north and where surface boundary sets itself up. This will vary from event to event. Just know that if it stays mostly to the north there is going to be great disappointment. Have to believe though that at least 1 or 2 events could produce some light to moderate snow totals for most of this sub forum before the month is over. Going to be a lot of back and forth from one guidance cycle to the next over the coming week.
-
2
-
-
1 minute ago, LibertyBell said:
4 rainers before the 10th? ugh
Honestly, I'll take it. Would rather some good snows but I'm done with all the nuisance type events. We need the rain so I'll take that over bothersome light events. I know some of you are in locations that are truly snow starved this season, I get it. You will take pretty much anything.
-
1
-
-
Received .16" of rainfall for event just ended. Disappointment but it did rid us of the road salt.
January total precipitation = 1.03".
January snowfall = 8.2"
Snowfall season to date = 23.7".
-
2
-
-
Received .16" of rainfall for event just ended. Disappointment but it did rid us of the road salt.
January total precipitation = 1.03".
January snowfall = 8.2"
Snowfall season to date = 23.7".
-
2
-
-
This thread over the last 6-8 hours:

-
1
-
 3
3
-
 1
1
-
-
Radar trends looking crappy for any decent rainfall totals for NNJ today / tonight.
Sitting at .04" so far today. Would be very surprised if I get to .25". Maybe just enough to rid us of the road salt, including what was dumped early this morning.
Best rains going north and south for most of this sub forum. These were the trends over the last few days so not much of a surprise.
-
1
-
-
20 minutes ago, Stormlover74 said:
Rgem would be a nice soaker Friday .75 to 1". Unfortunately it doesn't look like the other models giving us .25"
Hope we can get .25 - .50" out of this. Guidance has been trending to the lighter side last few days.
-
51 minutes ago, roardog said:
Those amounts are anomalies not actual amounts.
Sorry, mistake. Didn't read the map title. Scrolling through too fast.
Even so, pretty close to normal and we need more than normal to erase the departures we currently have.
Having said that I will take anything at this point.
-
 1
1
-
-
2 hours ago, LakePaste25 said:
On a positive note, the upcoming pattern will provide potential relief to the drought-stricken portions of the region.
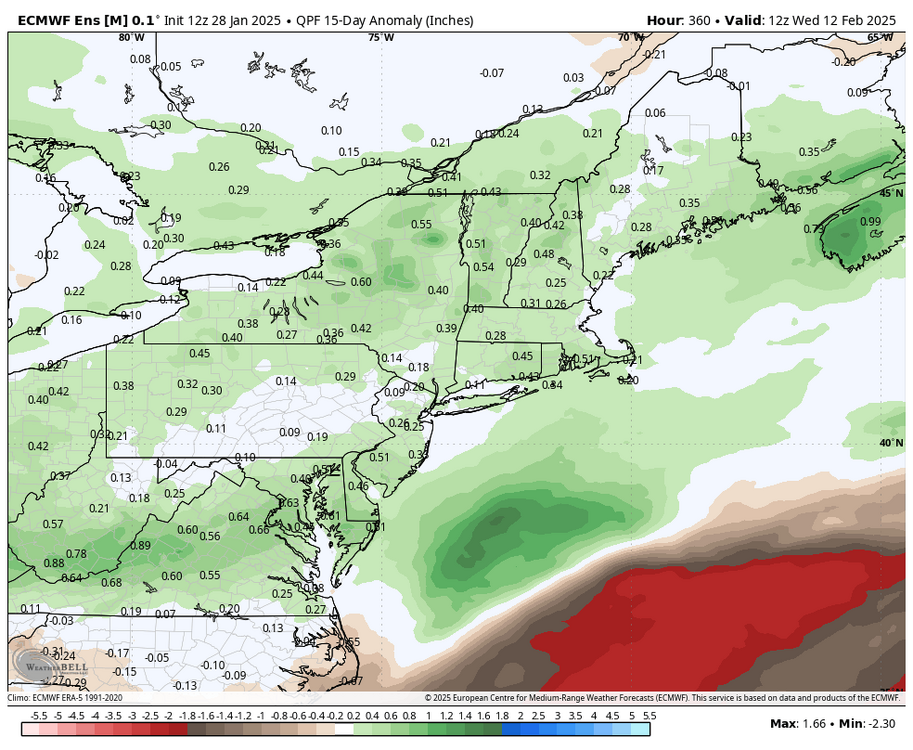

If those amounts are all that is realized over the next 15 days - not good.
-
3 hours ago, North and West said:
Come back around Thanksgiving to do it all again! Greatest hits include your favorite seasonal classics such as:
It Never Snows Anymore
When It’s Cold It’s Not Actually Cold Because When I Was Young It Was Colder
Baby, It’s Warm Outside (Each and Every Christmas)
No One Knows What’s Actually Going to Happen (Except for Me)
Where You Live Is Not Part of the Metro Region
Bonus Tracks:
Insane Twitter Posts
Clinically Insane Snowfall Maps
.and the oh so popular newly released single from late December 2024:
Buckle up !
-
4
-
-
13 minutes ago, Stormlover74 said:
Nam is a nice soaking for Friday. Rgem less so. More like .25" but still raining at the end
Anything to get rid of this road salt will be welcome in my book. Thinking .25" to .50" is a reasonable forecast for most at this point.
-
2
-


Discussion-OBS Weekend Feb 8-9 Another mainly 12 hour snow-ice event possibly changing to rain before ending Sunday. NYC-LI-S of I78 on the edge?
in New York City Metro
Posted
Currently 27 here.
Sticking with my forecast of 2-4” (snow / sleet total) here.
Very fast moving and fully expecting sleet here within 2-3 hours tops of start time. Heaviest and steadiest precipitation should be pulling away around 3 a.m.
Per radar start time here about 7:30.