

griteater
-
Posts
9,581 -
Joined
Content Type
Profiles
Blogs
Forums
American Weather
Media Demo
Store
Gallery
Posts posted by griteater
-
-
12 minutes ago, bkviking said:
This is best thread on this forum IMHO- for a while. Even see Isotherm appears to be following time to time. Would love for him to come back and add. But I hope others aren’t missing this discussion bc it’s main forum and not regional and the discussion here rocks although it’s dedicated to ENSO only …
Yes it’s been a good thread this year. Good info shared. Some learning. Some fun
-
 4
4
-
-
53 minutes ago, brooklynwx99 said:
really nice to see this forcing pattern showing up on extended ensembles for the back half of December... this is straight 7-8-1-2, and these phases play well once into Jan

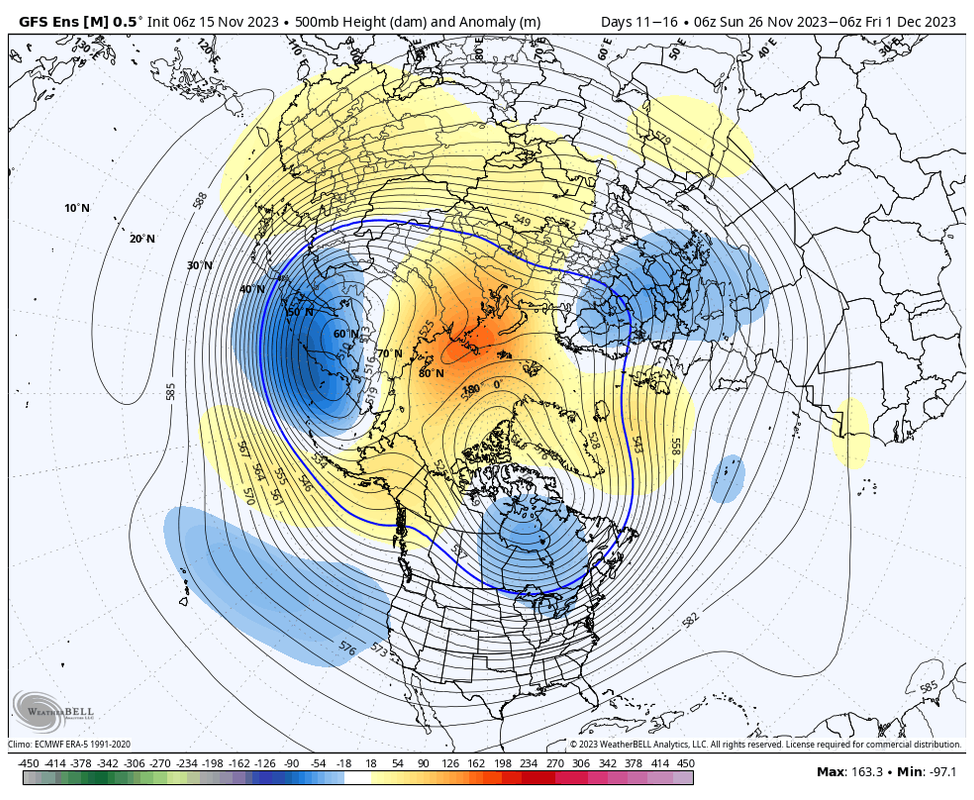
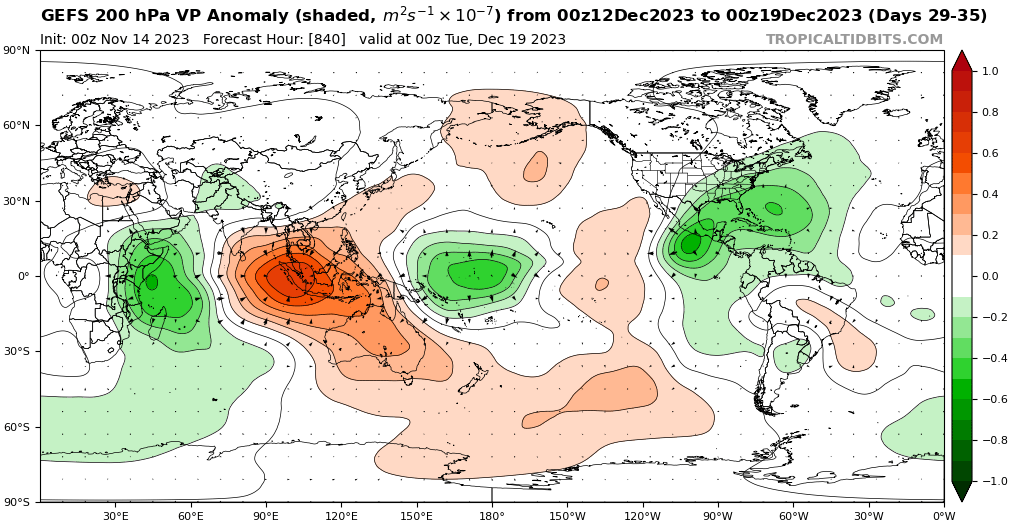
It would probably do us some good to make a subseasonal run thru 3-4-5 in late Nov into early Dec as that may get the Urals ridging activated with downstream low over NE Siberia / Bering Sea - good for Strat PV weakening (end of last GEFS run shows the configuration - 2nd image below). Then follow that up with 8-1-2 Nino forcing later in Dec. Would be a nice 1-2 punch.
-
8
-
 3
3
-
-
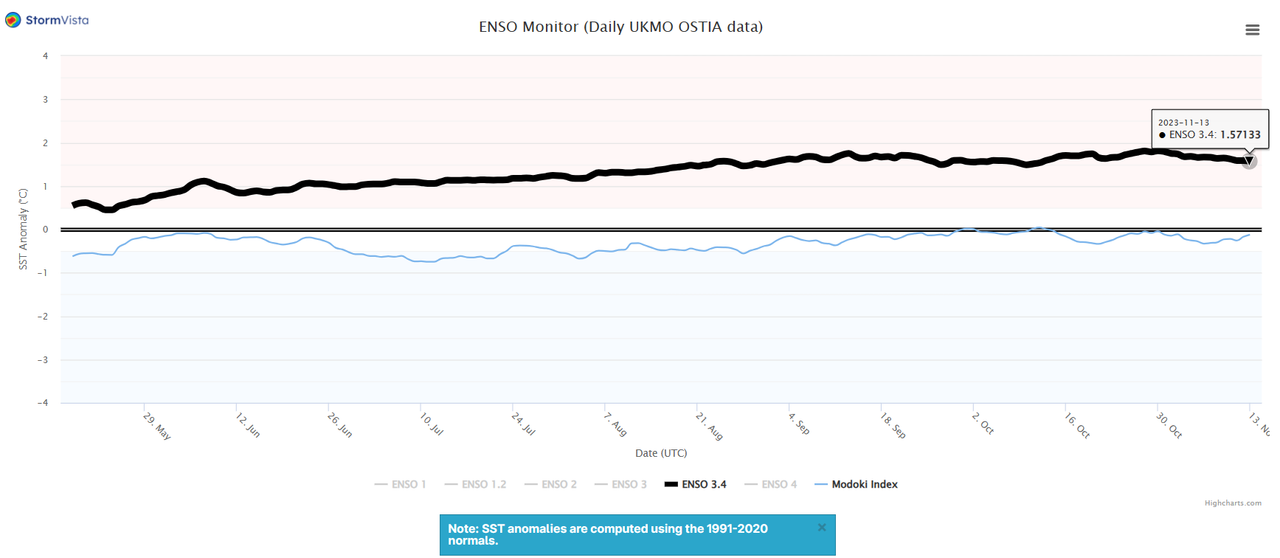
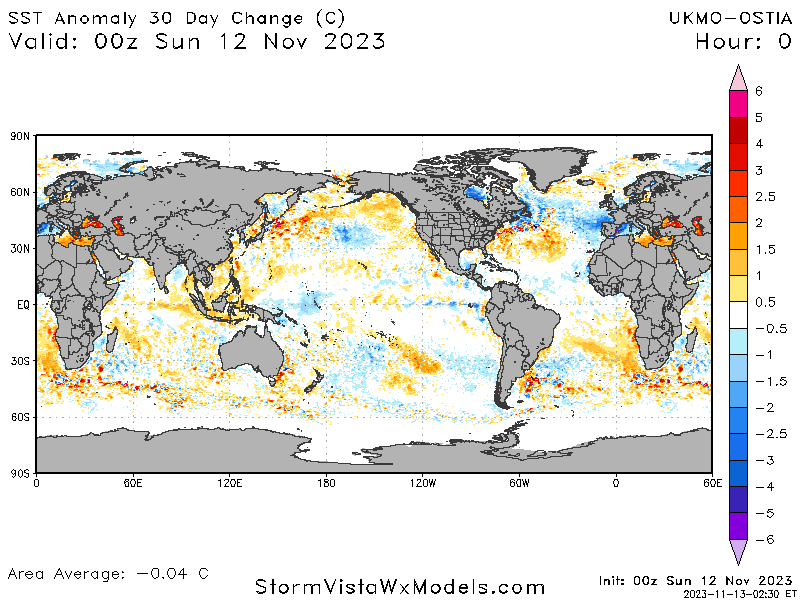
Nino 3.4 on UKMO OSTIA for 11/14 is +1.57. Nov 1-14 average is +1.65
-
48 minutes ago, Eskimo Joe said:
Is a +IOD or -IOD favorable for east coast snow?
Offered a few thoughts on this here: https://www.americanwx.com/bb/topic/58841-el-nino-2023-2024/?do=findComment&comment=7052627
-
1
-
2
-
-
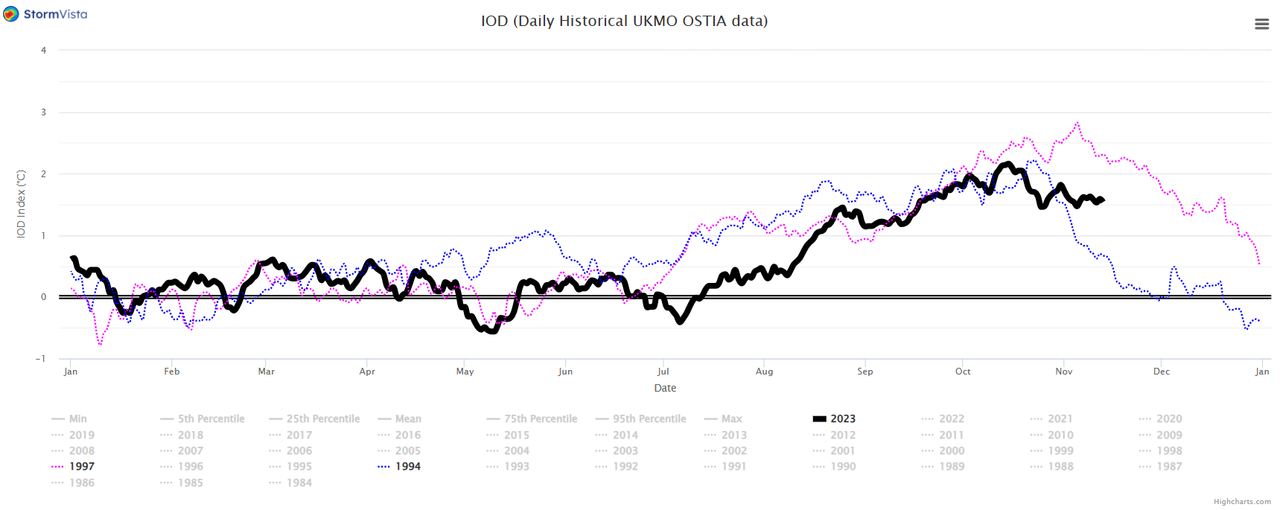
3 hours ago, so_whats_happening said:
Happen to have the iod by chance?
IOD is at +1.54 here as of Nov13....chart with comparison to 1994 & 1997
-
1
-
-
This WWB looks to be the most impressive we’ve seen all year in terms of it staying strong and continuing east of the dateline. So, I certainly think this will lead to some warming over the next month


-
2
-
-
11-13 update for UKMO OSTIA is +1.57 for Nino 3.4
-
3
-
-
4 hours ago, 40/70 Benchmark said:
@griteaterLove your stuff, man...you have to be my #1 source for outlook graphics lol
Oh, you meant charts and things like that.....thanks
-
1
-
-
53 minutes ago, GaWx said:
A gutsy call since I assume you realize that even the low end would mean the strongest -NAO for D-M since 2012-3. I’d love for you to be right during these hard to come by -NAO winters. What a winter the E US could have with that!
The only El Niño D-M since 1951-2 with a -NAO stronger than the top of your range all had BN temps in most of the E US: 1957-8, 1963-4, 1968-9, 1969-70, 1976-7, and 2009-10.
These are the El Niño D-M with an NAO within your range:
1958-9, 1965-6, 1977-8
All 3 of these were also BN in much of the E US.
Corrected
No way -0.25 to -0.50 is considered gutsy, haha. I'm good with going weakly negative for full winter (Dec-Mar). I will say that there are discrepancies with NAO calculations (and indices in general). The NAO numbers I like are the Hurrell Principal Component based numbers (can get it in the Data Access section here: https://climatedataguide.ucar.edu/climate-data/hurrell-north-atlantic-oscillation-nao-index-pc-based). That one is computed based on the full west-to-east Atlantic basin as opposed to just basing it on the difference in pressure anomalies between Iceland and Portugal. Are your numbers from the NOAA CPC data - cpc.ncep.noaa.gov/products/precip/CWlink/pna/norm.nao.monthly.b5001.current.ascii.table? I'm not sure how they do their calculation, but those numbers are more tame. For example, the NAO in Dec 2010 in the PC-based index was -3.56 vs. -1.85 in the NOAA CPC data
-
3
-
-
11 minutes ago, GaWx said:
Thanks. Did you mean to say slightly negative for Dec-Mar?
Sorry yes. Let’s go -0.25 to -0.50 for Dec-Mar
-
4
-
1
-
-
48 minutes ago, so_whats_happening said:
I do also enjoy your graphics what site do you use to for those DJFM maps?
I also do the exact same on a spread sheet ever since college that has been my go to setup.
Thank you. Yeah Snagit and my spreadsheet is a bit out of control. Waiting for it to just freeze up and die over at any moment
-
2
-
 3
3
-
-
1 hour ago, 40/70 Benchmark said:
@griteaterLove your stuff, man...you have to be my #1 source for outlook graphics lol
Thanks man. I use Snagit for the maps
-
2
-
-
1 hour ago, GaWx said:
Have you made a specific forecast for either the DJFM or DJF NAO?
I know that @40/70 Benchmarkis going with neutral for DJFM (+0.15 to -0.20), which I’d take in a heartbeat in this day and age of difficult to attain -NAO winters. I don’t recall any other explicit (with numbers) NAO forecasts to this point.
Getting a -NAO in DJF has occurred only six times in the last 44 (14%) winters though two of the six occurred in -QBO El Niño winters (1986-7 and 2009-10). In DJFM, there have also been only six of the last 44 as -NAO though only one during El Niño (2009-10) as 1986-7 dropped out due to a neutral March. I define -NAO as sub -0.25 averaged out over the relevant period. So, of the last 14 El Niño DJFMs, only one was sub -0.25.
Fwiw, I’m leaning -NAO in Feb but either neutral or +NAO in DJF. So, I’d take a neutral DJF.
My call was +NAO in Dec and -NAO averaged over Jan-Mar. I’ll go with slightly negative for Jan-Mar
-
2
-
-
^ Other good news is that if we go stock El Nino pattern (say in Jan-Feb) with Aleutian Low and West Coast ridge, that is a promising pattern as well in split flow.
-PDO / El Nino pattern with +NAO would be the killer for the eastern U.S. (for the most part)
-
3
-
2
-
-
9 hours ago, WxUSAF said:
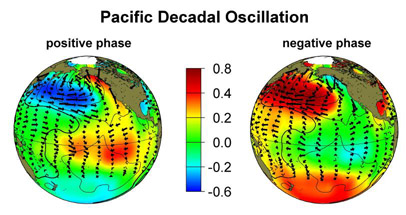
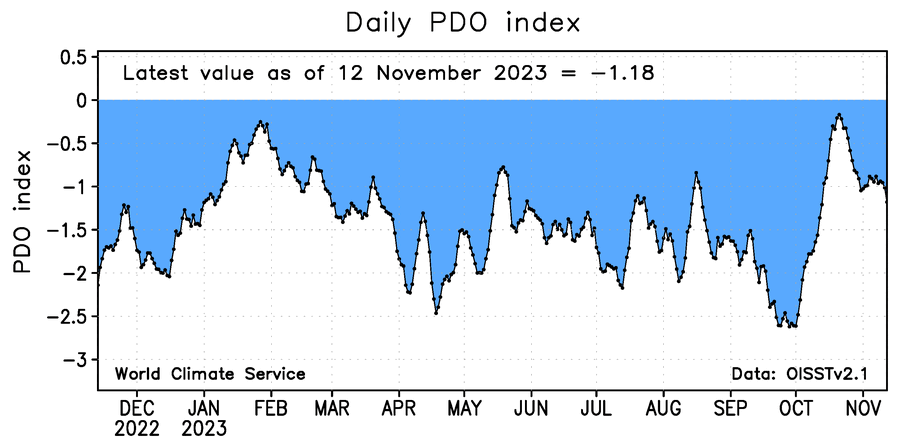
I’m mostly a novice at this, but seems the -PDO numerical index is mostly driven by the very warm water off Japan, right? The SST map on our side of the dateline looks weakly +PDO to me with slight AN SSTs along the west coast and in the GoA.
Along with the note from @so_whats_happening, here are the phase maps for both pos and neg PDO.
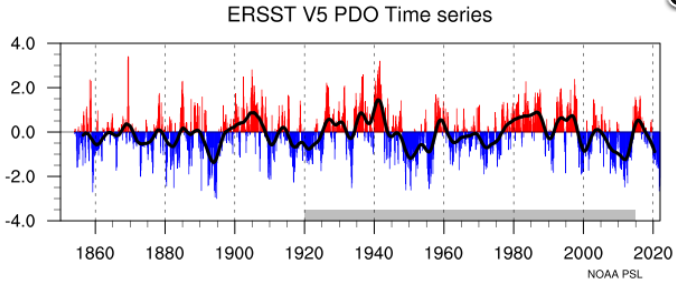
One way to analyze the use of the PDO for this winter would be to look at all El Nino winters that occurred during a negative PDO regime (i.e. a multi-year PDO regime, which is what it looks like we will remain in this winter unless a hard flip occurs) and eliminate the winters in which a rogue -PDO winter occurred within an otherwise +PDO regime. Here is a chart of the -PDO regimes as indicated by the black line.
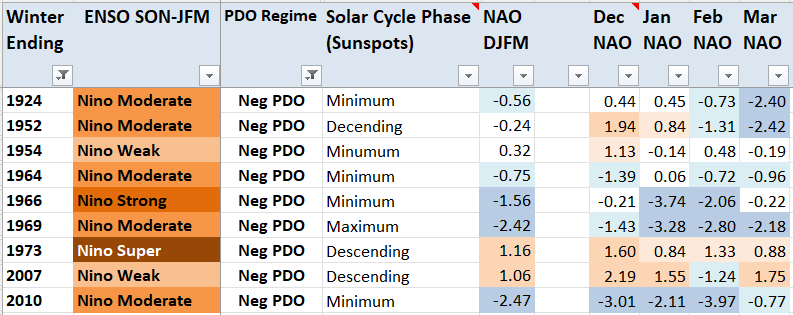
Here I have it in spreadsheet form as well. Note that I didn't give "Neg PDO" regime designation to years that had a hard flip from Neg to Pos PDO in the Fall/Winter during a Neg PDO regime (e.g. 57-58, 69-70, 76,77) or to years that had a hard flip from Pos to Neg PDO in the Fall/Winter during a Pos PDO regime (e.g. 94-95, 04-05 - not shown below)

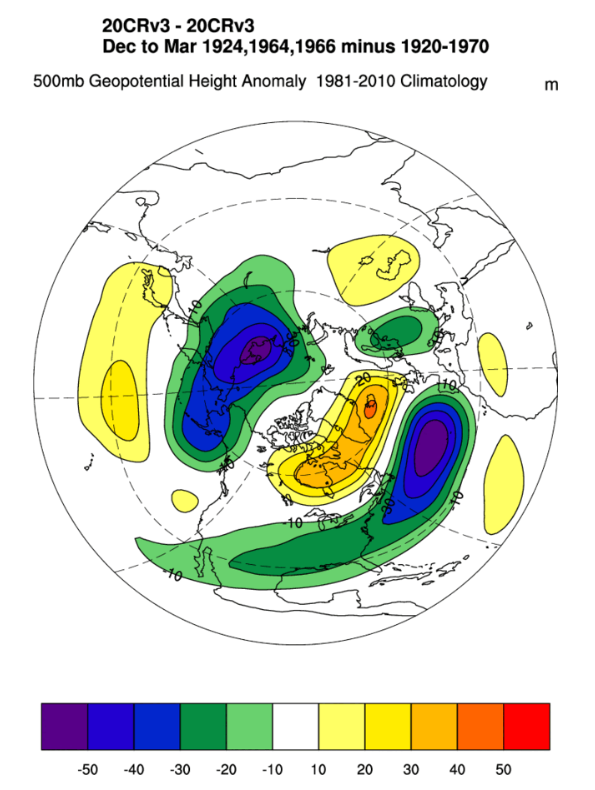
Using this logic, here are all El Ninos that occurred during a -PDO regime, and with the PDO not flipping hard to positive during the Fall/Winter. Note the Central Pacific ridge / West Coast trough.
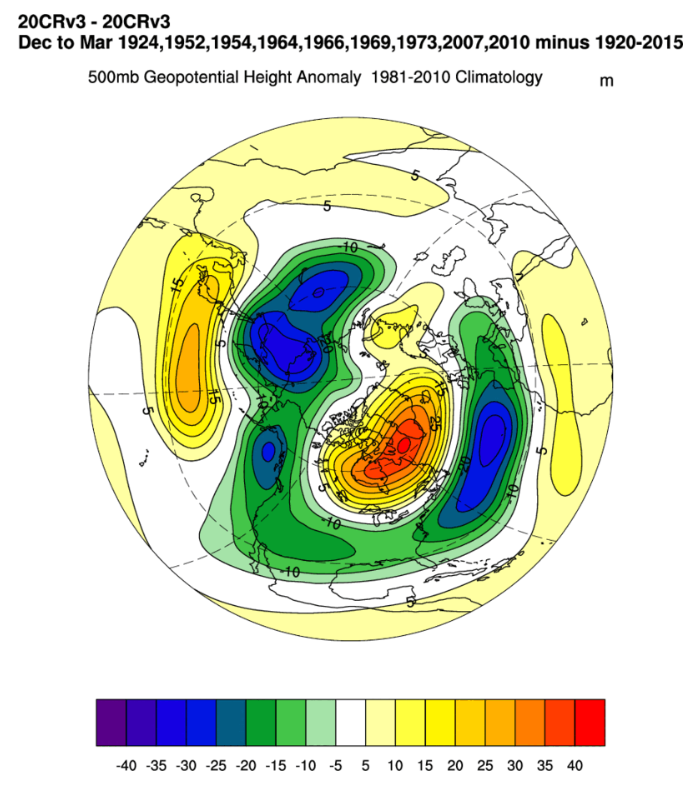
Same as previous image, but this time I removed all weak and super El Ninos:
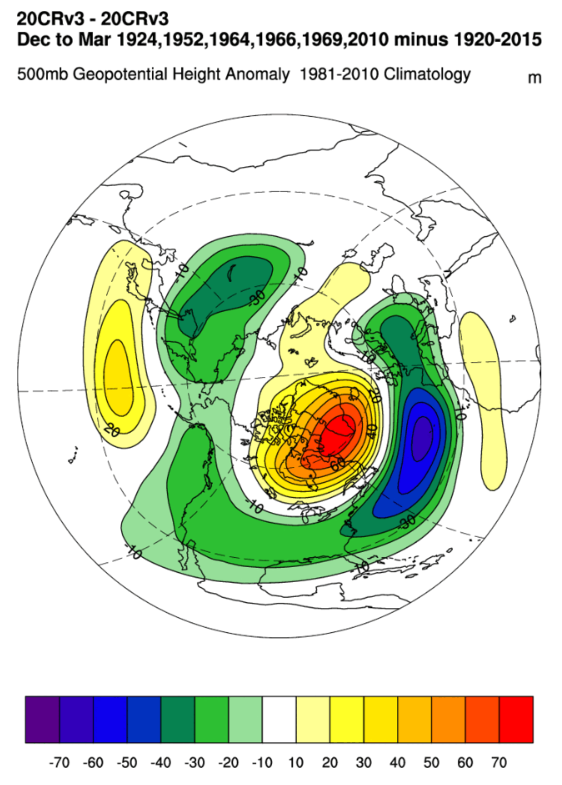
Same as previous image, but this time I removed the 1952 winter due to it being in the descending phase of the solar cycle:
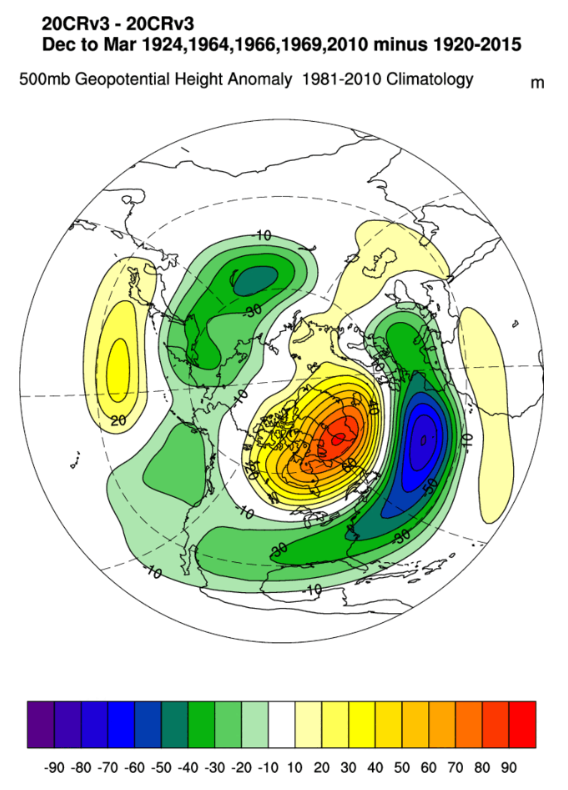
And here in the final one, I removed 68-69 and 09-10 which were extreme -AO/-NAO winters:
Here are all years above in spreadsheet form with various parameters:
Bottom line: Winters occuring during El Nino, -PDO Regime. -PDO, and Solar not in descending phase show a composite pattern of a ridge in the central Pac, trough along the west coast, and split flow across the CONUS underneath west-based -NAO. Assuming the -NAO delivers (-QBO favors it as well), it would be a promising pattern in an enclosed area from the SW states to the S Plains, to the NE, and down to the SE states. Also, after my "ugh" post earlier about the PDO, I am so back for winter based on this analysis. LOLLOL.
-
13
-
8
-
-
30-day change map shows warming in the Maritime Continent (ugh) and warming off Japan (ugh)
-
 1
1
-
-
It's shaping up to be a battle royale this winter between El Nino and the -PDO. This is likely the biggest contrast between the 2 in recorded history. December tends to be a weird month with weather patterns, but Jan-Feb will shed more light on which one wins out.
-
2
-
-
UKMO OSTIA is +1.59 again today for Nino 3.4 (as of Nov12)
-
2
-
1
-
-
1 hour ago, snowman19 said:
It’s continuing to warm, would not surprise me if it’s over +1.9C nowUKMO OSTIA is down again today to +1.59 as of 11-11. CDAS on TT has also seen a slight drop of late as of 11-12. So not sure what to make of the WCS number
-
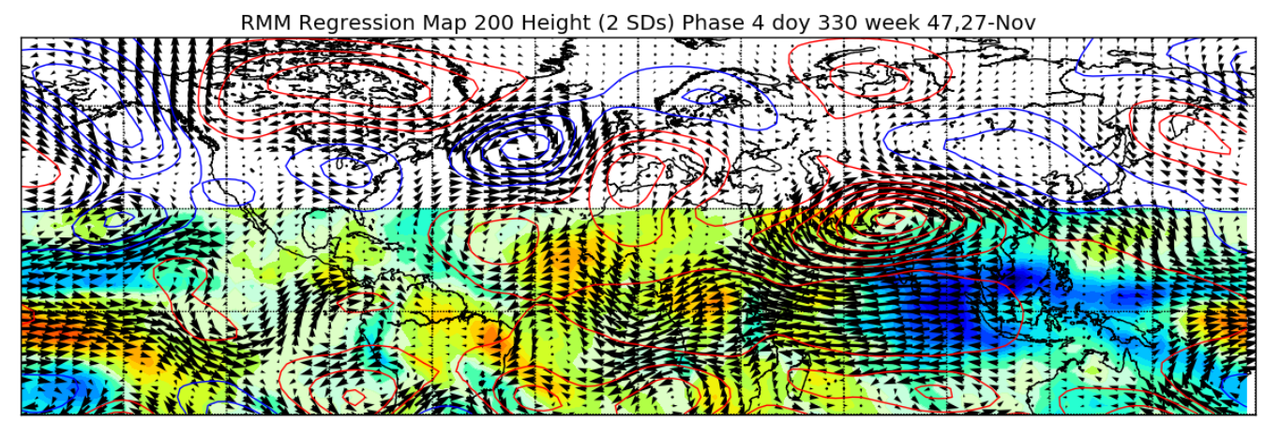
45 minutes ago, Eskimo Joe said:
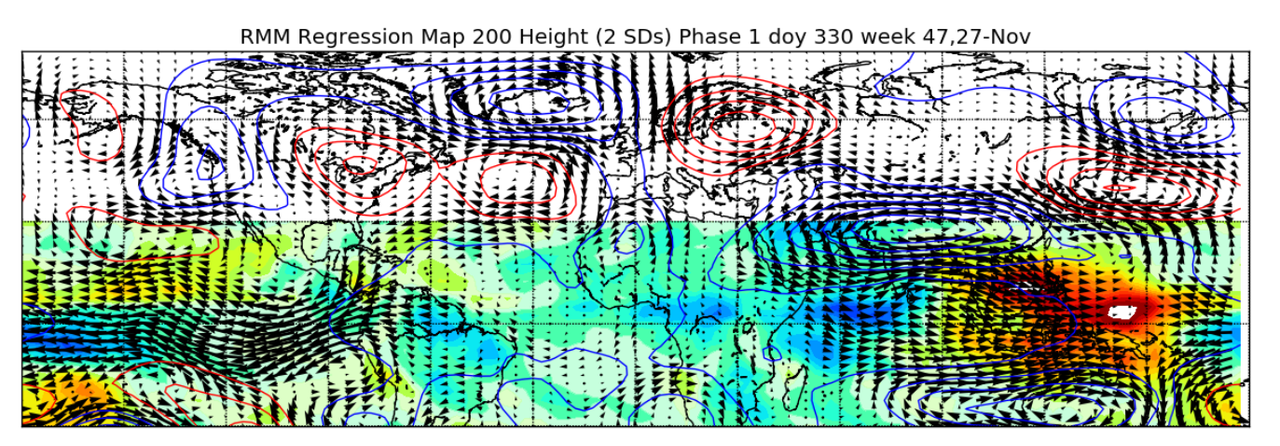
Isn't a weak phase 1, 2, or 8 good for cold?
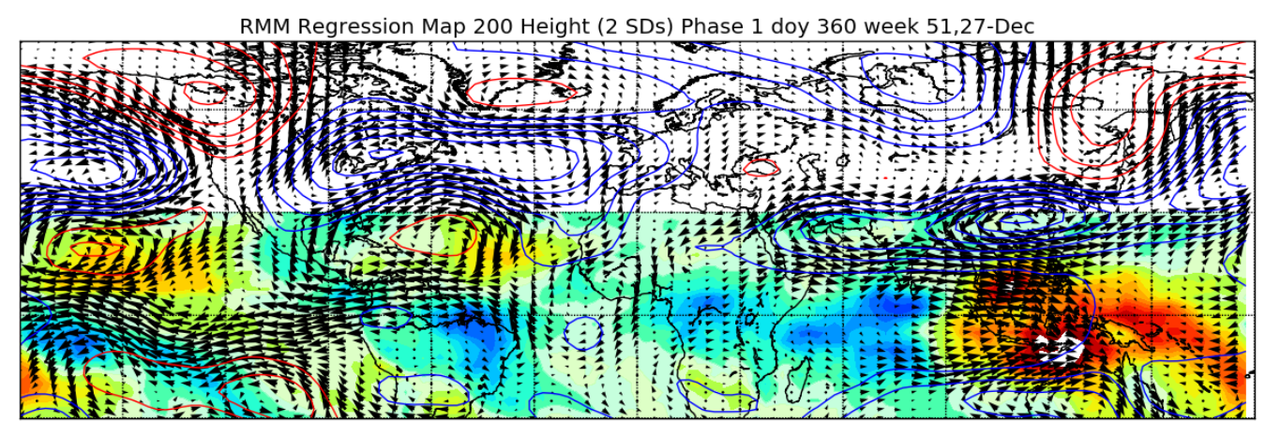
It depends on the time of year. On average, Phase 1 in late Nov has a trough on the west coast...in late Dec, trough on east coast.
Link: https://www.atmos.albany.edu/facstaff/roundy/waves/rmmcyc/index200reg.html
-
4
-
-
18 minutes ago, stadiumwave said:
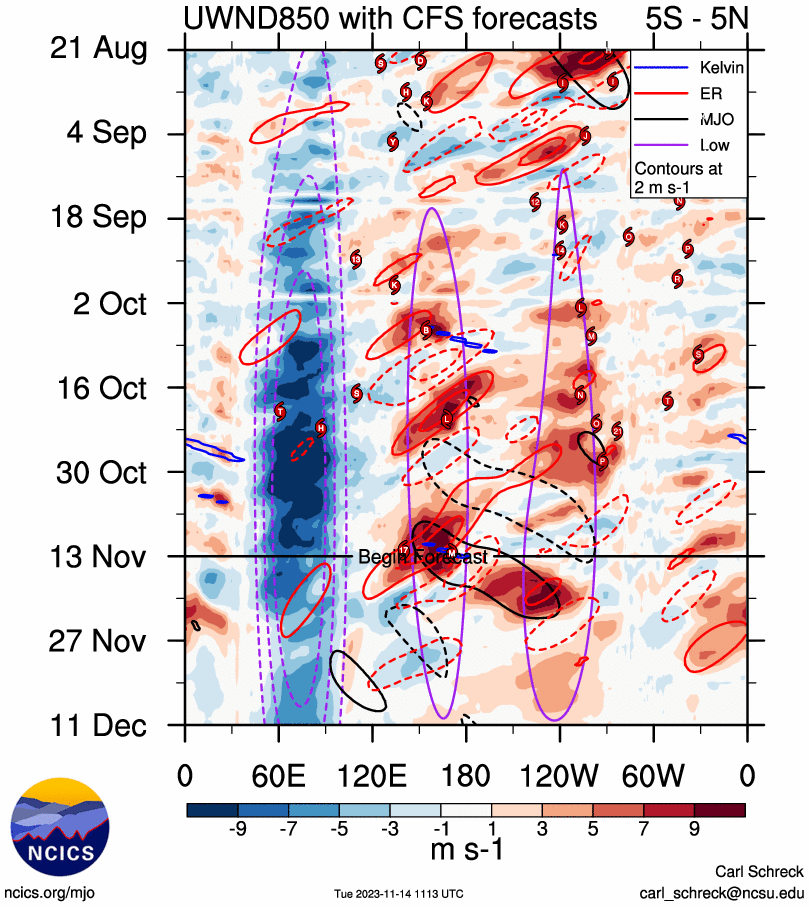
So most models have MJO in either phase 8 or 1 to start DEC. It's not a very high amplitude but is this truly MJO? I know that the RMM does not always reflect reality.
The weekly MJO updates from NOAA give good info on this, but when you see the RRM plots circling around in a similar location, that indicates that it's not a true MJO wave, but rather, it's the plots picking up on how the IOD and ENSO are running the base state. A true MJO wave will continue moving forward as it ramps up and not stop & circle back.
-
3
-
-
5 hours ago, snowman19 said:
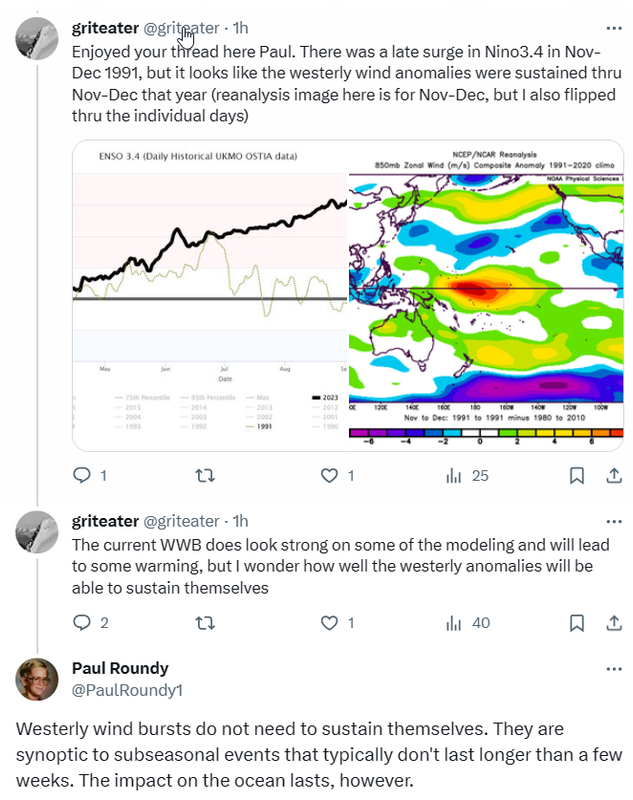
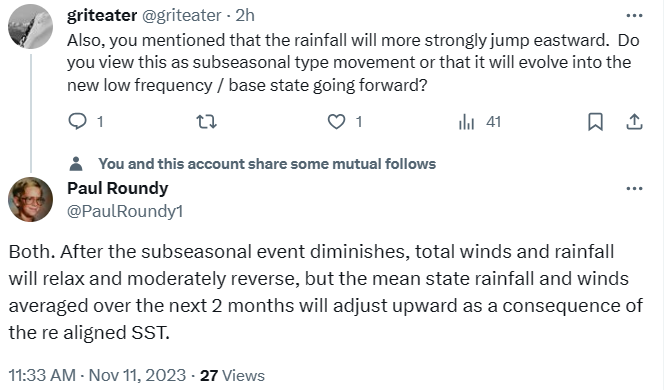
This is a really good thread with detailed explanations, take the time to read:
It was a good thread from Paul. I asked him a few questions. I mean, I get that the downwelling wave post-WWB will warm both the subsurface and surface as it treks east (and we actually already have one of those ongoing), but IMO, there is a limit to how much this can warm if the westerly anomalies don't sustain themselves or come back in earnest again (not currently shown, but sure, that is out in the future). And with respect to the rainfall / convection moving east, same thoughts, unless this WWB is massive or has follow-up support, I don't see how this event is going to re-configure the base WCell uplift regions which have already established themselves and are well-entrenched. Not to mention, basically every forecast model has them staying put through winter.
-
4
-
-
14 minutes ago, michsnowfreak said:
Aren't the weeklies run daily now?
Yes
-
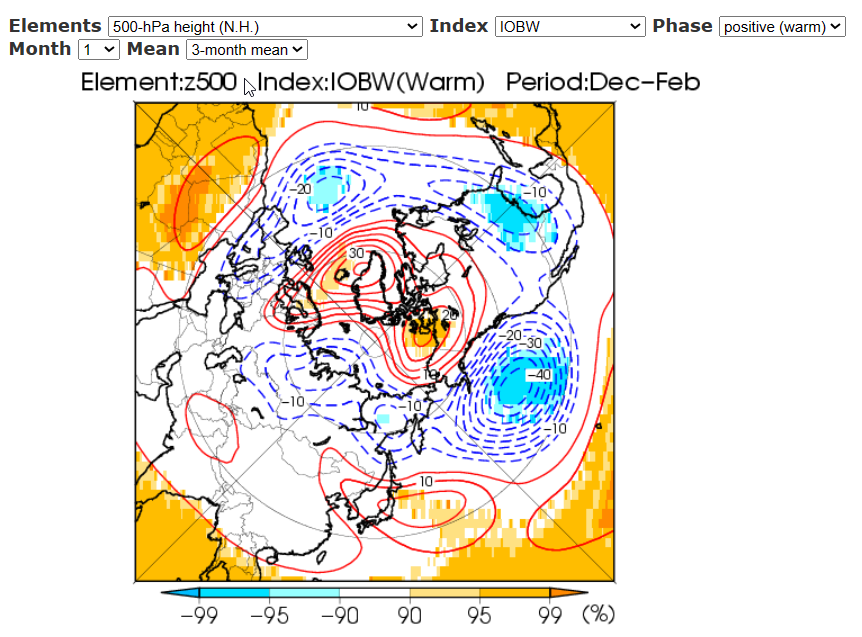
14 minutes ago, snowman19 said:
Besides Hunga Tonga, I wonder if the ++IOD is also playing a role (i.e. 2019)We've had several +AO winters with +IOD, but it's hard to figure out if the IOD is the culprit because there were other issues in there that could have caused +AO (Pinatubo / Descending Solar). To that point, the composite on the JMA site for +IOD is a -AO, and that matches some of my own research going way back (1900).
-
3
-
El Nino 2023-2024
in Weather Forecasting and Discussion
Posted
For my stupid moment of the day, can someone share how to get to these VP maps on the GEFS extended which goes out to Day 35?
I can get to similar GEFS Extended maps on WxBell, but I like these better....and I see the regular GEFS on TT (out to Day 16), but not GEFS Extended (out to Day 35)