

griteater
-
Posts
9,581 -
Joined
Content Type
Profiles
Blogs
Forums
American Weather
Media Demo
Store
Gallery
Posts posted by griteater
-
-
That MEI number really is amazeballs.
Lowest Sep-Oct MEIs in oncoming El Nino years since 1979:
2014: 0.0
2023 / 2004 / 1979: 0.3
-
 1
1
-
-
16 minutes ago, mitchnick said:
Although the latest MEI number hasn't updated, it looks to me like this Graph has been for September/October. Assuming I'm right, the MEI has DROPPED for S/O.

No doubt DT will be calling for an all-hands on deck ALEET when he sees this

-
 2
2
-
-
5 minutes ago, Terpeast said:
Well, I certainly did not expect the MEI to drop.
It's what I based my outlook on, but with the assumption that MEI would stay between 0.5 and 1.2. Maybe it gets back into the +0.5 range next month, so it's premature to change my outlook for now.
The current strongest, most beastliest downwelling kelvin wave of the year per 97-98 twitter hounds will surely bring the MEI up a notch next month
-
4
-
-
44 minutes ago, bluewave said:
It will be a good WWB, but it’s coming a little late to move the needle much. I guess it’s possible we can get a daily or weekly OISST closer to super, but every spike had a pullback so the monthly will average below super.
These late fall / early winter WWBs are welcome per the Chuck +PNA correlation of keeping warmth in the subsurface
-
3
-
-
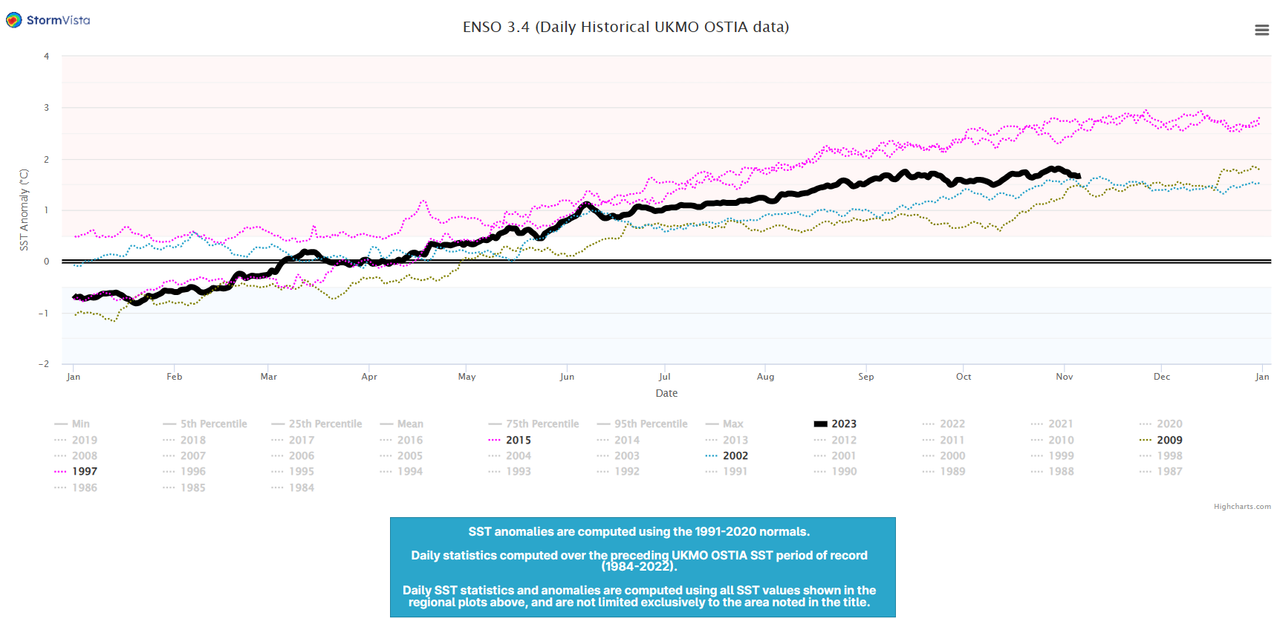
46 minutes ago, bluewave said:
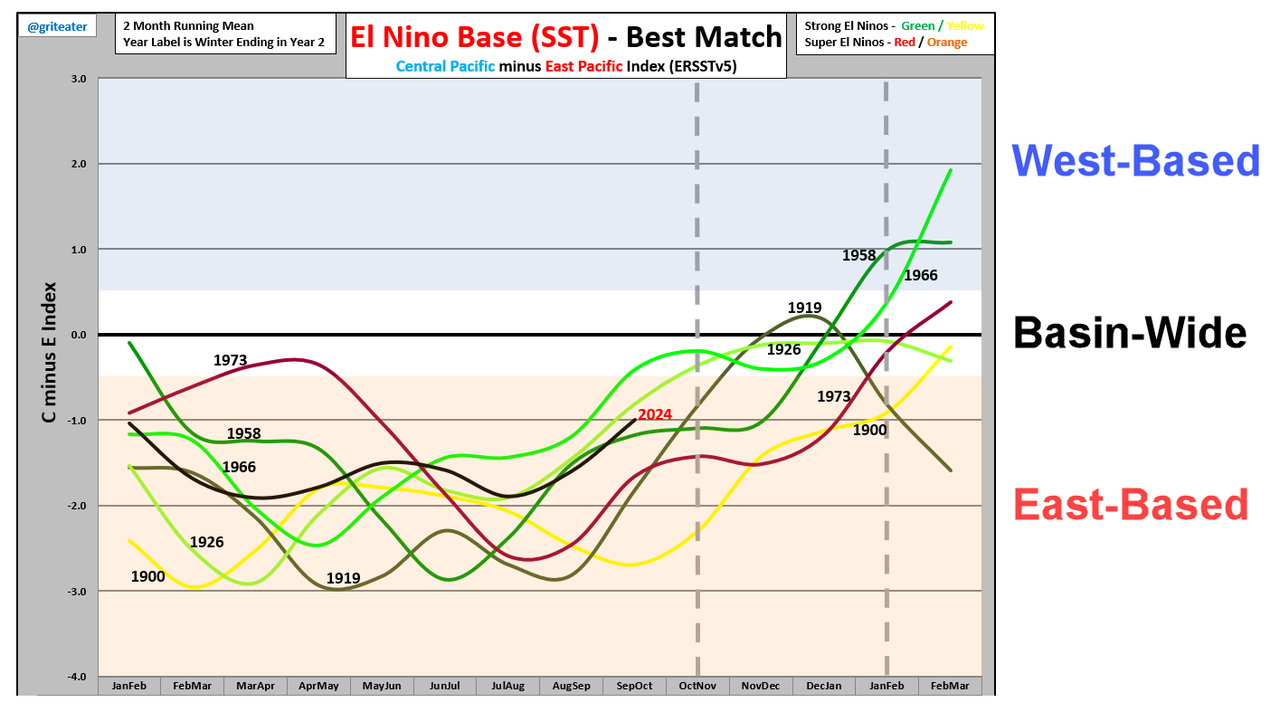
Looks like Nino 3.4 is getting closer to peaking below super levels. Its one of the few years when the September and October were nearly the same. This event really ran out of momentum after August. Makes sense since we have never had a super El Niño after a 3 year La Niña before. Too much of a lag with the well established La Niña background state.
https://www.cpc.ncep.noaa.gov/data/indices/ersst5.nino.mth.91-20.ascii
ERSST
JUL….1.02
AUG…1.35
SEP…..1.60
OCT….1.66

September was the killer. It was a slow and steady unimpeded climb. Then it flatlined, and the damage was done
-
2
-
 1
1
-
-
7 minutes ago, so_whats_happening said:
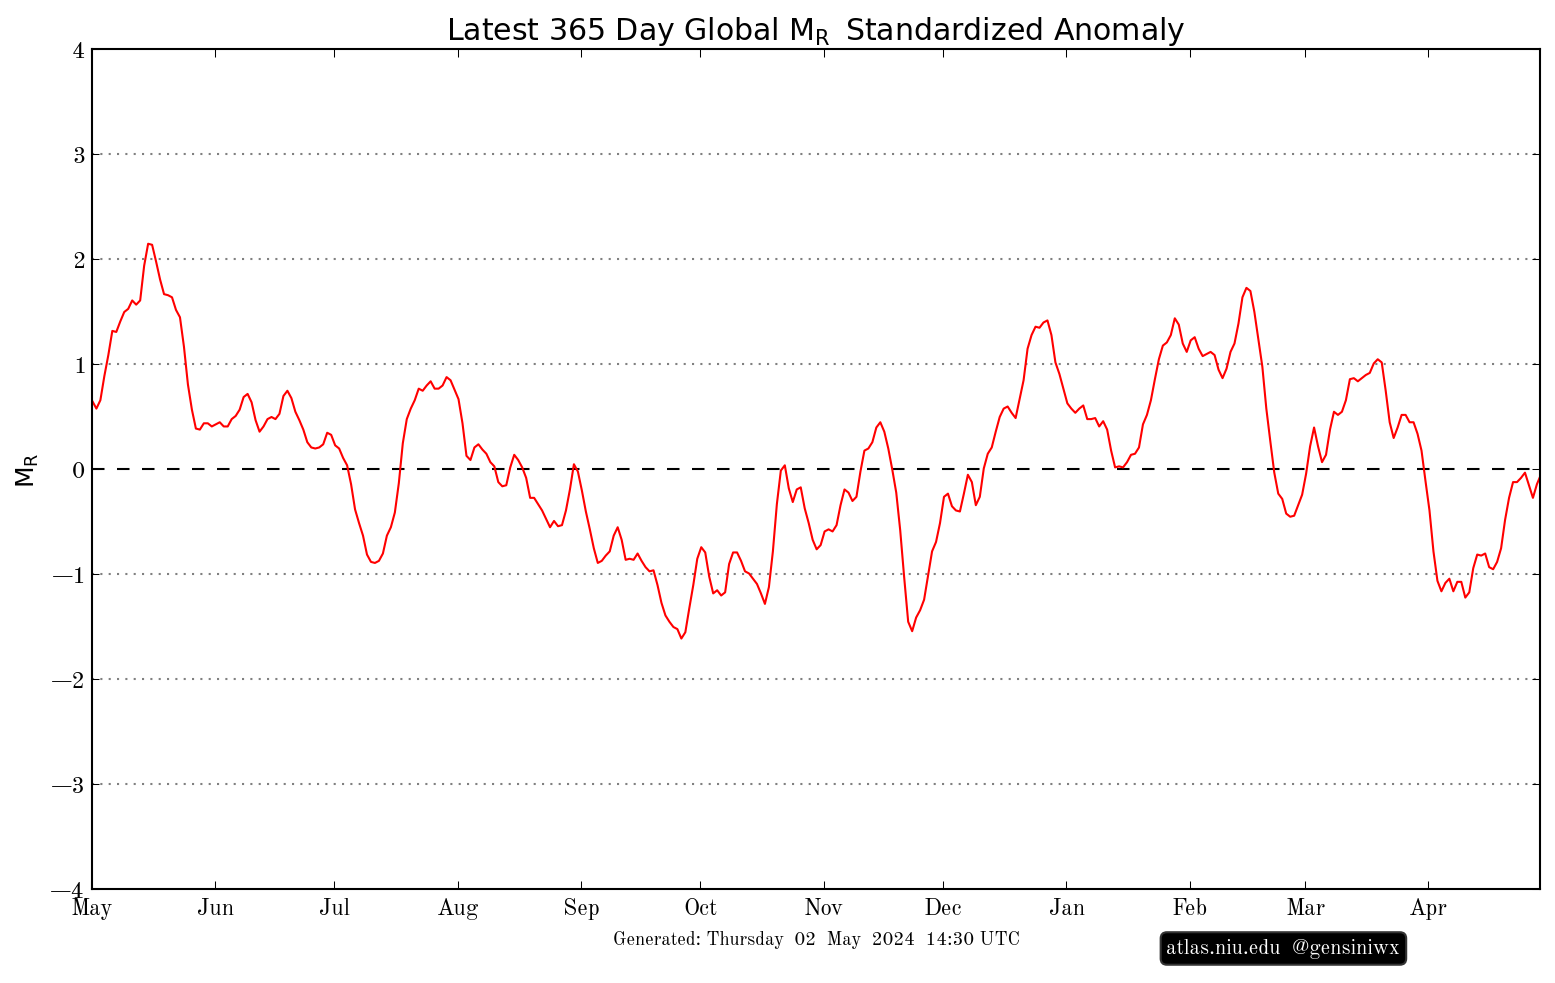
It is the same map from the atlas webpage just on a different site. Thanks for the 365 one.
Yeah, I liked your link. The GWO chart from MVentrice is a good one....but yeah, I was just pointing out that the data up to the current date is fine, but the forecast graphs/charts based off the CFS aren't regarded as very accurate, I don't think.
-
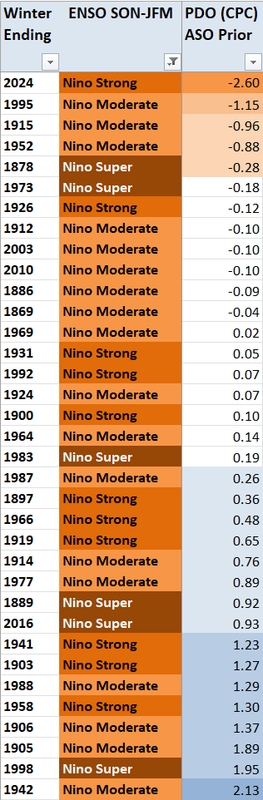
This is crazy...this is all moderate / strong / super ninos since 1866 and the corresponding averaged PDO for Aug/Sep/Oct prior to the winter (CPC PDO Data: https://www.ncei.noaa.gov/pub/data/cmb/ersst/v5/index/ersst.v5.pdo.dat)
-
2
-
2
-
-
42 minutes ago, GaWx said:
This shows the current AAM is slightly positive to neutral rather than negative. Am I missing something?

I think those AAM forecasts tend to be sketchy.
I'd refer to the past charts to kind of see how things have progressed
-
1
-
-
41 minutes ago, 40/70 Benchmark said:
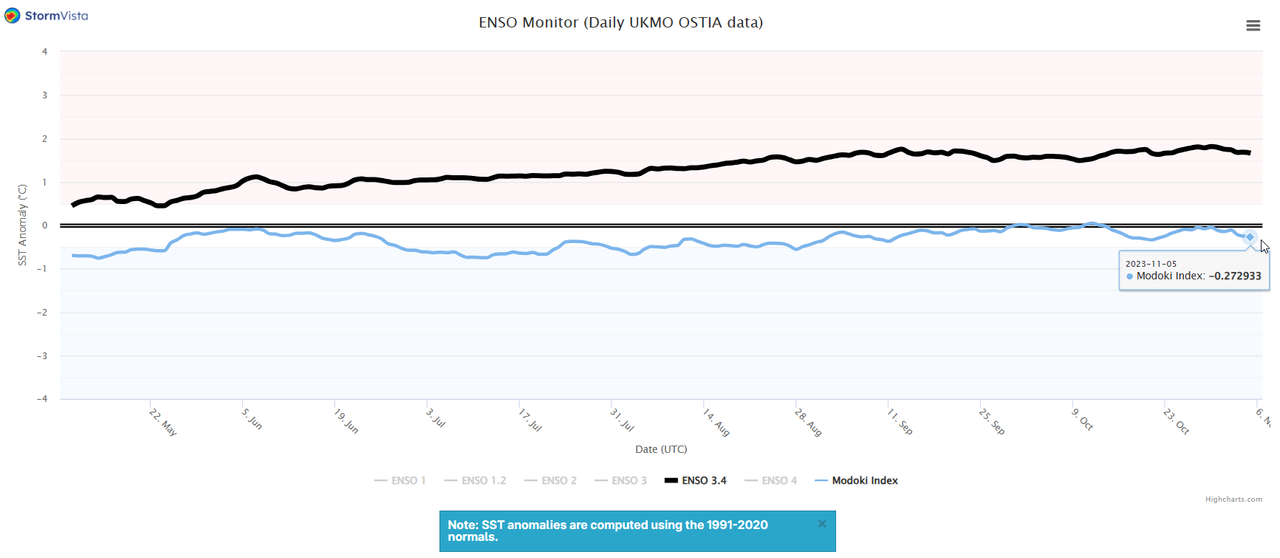
Do you have the link for this daily Modoki index? JAMSTEC just does it monthly...
That daily Modoki index is on StormVista. The latest...
-
2
-
-
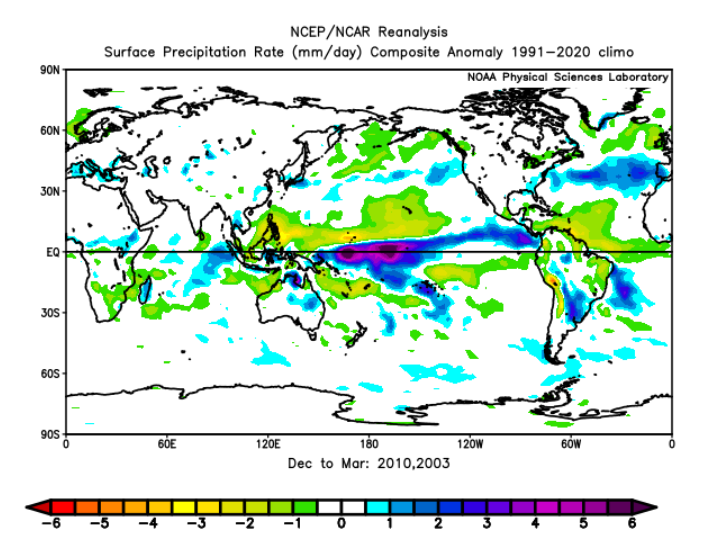
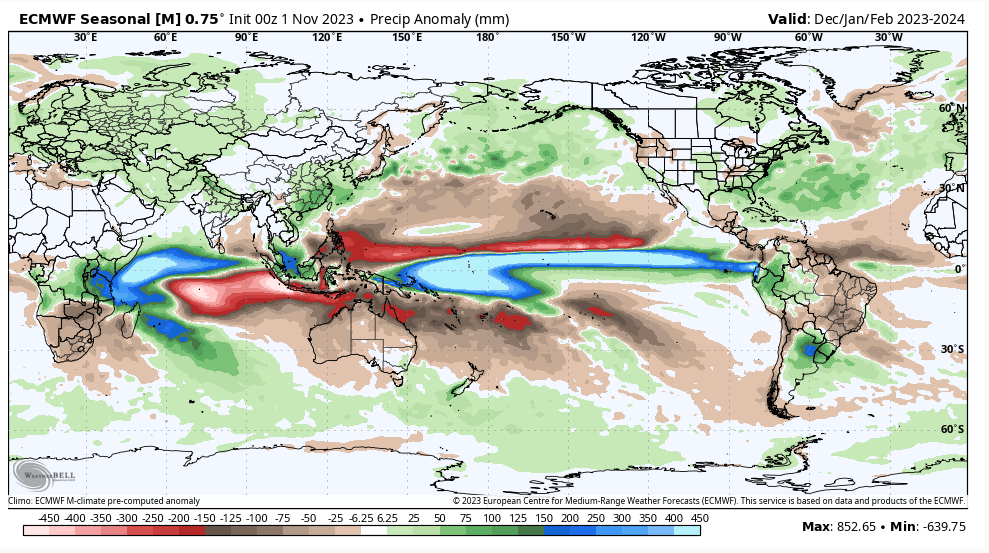
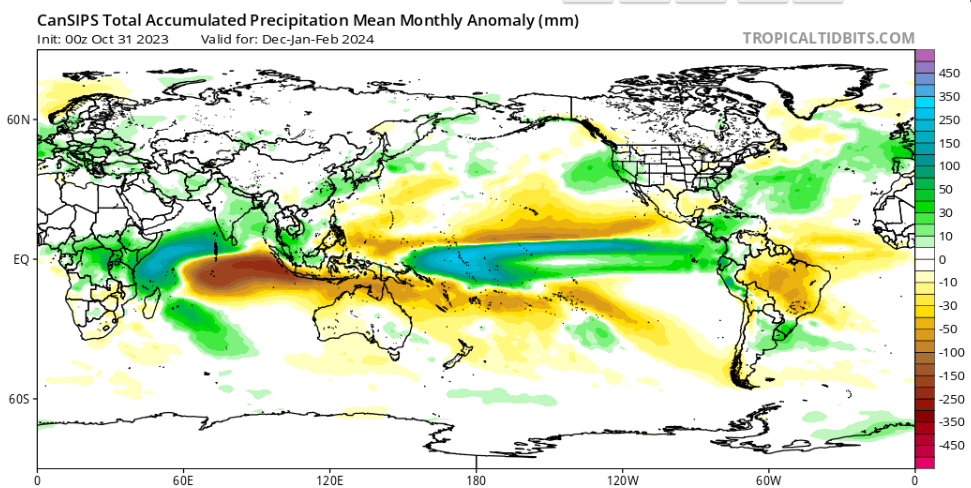
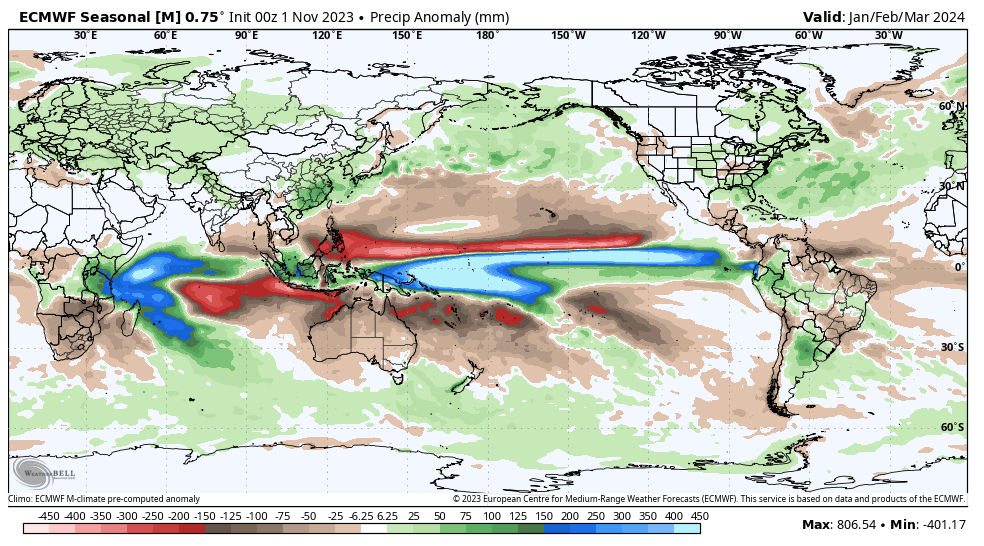
3 hours ago, GaWx said:
The good news from my perspective is that the seasonal models are not dependable because I’d much rather that main bulge be ~30-40 degrees E of where this has it. That is assuming that that main bulge will be the main driver. Would it be?This has the light blues of the bulge from 150E to 170W or centered on 170E. That would favor MJO phase 6 as per the top image below. Phase 6 is the warmest phase for the E US in JFM per the 2nd image below. As one (like most of us) who would like a cool to cold E US winter, I’d prefer it be supportive of phases 8 and 1, which would be supported by enhanced precip a fair bit east of the dateline or near the heart of Nino 3.4 (say, 160W to 140W/centered near 150W) instead of being centered near 170E:
3 hours ago, Terpeast said:The way I read it is when forcing is centered on a location, it doesn’t mean that there will be mjo activity in that location wall to wall. More like it triggers an mjo wave at phase 6, then it propagates eastward through 7, 8, and 1. Unlike last year, the waters there are plenty warm enough so any mjo wave that propagates should stay strong instead of it hitting a wall
A few thoughts:
1. Fair point from GA as the lack of big cooling in the W Pac and E Maritime Continent may cause some interference with El Nino at times by enhancing convection in the W Pac...but yeah, whether the MJO RMM plots are showing a legit east tracking MJO wave or not, there is almost always a background weak MJO wave/ripple that traverses the equator around the globe, and as that signal (usually seen well with VP movement) kicks out of the W Pac into the dateline and east and constructively interferes with the background El Nino convection, that will be the time that should offer the most promise for wintry weather in the East.
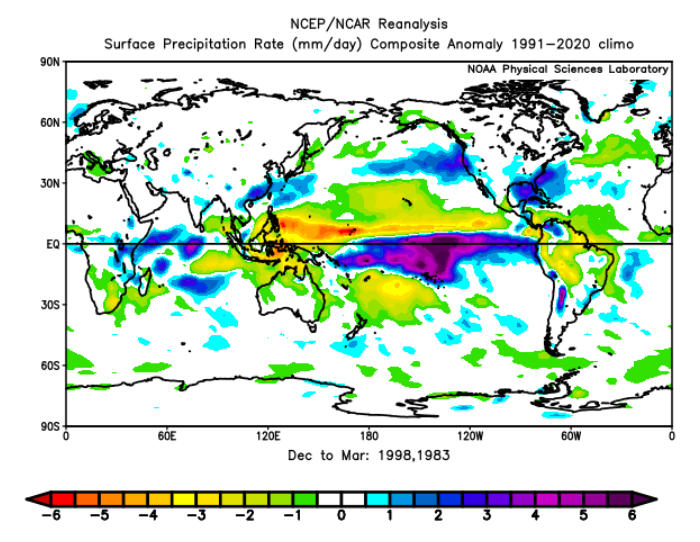
2. Look at how the precip maps from the winters of 09-10 / 02-03 (west-based El Ninos) compare with 97-98 / 82-83 (east-based El Ninos). Euro and Cansips Seasonals match more with the west-based look
3. Lastly, here is how MJO phases 6-7-8-1-2 look during El Nino in December / Jan / Feb (note: the Dec images don't have a 'Dec' label or El Nino label on them, but you can see that they are grouped under Dec during El Nino when you click on the images here): https://www.americanwx.com/raleighwx/MJO/MJO.html
December:
January:
February:
-
7
-
3
-
-
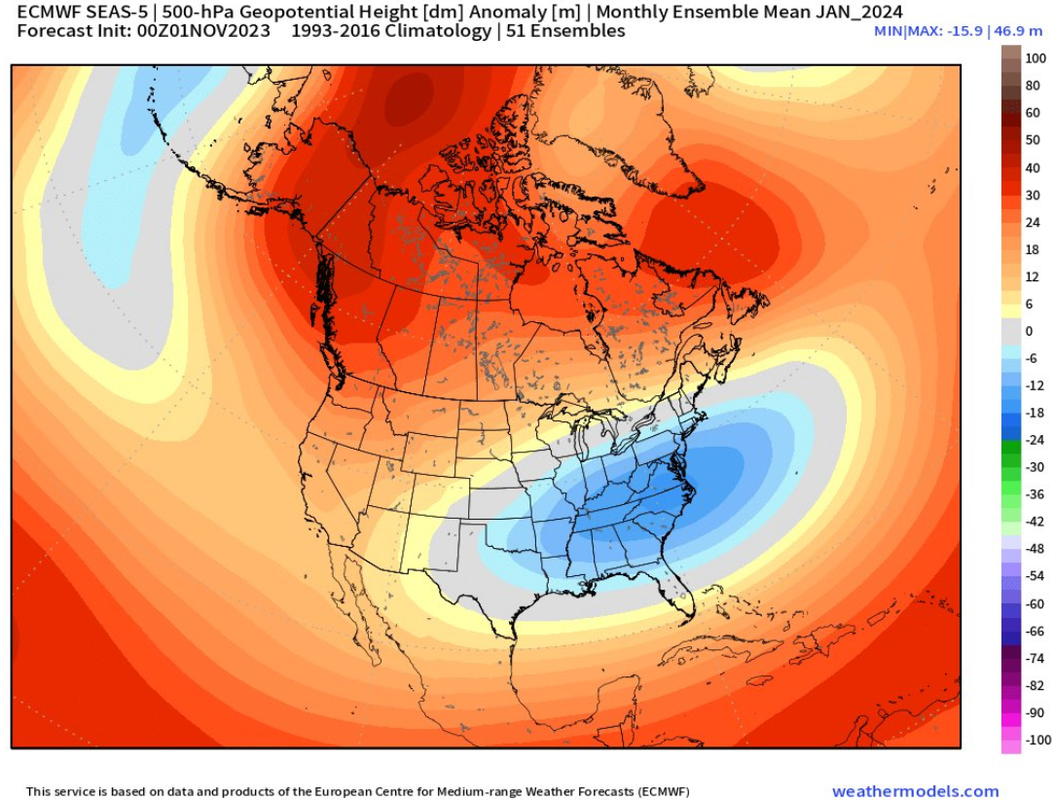
3 hours ago, snowman19 said:
Where is all the cold though? The SE is “cool/cold” from solar irradiance, clouds, precip from the roaring STJ overheadThis is a VERY cold 500mb pattern for January on the Euro for most of the E Half of U.S. Big -EPO / +PNA / Big cross-polar flow / Above normal heights Hudson Bay to S of Greenland
-
7
-
-
It was mentioned to wait until November to see where the forcing sets up. Well, here we are, precip enhanced across the central and eastern Pacific, but the main bulge is well west
-
8
-
-
7 hours ago, brooklynwx99 said:
yeah this is better in that regard for Jan. Feb is about the same but the trough in the east is deeper and there’s actually an Aleutian low
Not to mention, more yellow up top over the pole
-
5
-
-
Updated with October number in. This rose a little more than I thought it would
-
1
-
-
5 minutes ago, GaWx said:
Yeah, Webb implied that and I was just repeating what he said. Looking at the graphs, MEI since 1979 was clearly highest during the three strongest Nino’s based on ONI and thus 2023 is clearly lagging those three. Do you have a link to the monthly tabular MEI values?
-
1
-
-
29 minutes ago, GaWx said:
Webb is saying the atmospheric response is actually strong despite the weak MEI because the MEI tends to be stronger only during Modokis and that thus there will still be good warming upcoming even with the MEI still weak.
He probably has additional ideas, but the bolded isn’t true cause the highest MEI values occurred during the big east based El Niños of 82-83 and 97-98
-
3
-
2
-
-
UK Met Office Nino 3.4 is at +1.67 after a current year high of +1.81 on Oct 30

-
2
-
-
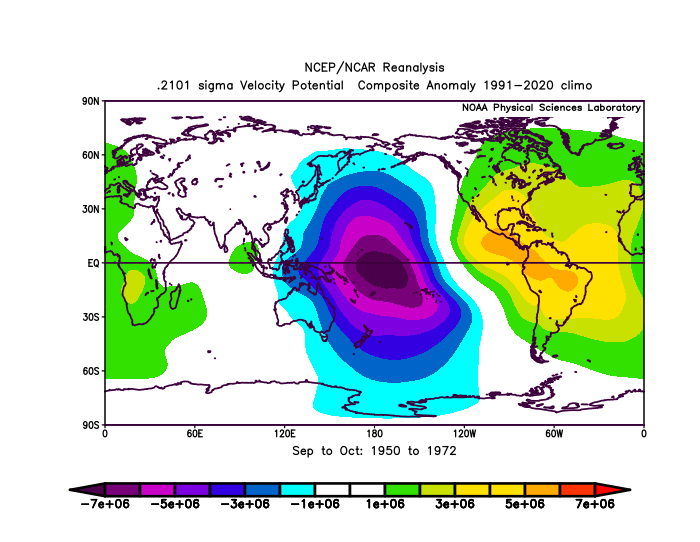
15 hours ago, Stormchaserchuck1 said:
It happened every year from 1950 to 1972. The average of the 23-consecutive years was greater than this year (Sept-Oct). That was a very -PNA/-PDO time. The VP caught on here as "something to correlate", but it's not by itself very correlated to the pattern.
13 hours ago, Stormchaserchuck1 said:Measure the thing as a stand alone index. It has little predictive value for sensible weather.
I just started going by the thing year-by-year. I found that the first 23 years were all alike. It's a longer term pattern or cycle, but the 1950s and 1960s were very -PNA, and that's 30% of your yearly dataset. Again, be an observer, because something is blue or red during an El Nino year doesn't mean that it isn't random. Seperate the thing out year-by-year and you find La Nina's and El Nino's both associated with similar "forcings".
VP and OLR data prior to ~1980 is known to be sketchy at best and unreliable (prior to extensive satellite coverage across the tropics by which these values are computed today). Obviously, reanalysis data is available for these fields prior to 1980 so there is some manner in which they are estimating the values...my guess is that it is an estimate based off surface pressure and precipitation patterns captured at tropical locations such as Tahiti / Darwin and others.
At any rate, I would be curious as to the correlation values you would see if you just used data post 1980.
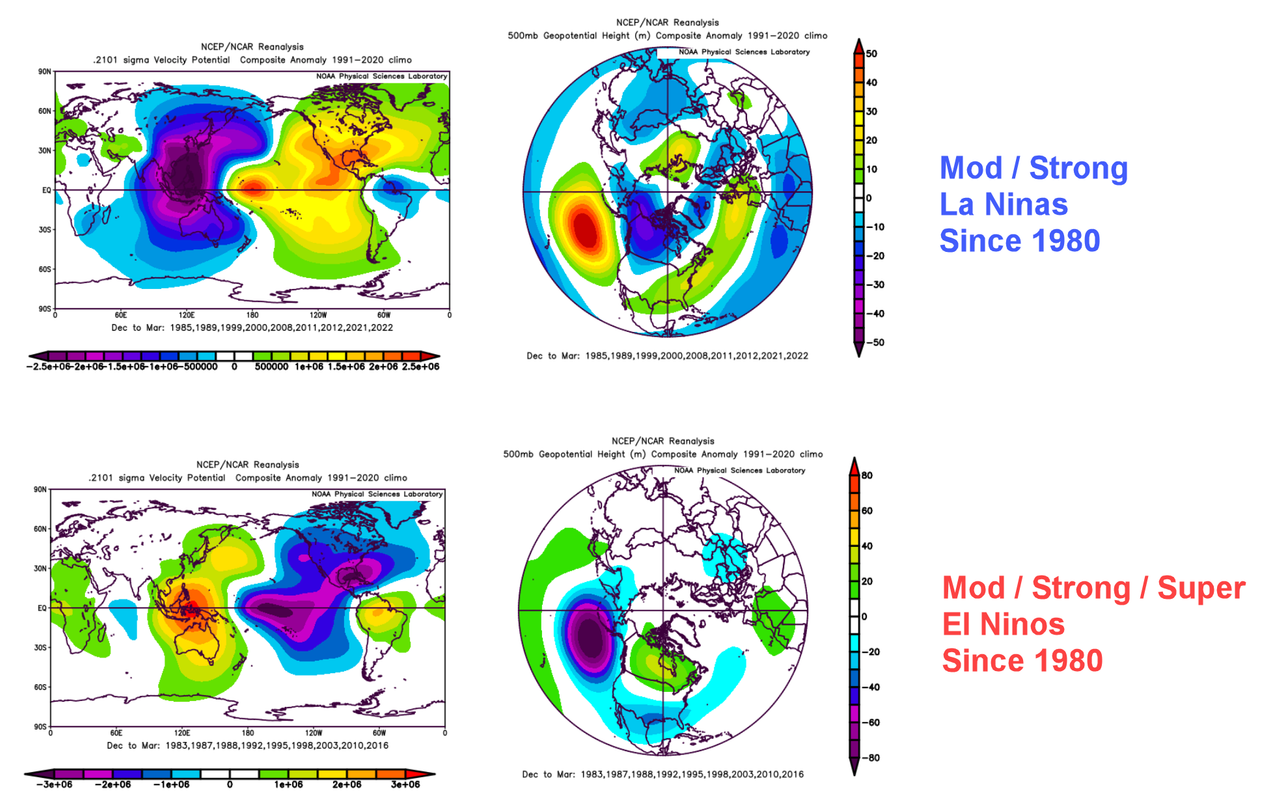
Here are a few charts showing VP to 500mb pattern matches...
1st one is VP and 500mb for all Moderate and Stronger La Ninas vs El Ninos since 1980
2nd one is VP and 500mb for (Top 10 Most Neg / Top 10 Most Pos) PNA in January since 1980
The maps are lining up as one would expect

-
3
-
-
3 hours ago, Stormchaserchuck1 said:
So what? It correlates with -PNA..
The point was......prior years that had the type of VP spatial pattern in the Sep-Nov timeframe on the image I posted tended to continue with that look into winter...and during El Nino, low frequency (3-4 month) -VP uplift in the central Pacific with +VP in Indonesia and Brazil absolutely does not correlate with a -PNA
-
3
-
-
13 minutes ago, Stormchaserchuck1 said:
We're getting a pretty good Kelvin Wave right now.

Definitely a wave that will add some warming, but it doesn't look hawt IMO - more like a lot of the ripples we've been seeing this year
-
1
-
-
On 8/1/2023 at 7:18 PM, griteater said:
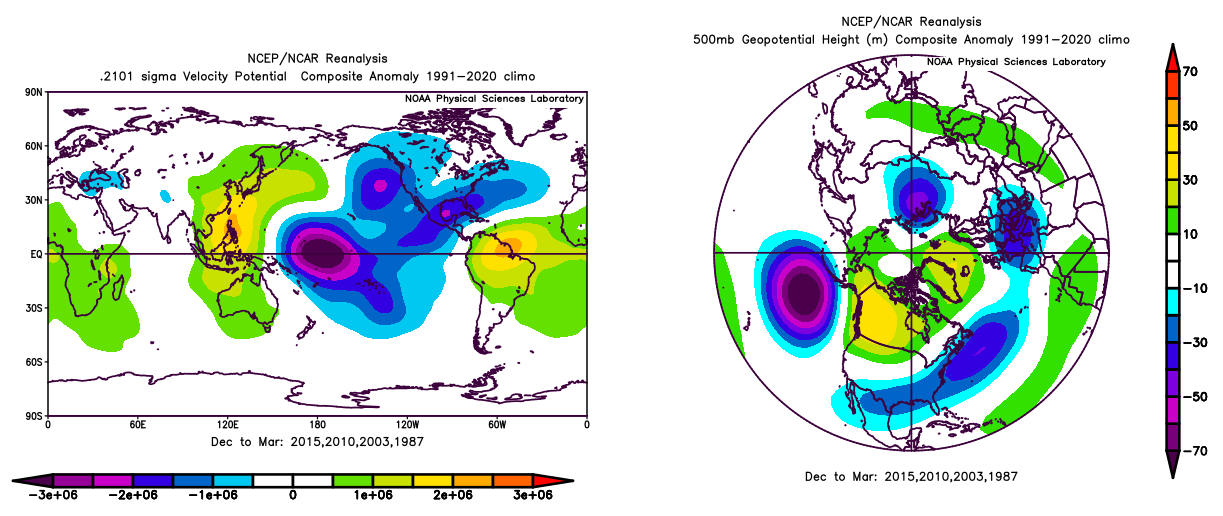
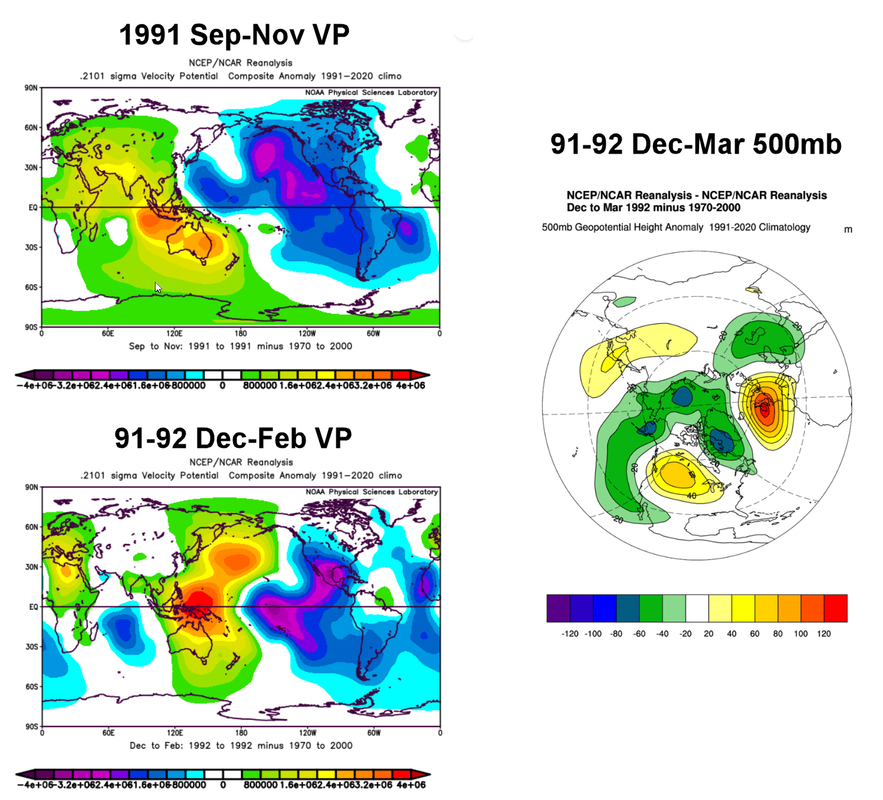
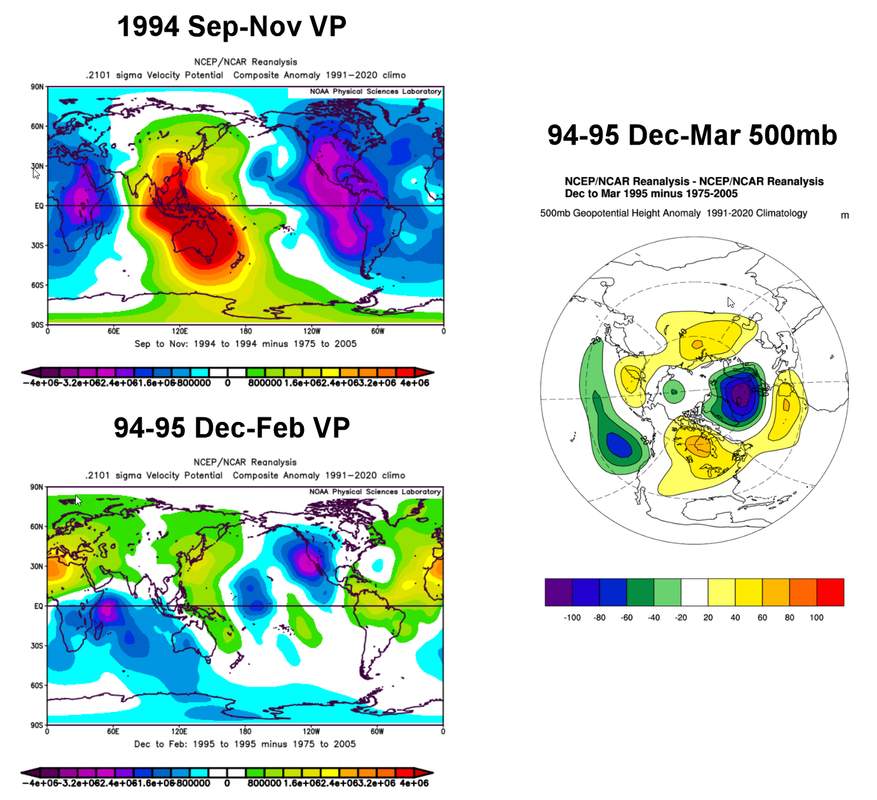
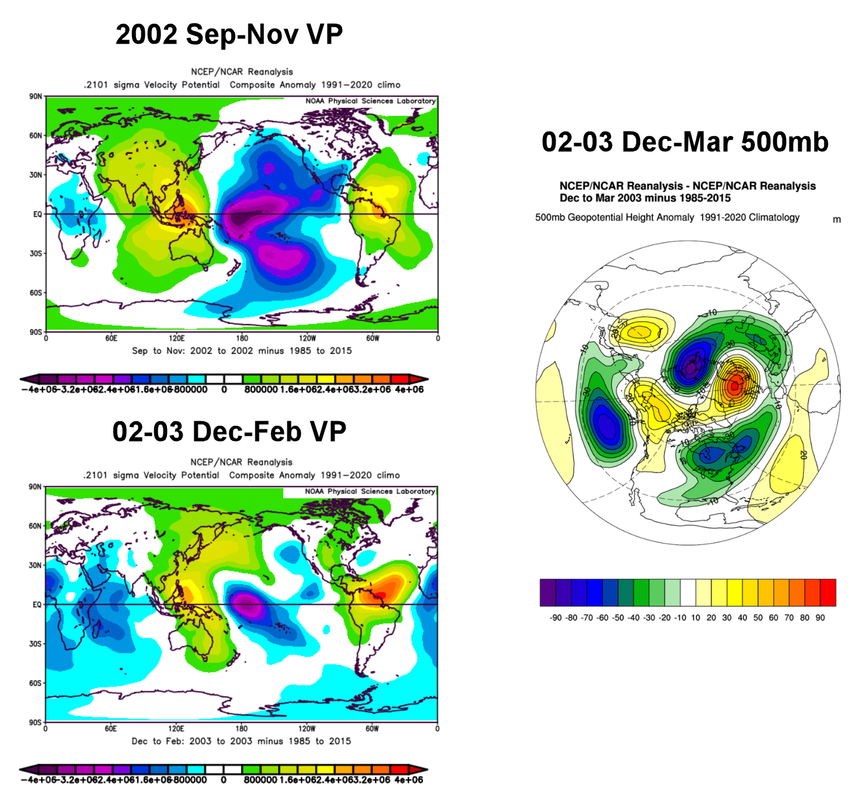
In scanning thru some VP images, it seems like the VP that sets up in the Sep-Nov timeframe tends to throw out some clues in terms of how things will go in the winter.
The El Nino years when the Sep-Nov -VP is either heavy in the E Pacific or extends from the E Pacific into S America, the resulting winter pattern has more of an east-based look with Aleutian Low pressure farther east and northern conus and S Canada ridging. See 91-92 and 94-95 (same ideas for 15-16, but image not shown)
The El Nino years when the Sep-Nov -VP is weaker in the E Pacific and positive in S America, the resulting winter pattern has more of a west-based look with Aleutian Low pressure farther west and ridging into AK and W Canada. See 02-03 and 09-10 (same ideas for 14-15, but image not shown)
Note that the VP pattern among the 4 years in the winter isn't as different as it is in the fall (2 camps seen in the fall)
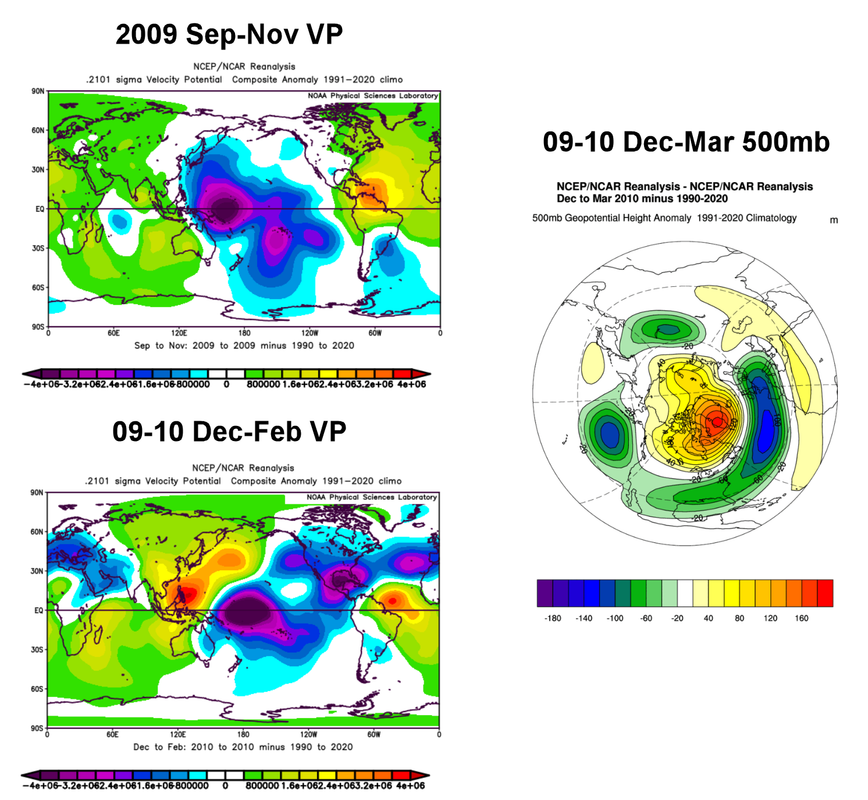
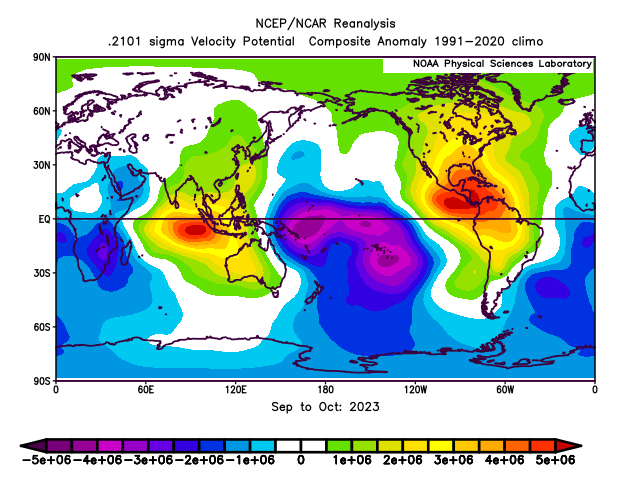
Checking back in on this post, so far in the Sep-Oct period, we are aligning more with the west-based look from a VP standpoint. And scanning thru the ensemble forecasts, I see no reason to think that November is going to see a major change from what has already occurred in Sep-Oct.
Here is what we've seen so far in Sep-Oct...
-
6
-
2
-
-
14 minutes ago, mitchnick said:
I'd be happy with a weak pv to at least avoid a December shutout and hope for the SSW down the road. Heck, we don't require a SSW event in strong Niños with well placed forcing anyway.
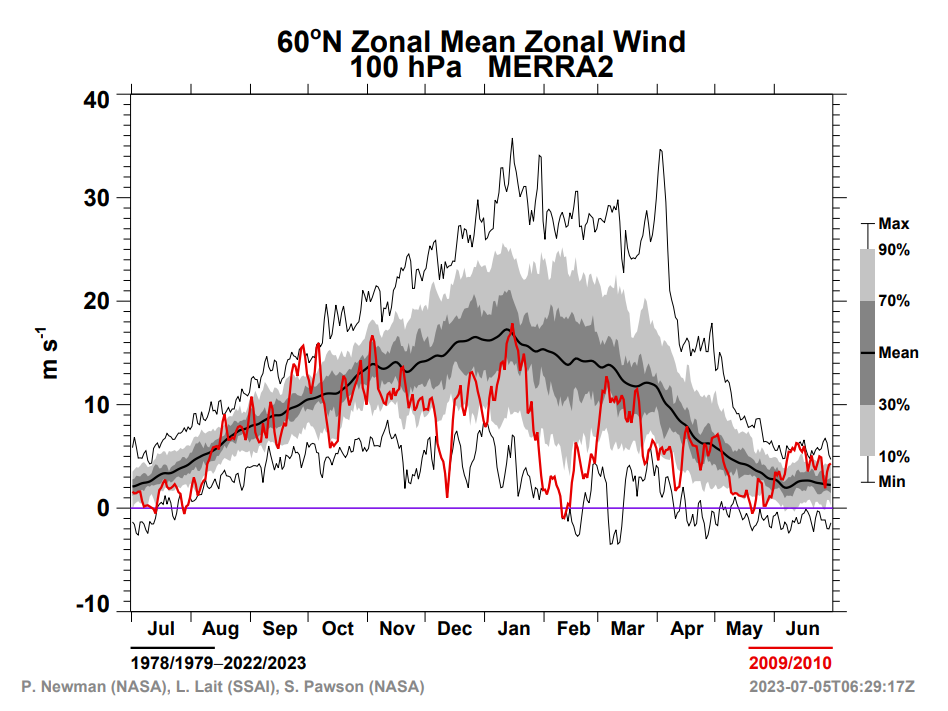
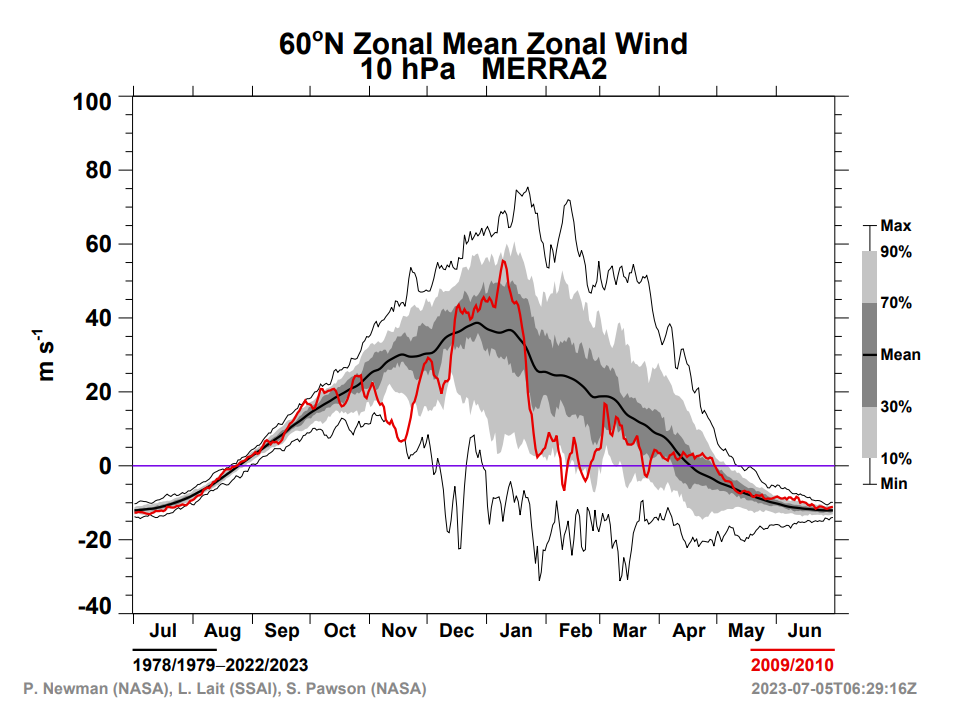
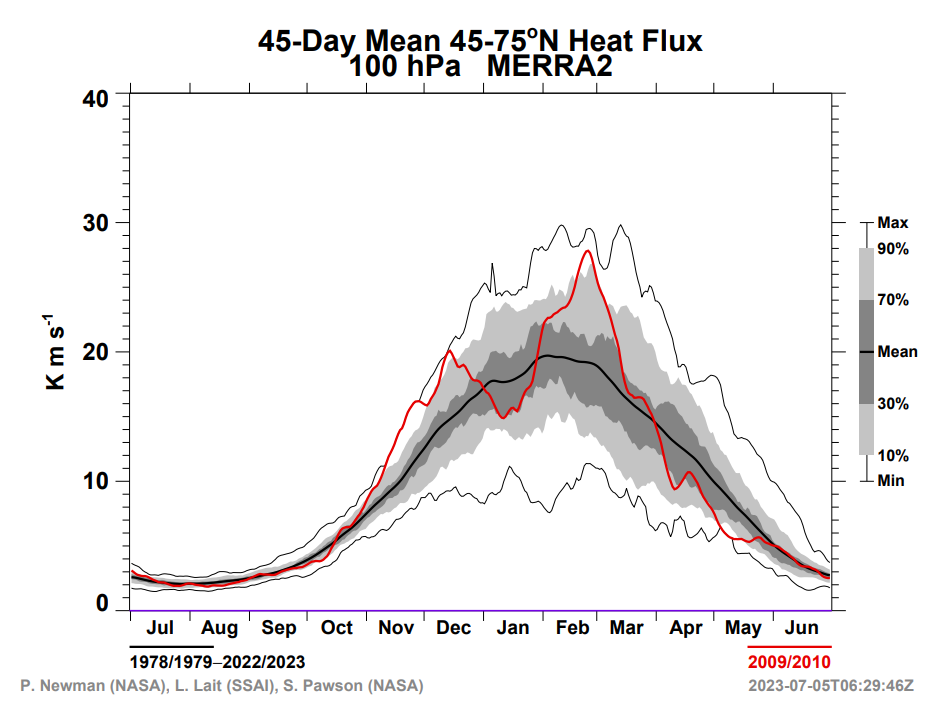
Agree. If you look at 09-10, it had weak zonal wind in the lower stratosphere at 100mb (1st image) from mid-Nov all the way to April (makes it much easier for blocking to develop in the troposphere). At 10mb (2nd image) in the upper stratosphere, there was a sharp weakening in early November, then another in late Jan into early Feb, with an official SSW occurring. But bottom line, we want to see elevated heat flux (3rd image) / disruptions to the Strat PV...getting an official SSW is an extra bonus.
Excellent description of heat flux on the NASA Ozone Watch site (https://ozonewatch.gsfc.nasa.gov/meteorology/flux_2009_MERRA2_NH.html):
"Variations of temperature are strongly affected by weather systems in the troposphere. Very large-scale weather systems or waves can move or propagate upward into the stratosphere. The upward propagation of these weather systems warms the polar region. We measure this upward flow of wave energy with the eddy heat flux. The eddy heat flux is the product of north-south (meridional) wind departures and temperature departures from their respective zonal-mean values. There is a strong anticorrelation between stratospheric temperature and the 45-day average of the eddy heat flux lagged prior to the temperature. A more positive value of eddy heat flux indicates that wave systems are moving into the stratosphere and are warming the polar region. Wave events distort the polar vortex and allow for greater mixing inside the vortex. These events can result in major and minor polar warmings."
-
10
-
1
-
-
4 hours ago, Terpeast said:
I’m no expert on SSW events so I’d defer to @GaWx on this, but if this plays out as forecasted, this could be an interesting January for most of us up and down the EC.
The El Nino / -QBO combo is a good one for SSWs, -AOs, and -NAOs. Posted this in the Winter thread a few months back...
And during El Ninos, Sudden Stratospheric Warmings (SSW) have occurred in 8/10 cases (80%) when the QBO was negative in winter (40mb on Jan 1). And in the 8 cases where an SSW occurred during Nino and -QBO, the combined AO/NAO index was negative 6/8 cases (75%).
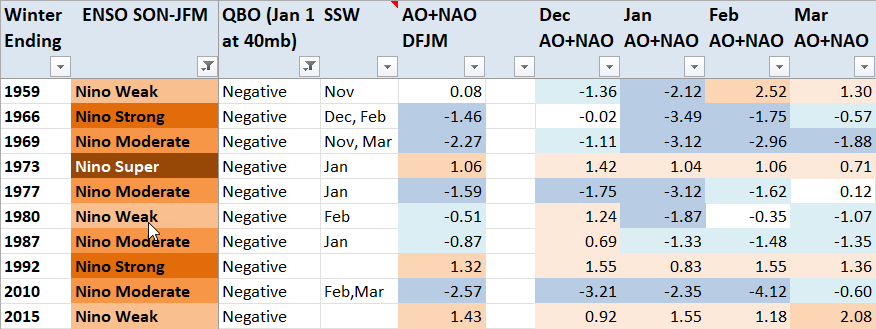
In contrast, when the QBO was positive in winter during El Ninos, SSWs have occurred in only 6/13 cases (46%). And in the 6 cases where an SSW occurred during El Nino and +QBO, the combined AO/NAO index was negative in only 2/6 cases (33%).

-
4
-
5
-
-
14 minutes ago, snowman19 said:
For some reason, everything is shifted a bit farther west than you'd expect with this year's El Nino / IOD (the color palette is reversed on the right side for the OLR comparison)
-
4
-


El Nino 2023-2024
in Weather Forecasting and Discussion
Posted
Just flipping thru some reanalysis images, it looks like the surface pressure anomaly pattern was weak in Oct - you need strong low anomalies in E Pac and strong high anomalies in W Pac for high MEI. Accordingly, the 30-day SOI in October rose thru the whole month
Same for low level zonal winds - need strong westerly anoms across the West and Central Pac for high MEI - didn't have that in Oct.
OLR pattern for +MEI looked OK, but not robust