

griteater
-
Posts
9,634 -
Joined
Content Type
Profiles
Blogs
Forums
American Weather
Media Demo
Store
Gallery
Posts posted by griteater
-
-
1 hour ago, Terpeast said:
Interesting. Not quite sure what to make of this. Could it be coincidental with other factors being the drivers?
1 hour ago, bluewave said:It think it’s coincidental since 2 years were super El Niño’s which are warm and 3 were -PDO El Niño’s which were warm also.
In theory, it makes more sense for El Ninos to have +IOD and La Ninas to have -IOD
+IOD: subsidence in Indonesia
-IOD: uplift in Indonesia
I would say two things come to mind with the effects of +IOD:
1) Early winter would favor MJO 8-1 forcing which is warm in the east in November into mid-December, but flips cool thereafter
2) I believe bluewave linked a paper that discussed the big +IOD from autumn of 2019 and the idea of the powerful uplift cell from Africa to India leading to the big +AO that winter. Not seeing that type of structure thus far when viewing the past 3 months
-
 5
5
-
 1
1
-
-
6 hours ago, 40/70 Benchmark said:
Others can feel free to chime in, but I feel like the bitching over outlook release dates is a loser's lament for 2 primary reasons...
1) Not sure there is much skill to be gained in issuing a 60-90 day forecast over a 90-120, regardless of the forecaster's elevation.
2) I feel like its incumbent on the forecaster to publish whenever they feel as though they have enough info to do so, which for me is after Halloween, when the SAI data is in...not a huge deal, but its one indicator I like to mention in the interest of being exhaustive. Bitching about others releasing later is akin to crying to the teacher that you weren't the last to hand your test in, after the fact. You are done when you say your done.
Obviously if you are a pro and have a deadline, that is different...but I still don't get the whining.
Ha yeah we don't have a governing body with rules on when outlooks are to be released and in what format. To me, releasing up to mid-November is fair game. There should be some level of advantage releasing in mid-Nov vs mid-Oct though as you get another month of the seasonal models coming out, plus you can get a bit better feel for how December is going to turn out if it's a year where there is an established cadence with the MJO & AAM progression. But agree, you can't release early and complain about comparing to those releasing later...you can't have it both ways.
-
1
-
-
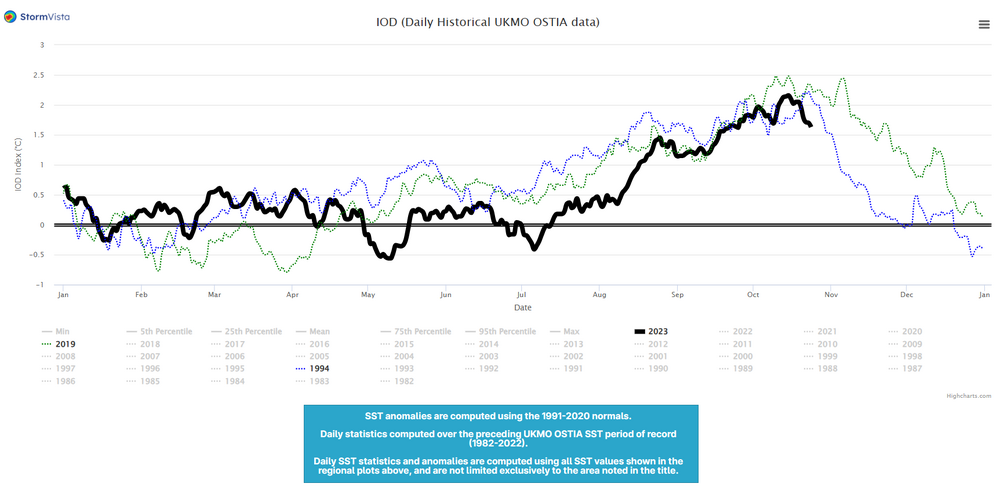
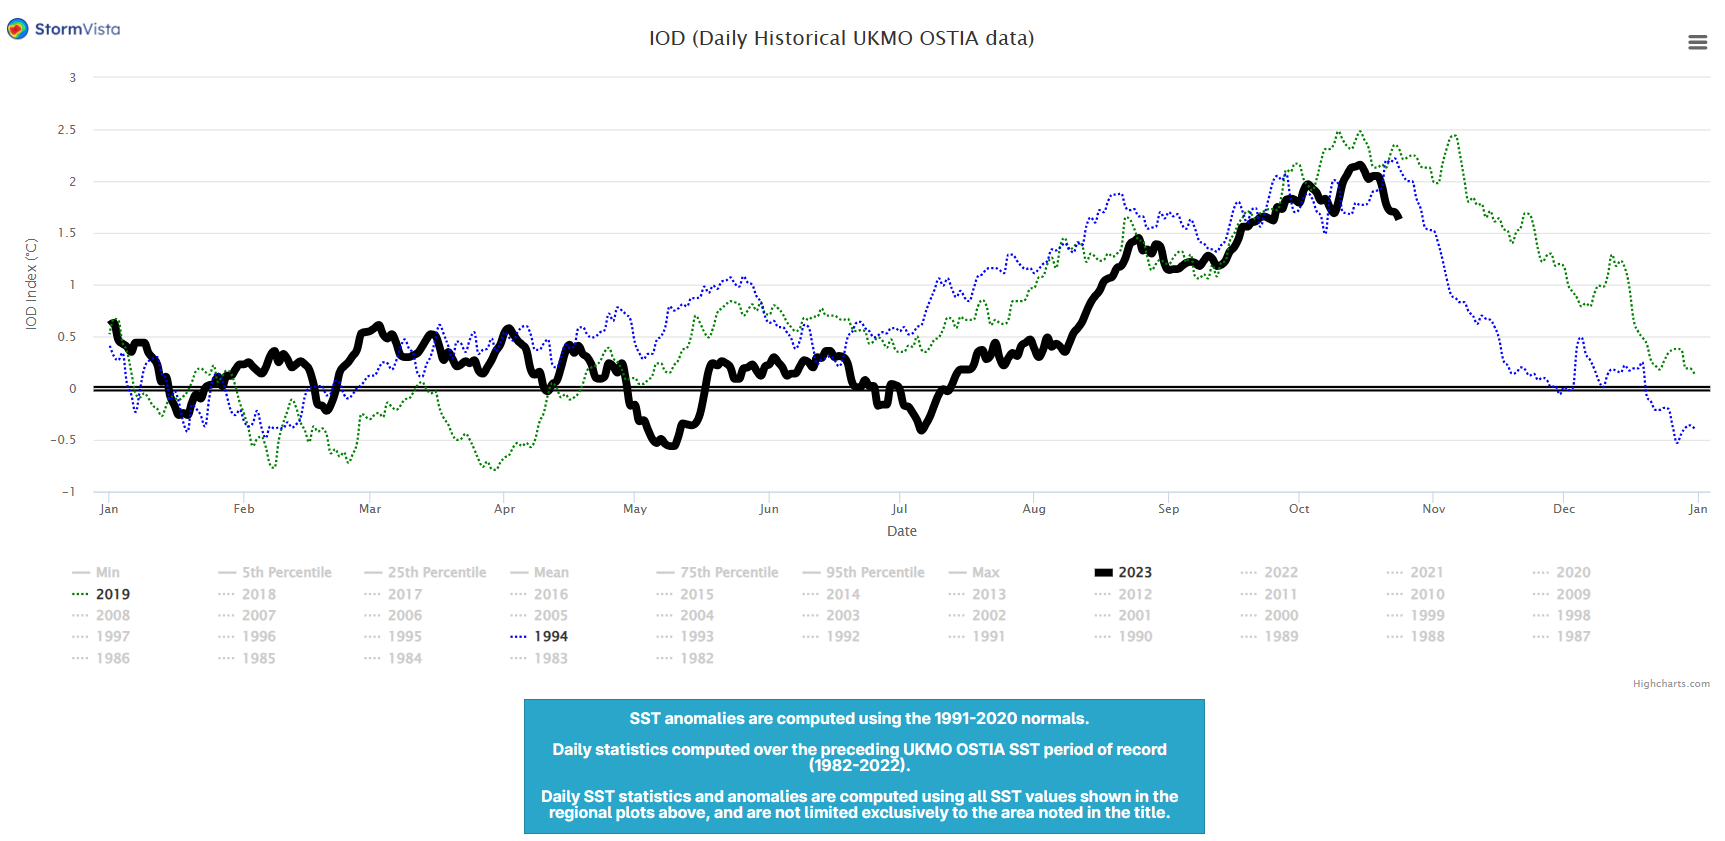
Here is the latest IOD chart from UKMO OSTIA with comparison to a couple of other big +IOD years
Black - 2023, Blue - 1994, Green - 2019
-
2
-
-
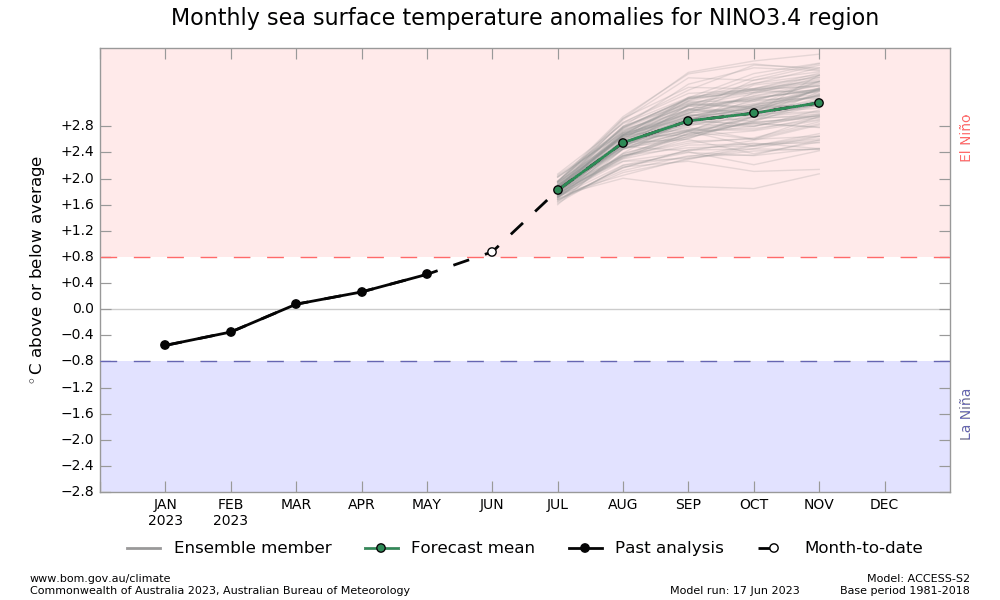
1 hour ago, snowman19 said:
IMO we see rapid warming in the coming weeks in regions 3.4, 3 and 1+2. I think we hit +2.0C in early November in 3.4 and we approach or reach +3.0C in region 1+2, we may approach +3.0C in region 3 as wellWe have some vastly different opinions in this thread on the degree of warming and where this ends up, that’s for sure. Rapid warming and tepid warming are pretty far apart at this stage in the game
-
3
-
1
-
-
So why is the MEI lagging behind the ONI when compared to other oncoming El Ninos?
Here are the MEI (Aug-Sep) <and> ONI (Jul-Sep) values for this year, and 3 previous oncoming El Ninos:
2023: 0.6 (MEI) / 1.3 (ONI)
2015: 2.1 (MEI) / 1.9 (ONI)
2009: 0.4 (MEI) / 0.6 (ONI)
2002: 0.7 (MEI) / 0.9 (ONI)
Now here are the 5 variables that comprise the MEI calculation (Aug-Sep bi-monthly correlations shown). In simple terms, the more closely the actual anomalies align to each of these 5 ocean / atmosphere variables, the higher the MEI value will be.
I compared each of the 5 variables to the reanalysis maps for Aug-Sep of this year. In order to match what is used in the MEI calculations, I used the JRA-55 reanalysis against a climatology base of 1980-2018 for the first 4 variables. The last variable, OLR, was unavailable in JRA-55, so I used NCEP/NCAR R1 instead.
On the images, I have marked in thick black lines where the largest discrepancies have occurred between the MEI correlation maps and the actual reanalysis maps for this year (Aug-Sep in this case).
It looks like the largest discrepancies are on the 10m Zonal Wind Anomaly (U Wind) and Outgoing Longwave Radiation (OLR) maps. The closest match to the MEI correlation maps is on the 10m Meridional Wind Anomaly (V Wind) map.
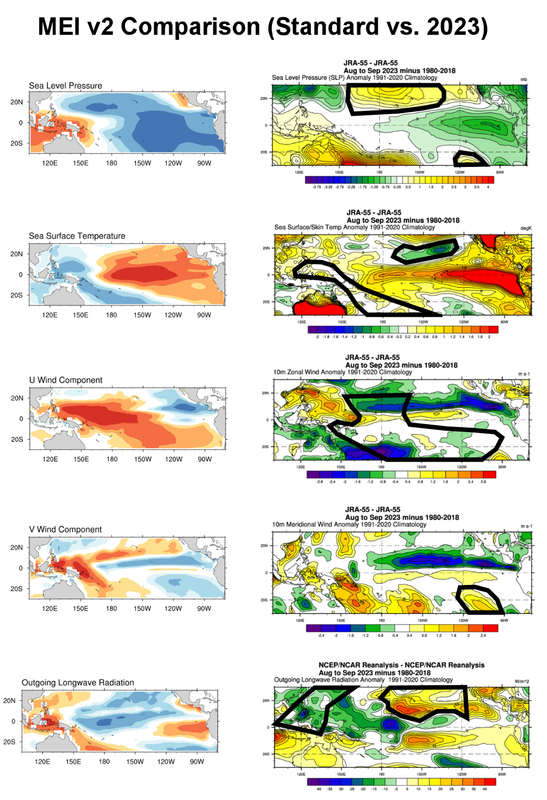
What does it all mean? I'd say that is up for interpretation, but clearly, the zonal wind and OLR patterns need to evolve closer to the stock El Nino anomaly patterns in order for the MEI value to become more robust.
-
4
-
4
-
-
10 minutes ago, brooklynwx99 said:
gotta say, if we top out at +1.7-1.9C with west-leaning forcing and a MEI in the +1.0-1.4C range, those weenie-ish CanSIPS depictions might not be as ridiculous. I'm feeling pretty good about things right now. you should be psyched where you're at
Ha, I think at a minimum there will be some interesting and good periods for many from the Southern Plains to Northeast, and down to the SE (not full winter, but some good periods). Bar is pretty low down here of course. As a forecast, I'll go with 1 classic Mid-Atlantic KU at a minumum (wintry mix for me) and 1 good southern slider...and call it a winter.
-
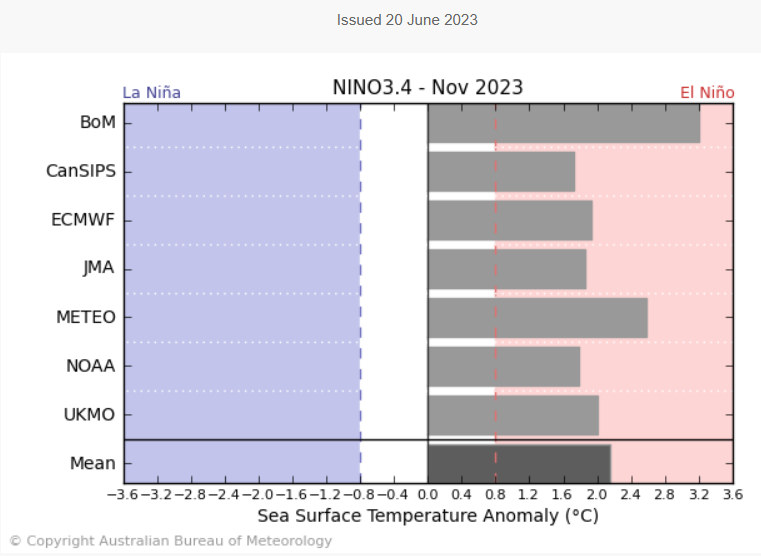
9 minutes ago, brooklynwx99 said:
I would be pretty shocked if this event has a trimonthly period at or over +2.0C. perhaps a daily reading at that level, but three months? the ECMWF is going to bust horribly
The Australian BoM says "hold my beer"
-
1
-
 6
6
-
-
2 hours ago, snowman19 said:
I really don’t think the -PDO is forcing the pattern even though it’s strongly negative. Maybe when it was record strong positive like back during the 14-15 winter, there was some feedback with those insanely warm ++ GOA and west coast SSTs, but other than that, no. Studies have shown that ENSO forces the PDO, not the other way around.
The 2 main drivers I see this winter will be the El Niño and ++IOD. I think the MJO will largely be a non factor which is typical with strong ENSO events. When there is activity I expect it to be weak and fast moving and not in “La Niña” phases 3-6, so I guess that’s really a plus.
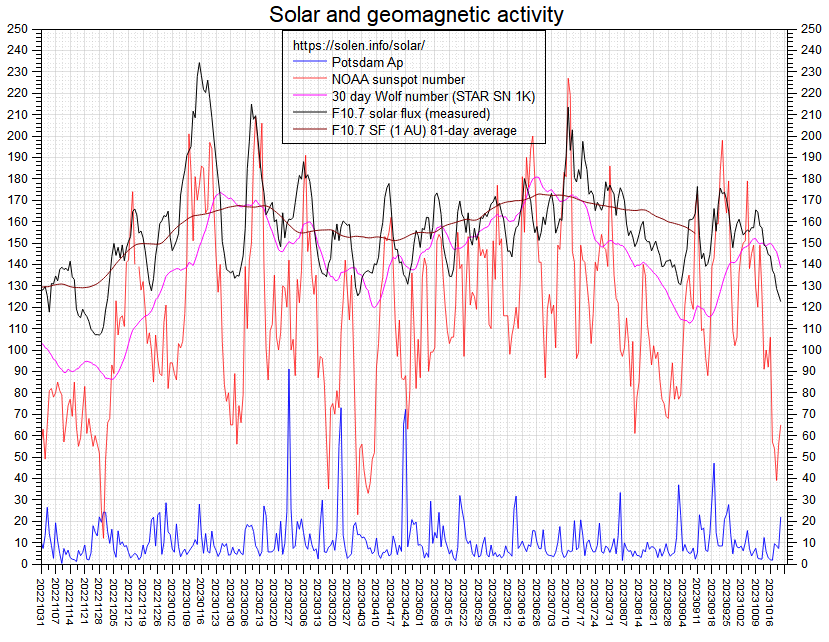
The other secondary factors I see are the Hunga Tonga water vapor…what effects does that ultimately have on the stratosphere?, -QBO, solar (very high solar activity and geomag, approaching a solar max), ++AMO; right now there is no semblance of a “tripole”/New Foundland cold pool in the Atlantic, raging strong STJ, AGW must be factored in too. I can care less what arctic sea ice and Judah’s SAI does as both have proven to be a debacle over the last 15 years, that said, Siberian snowcover development to this point in time has been really horrible, lowest of the last 9 years on his index chart and sea ice is very low, below average…..the people who still follow it, take that for what you willOne thing I disagree on is with respect to solar. Yes, the sunspot and solar flux numbers are elevated as we approach solar max for this solar cycle, but the geomag and solar wind numbers are running pretty low right now…and that’s the rationale for descending solar being the worst portion of the solar cycle for -NAO. That is, as the sunspot and solar flux numbers go past peak and decline, that’s when the geomag and solar wind numbers are typically at their highest. We’re probably looking at this winter and next as roughly solar max for sunspots and flux, with 25-26, 26-27, and 27-28 being the winters with max geomag and solar wind numbers (known to favor +NAO) . On this chart, the blue line at the bottom is solar geomag (Ap)
-
1
-
2
-
-
1 hour ago, bluewave said:

Yeah and for January, the Euro had a much better stock El Niño look for the Eastern U.S. in its September release with Aleutian Low / Eastern Trough / Davis Strait Ridging
-
49 minutes ago, Terpeast said:
When do the November runs come out? Thinking of holding off on my winter outlook till then. Too many moving variables atm
Here is your November Itinerary
")
10/31 (Aftn): CANSIPS Update on Twitter
10/31 (Evening): CANSIPS Update on Tropical Tidbits
11/3: Aug-Oct ENSO ONI & ENSO RONI Updates from NOAA
11/5: Update of Euro Seasonal Forecast
11/5: ENSO MEIv2 Update from NOAA
11/10: Update of Copernicus C3S Ensemble Seasonal (with this, can also view JMA / Meteo France / UKMet Office updates)
11/10 to 11/20: Update of JAMSTEC Seasonal
-
4
-
3
-
-
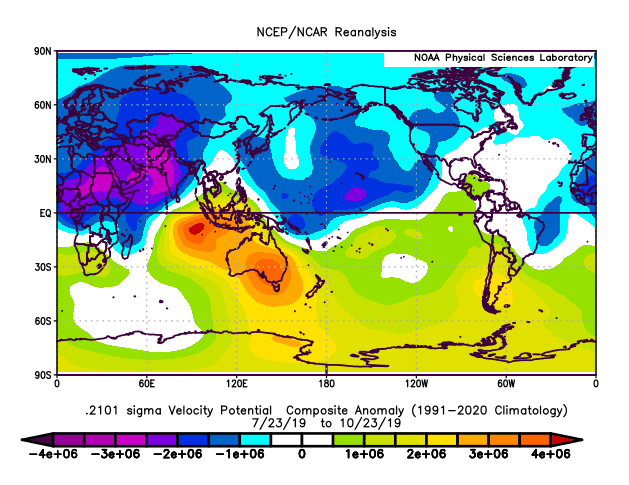
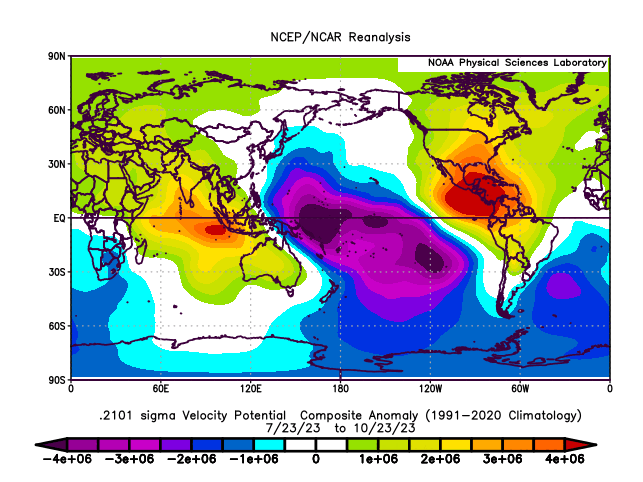
Sep-Oct VP for all years with El Nino and noteworthy +IOD since 1980:
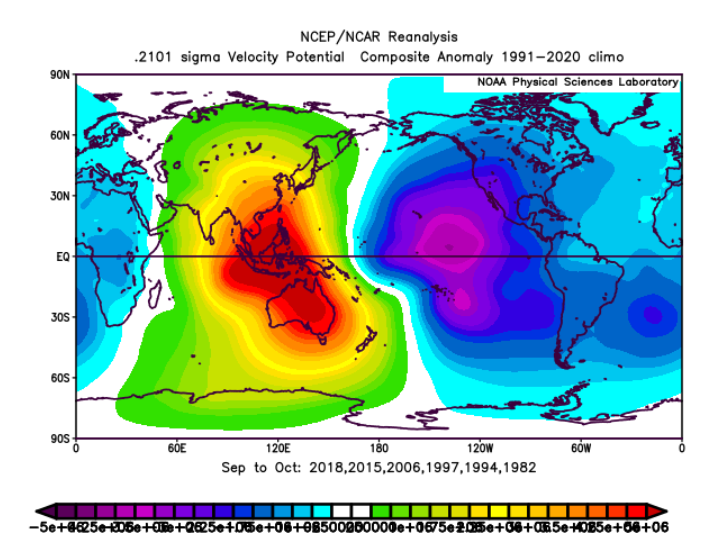
Same, but removing the Super El Nino years - same placement, but with less intensity:
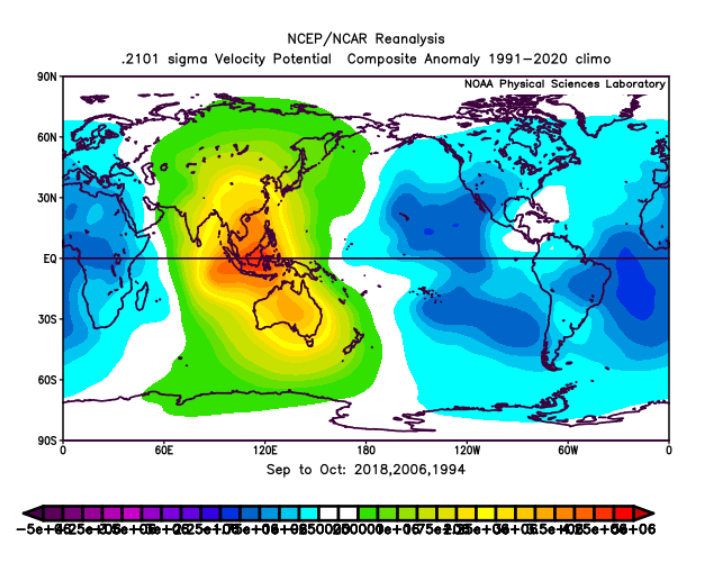
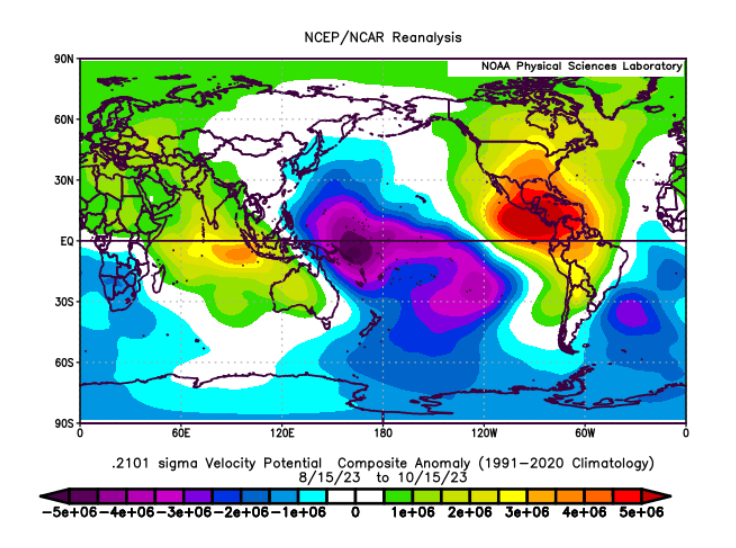
Here is this year for the 2-month period of Aug 15 to Oct 15. It's different from the above composites so far (bumped west)...
-
1
-
2
-
-
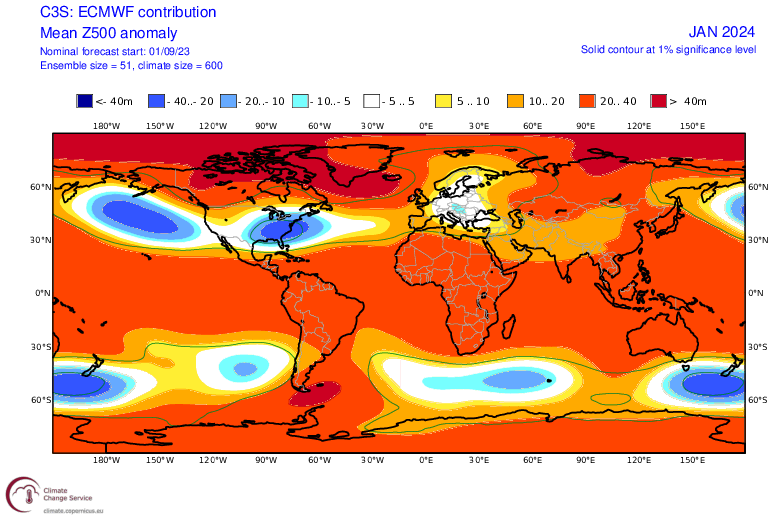
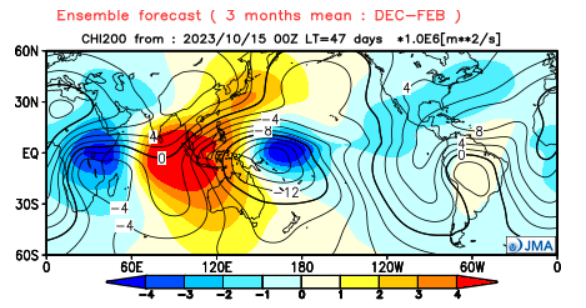
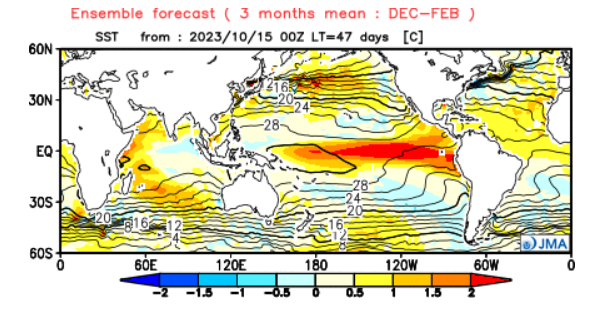
Here is the Oct JMA VP forecast for Dec-Feb. Max uplift along and just west of the Dateline (West El Nino forcing) and in E Africa (+IOD). Solid subsidence in E Indian Ocean and Indonesia. Maybe we finally get the MJO to be quiet in phases 3/4/5 this winter.
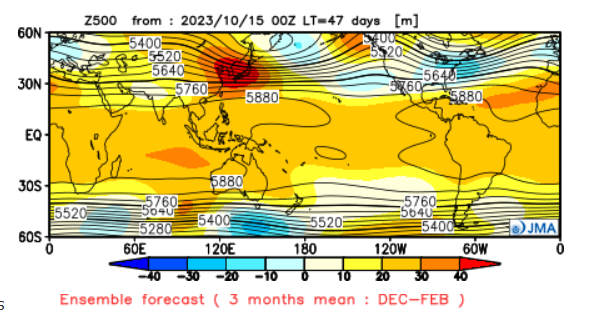
JMA 500mb forecast for Dec-Feb:
JMA 500mb forecast last October for Dec-Feb 2022-2023. It's pretty much the exact opposite of this year's forecast...
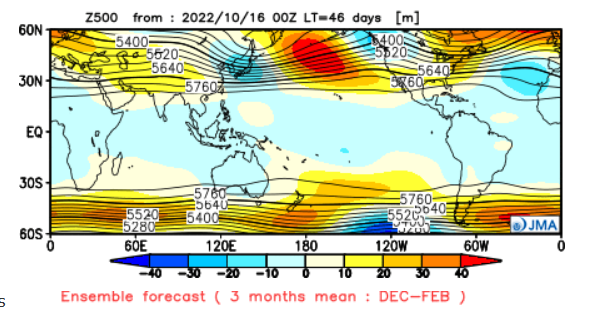
JMA forecast from Oct last year did quite well, though not perfect. Has the general ridge / trough pattern correct from E Asia thru N America, also with above normal heights in the N Atl. It was off with the severity / location of the below normal heights in E Asia & W North America
Finally, here is the JMA forecast for Dec-Feb SSTs. Basin Wide El Nino (SSTs) with solid cool zone in E Indian Ocean thru the Maritime Continent
-
6
-
2
-
-
From NOAA CPC Weekly MJO Update:
-
1
-
2
-
-
1 hour ago, Eskimo Joe said:
We want a +EPO, right?
-EPO is ridge in Alaska
-
2
-
-
29 minutes ago, GaWx said:
Interesting!
-Of the three -PDO/RNA El Niño winters since 1950, two were cool/1-3 BN in most of the SE: 1965-6 (had a cold Jan) and 1968-9 (all 3 of DJF cool).-ATL had its earliest measurable snow on record on 11/11/1968!
-But despite a big snow late Feb of 1952, all 3 of DJF of 1951-52 were AN, especially J.
68-69 was one of the all-time great Greenland blocking winters, where the heavy blocking overwhelmed the pattern. Similar pattern to Dec 2010 (-PNA / --AO / --NAO)
-
1
-
2
-
-
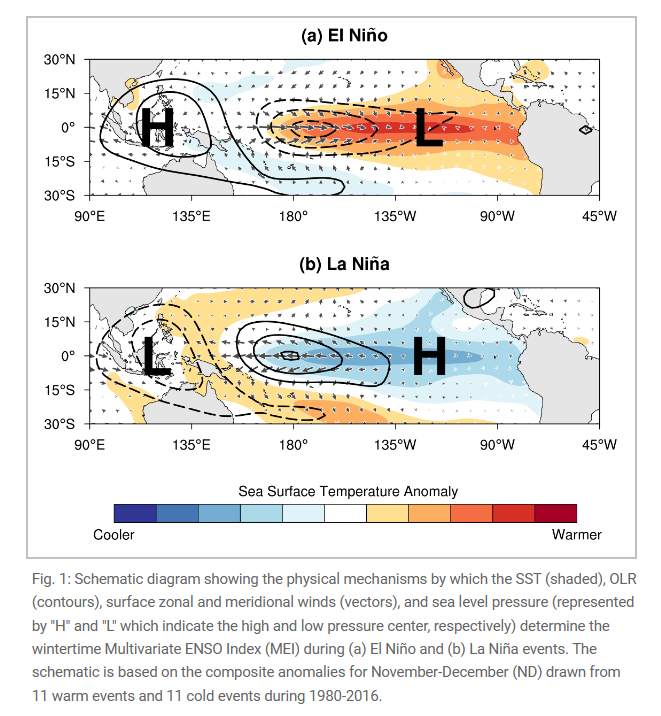
Aside from looking at recent 500mb patterns, the MEI is another good metric for measuring the ocean and atmosphere coupling associated with ENSO.
The MEI is currently tracking more closely with prior weak/moderate strength El Ninos instead of strong/super El Ninos.
Source: MEI.v2: NOAA Physical Sciences Laboratory
Key features of composite positive MEI events (warm, El Niño) include (1) anomalously warm SSTs across the east-central equatorial Pacific, (2) anomalously high SLP over Indonesia and the western tropical Pacific and low SLP over the eastern tropical Pacific, (3) reduction or reversal of tropical Pacific easterly winds (trade winds), (4) suppressed tropical convection (positive OLR) over Indonesia and Western Pacific and enhanced convection (negative OLR) over the central Pacific (Fig. 1a). Key features of composite negative MEI events (cold, La Niña, Fig. 1b) are of mostly opposite phase. For any single El Niño or La Niña situation, the atmospheric articulations may depart from this canonical view.
Two other sources to consider:
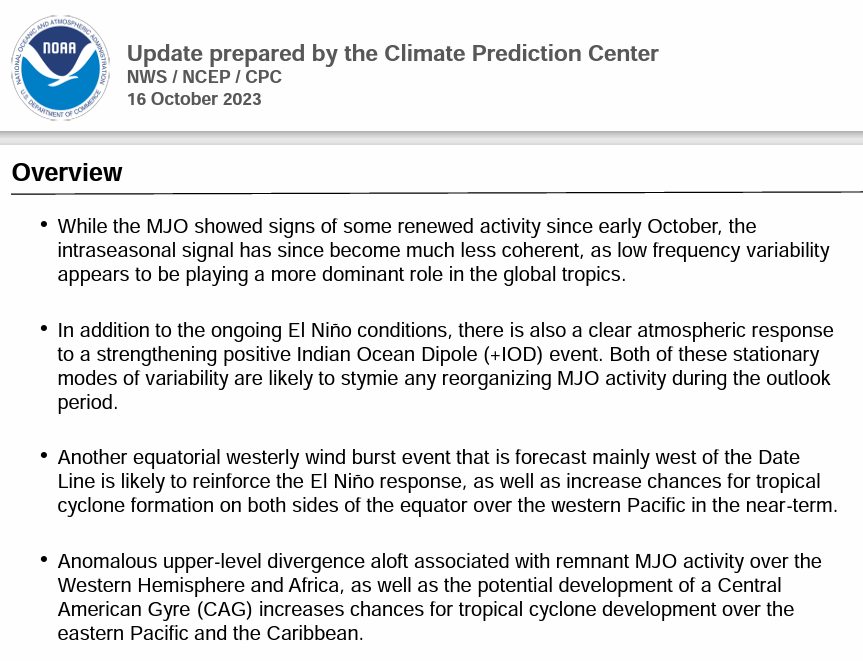
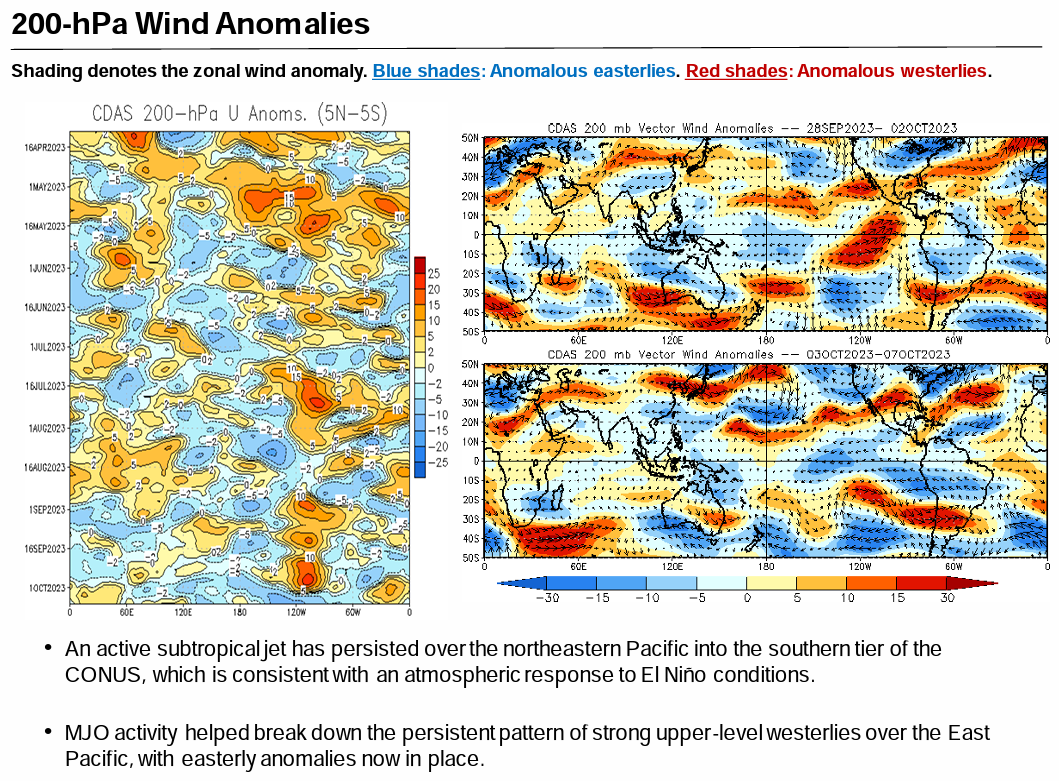
1) The Weekly ENSO update from NOAA has good info on the state of ENSO (comes out every Monday). Here is one of the images from the most recent report showing the developing pattern of persistent, anomalous upper level divergence (-VP) along the dateline, an enhanced convective signal associated with El Nino.
Source: enso_evolution-status-fcsts-web.pdf (noaa.gov)

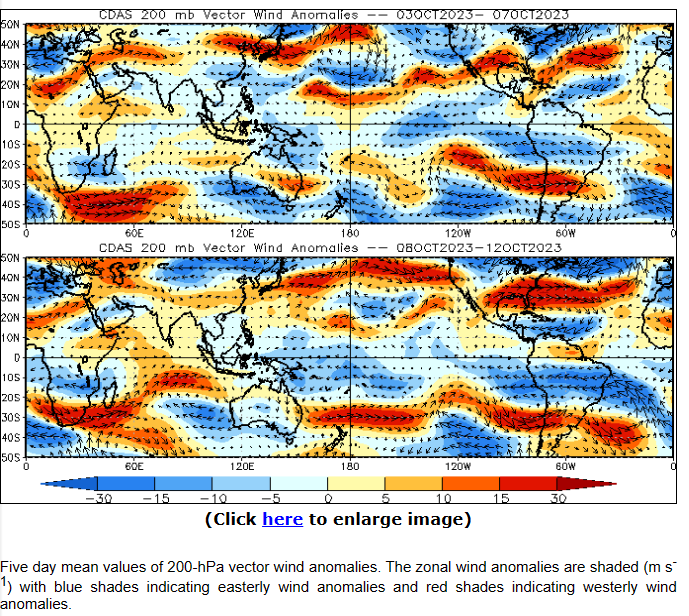
2) And this link shows 200mb jet stream anomalies. Here we can see over the past couple weeks an enhanced subtropical jet signal emanating from the central tropical Pacific and extending into the southern U.S., an El Nino feature of course.
-
2
-
3
-
-
1 hour ago, Stormchaserchuck1 said:
TAO/Triton
It's going to be hard to get a -PNA that sticks without <-1 anomalies in the subsurface
For reference, this was the image you previously posted showing the PNA correlation box on the TAO/Triton images:
-
1
-
-
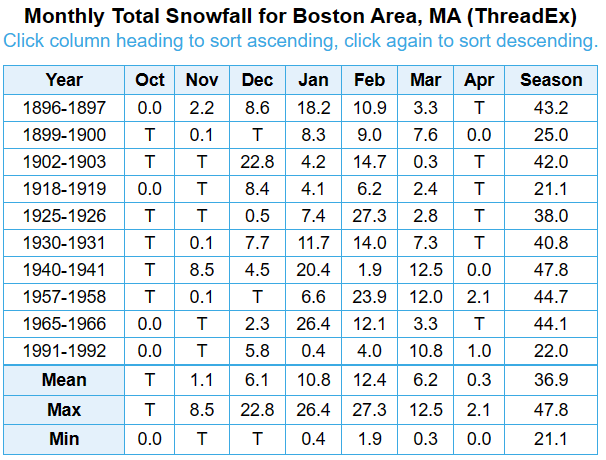
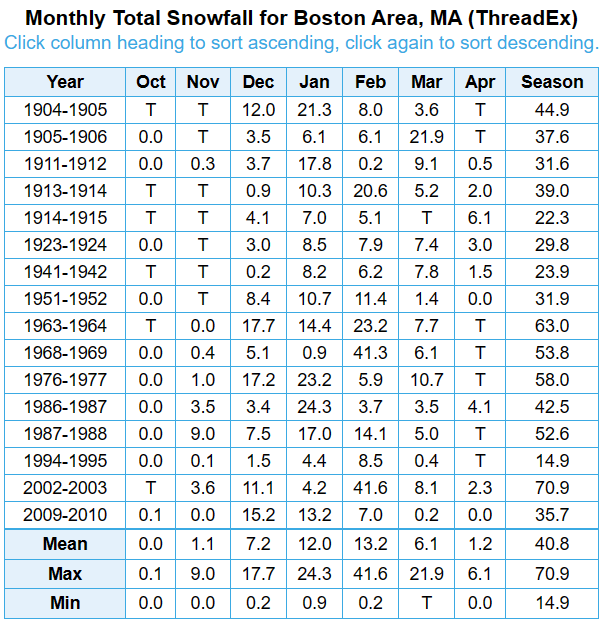
2 hours ago, snowman19 said:
There are some I've come across that don't really mention the term Super with El Ninos. So, when they say Strong / Very Strong, I think they really mean Super Nino (I've also seen that with Brian Brettschneider and Ben Noll).
Anyway, here are snowfall averages for Boston per El Nino strength:
Super Nino: 26.2 inches
Strong Nino: 36.9 inches
Moderate Nino: 40.8 inches
Weak Nino: 47.5 inches
All Winters (including Nino/Nina/Neutral): 42.7 inches
As seen below, indeed, there haven't been any Super Ninos with above normal snow in Boston, but 4 of the 10 Strong Ninos had above normal snow
Super Ninos:
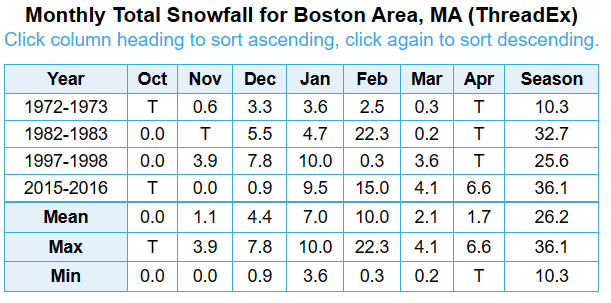
Strong Ninos:
Moderate Ninos:
Weak Ninos:

-
4
-
-
45 minutes ago, brooklynwx99 said:
in terms of winters, there is also a major difference between strong and super Ninos. strong ones can still be favorable while super is often a killer. we should just remain at strong, regardless of factors like MEI
Yeah, as mentioned earlier, I think Moderate and Strong are a logical grouping, especially this year with the OLR/VP wanting to hang back to the west. Super Ninos are in a different league to me. There's a threshold there where the wheels can come off, especially with surface temperatures (warm).
-
2
-
-
26 minutes ago, brooklynwx99 said:
these models are still likely suffering from excessive momentum. I think a trimonthly peak in the +1.6-1.9C range is most reasonable at this point
I thought the warming would continue slow and steady into Dec/Jan, but the current slowdown is pretty much a death sentence for Super Nino. Agree with your numbers. My guess in the contest was a tri-monthly peak of +2.0...that definitely looks high now.
-
4
-
-
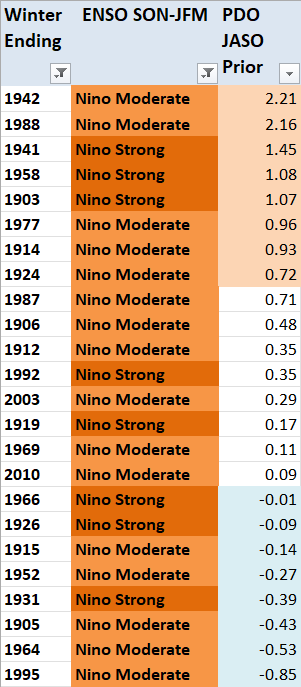
Since it looks like this is PDO day, I'll jump into the fray
Table of all Mod and Strong Ninos since 1900, sorted by the PDO averaged value for Jul-Oct prior to the given winter. Example: PDO averaged for Jul-Oct in 1941 was +2.21 prior to the 1941-1942 winter.
Note: my PDO numbers are from the old Univ of Washington PDO numbers (no longer maintained) - http://research.jisao.washington.edu/pdo/PDO.latest
I ran composites from the table above of the top 8 +PDO winters during Mod/Str Nino vs. top 8 -PDO winters during Mod/Str Nino
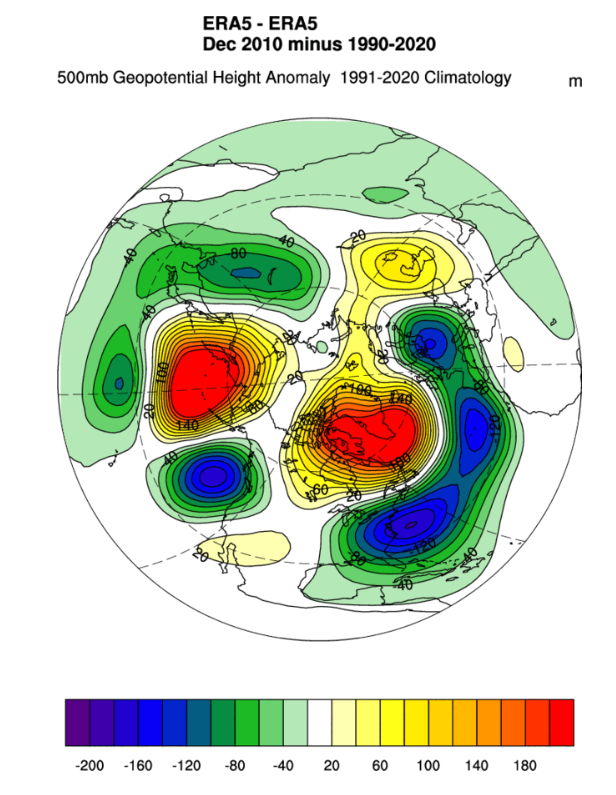
Top 8 +PDO winters during Mod/Str Nino (500mb for Dec-Mar):
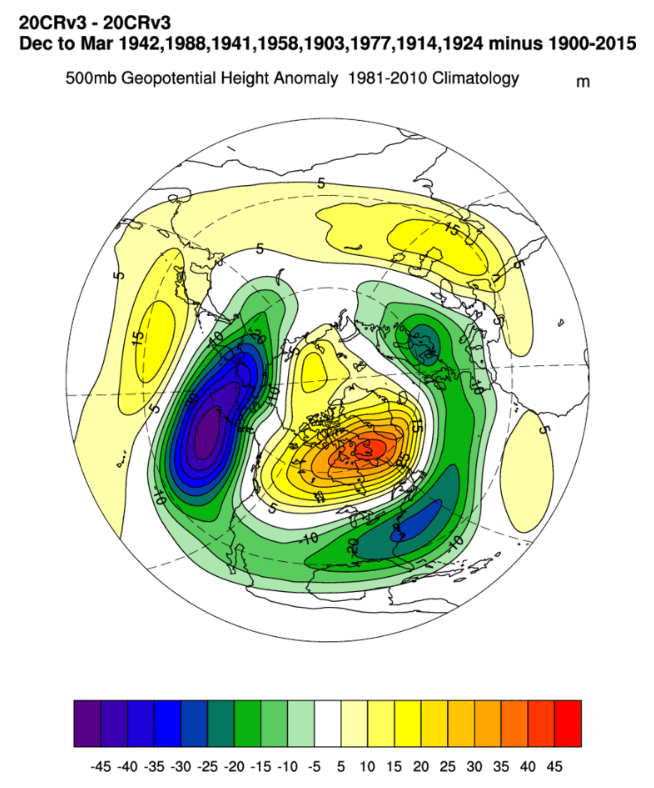
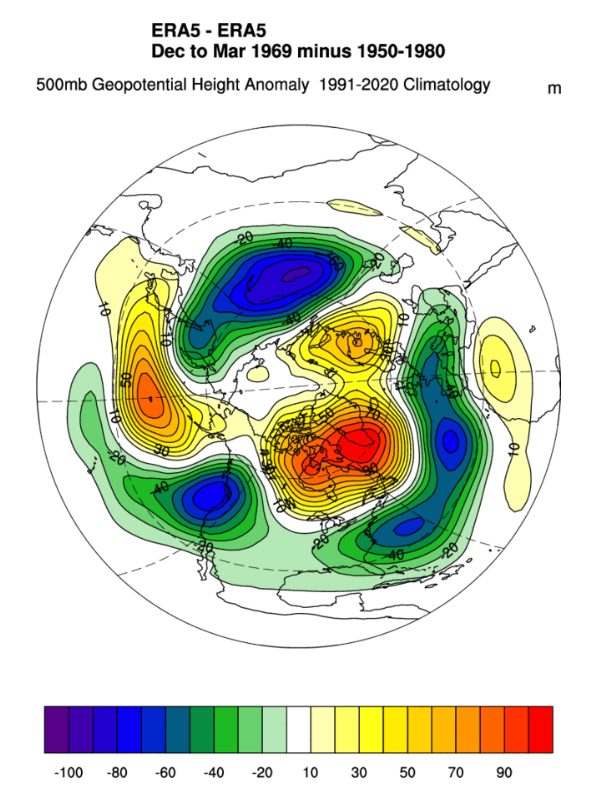
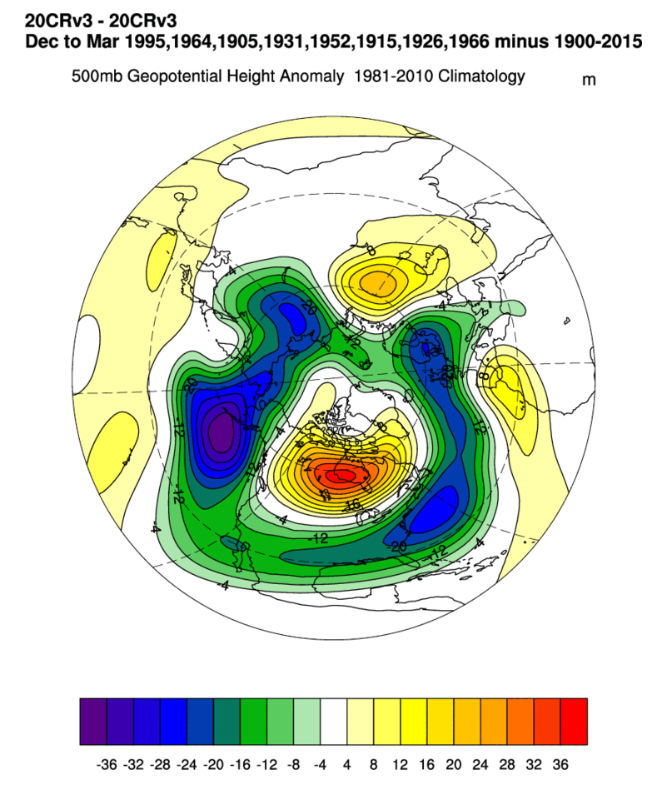
Top 8 -PDO winters during Mod/Str Nino (500mb for Dec-Mar):
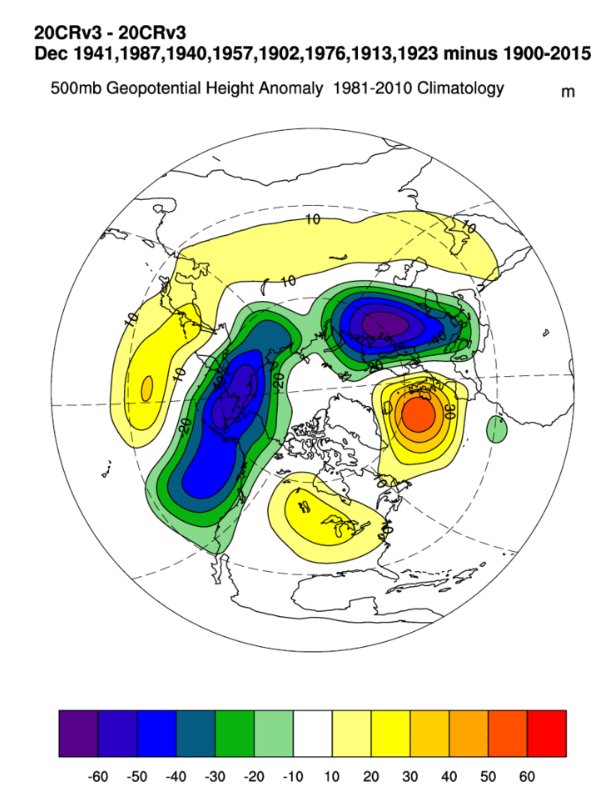
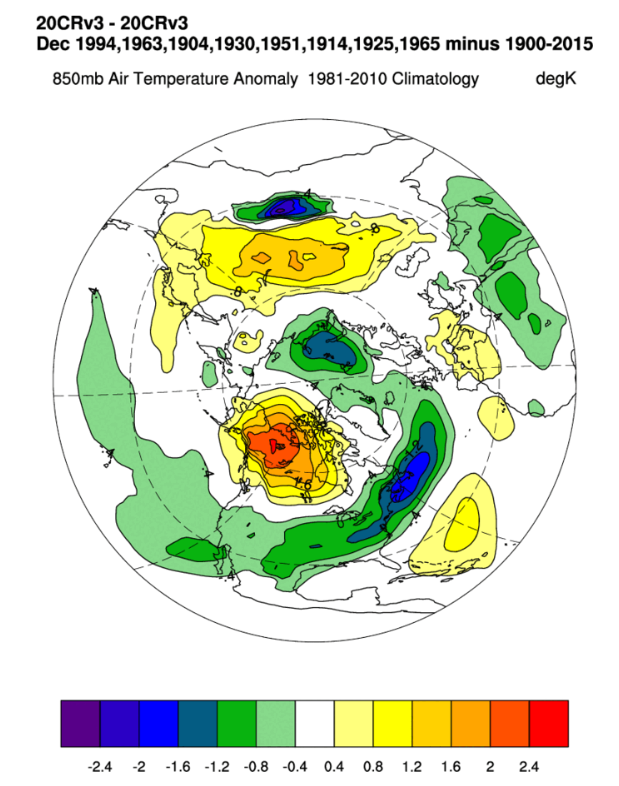
Top 8 +PDO winters during Mod/Str Nino (500mb for December Only):
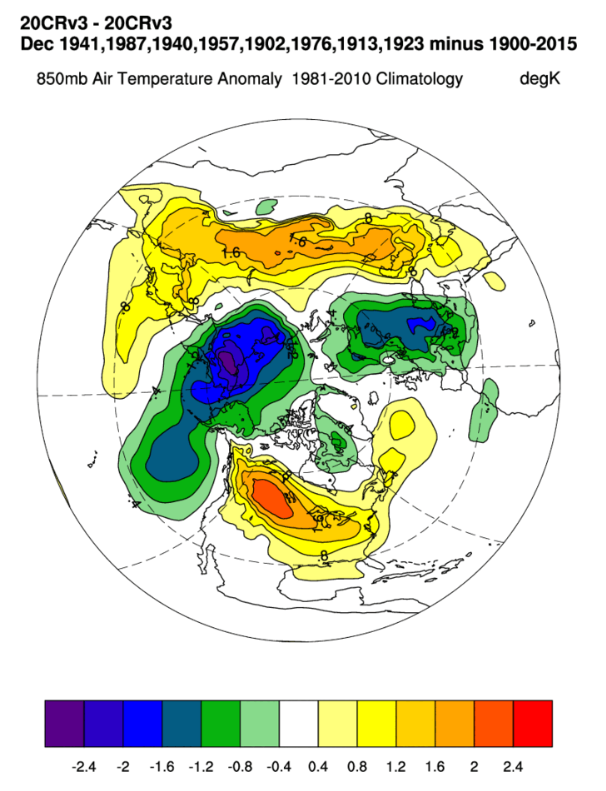
Top 8 +PDO winters during Mod/Str Nino (850mb Temperatures for December Only):
Top 8 -PDO winters during Mod/Str Nino (500mb for December Only):
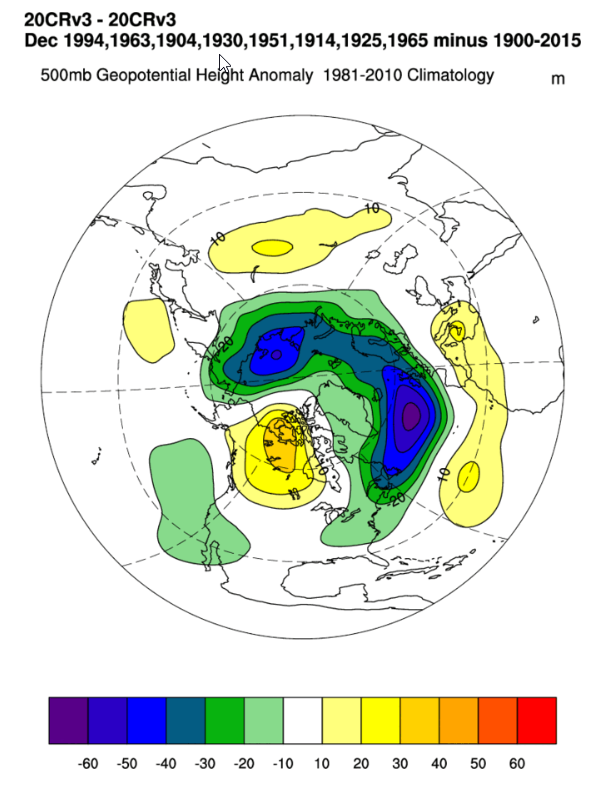
Top 8 -PDO winters during Mod/Str Nino (850mb Temperatures for December Only):
Reducing this to the only Strong El Ninos for the winter 500mb composites...
Top 3 +PDO winters during Strong El Ninos only (500mb for Dec-Mar):
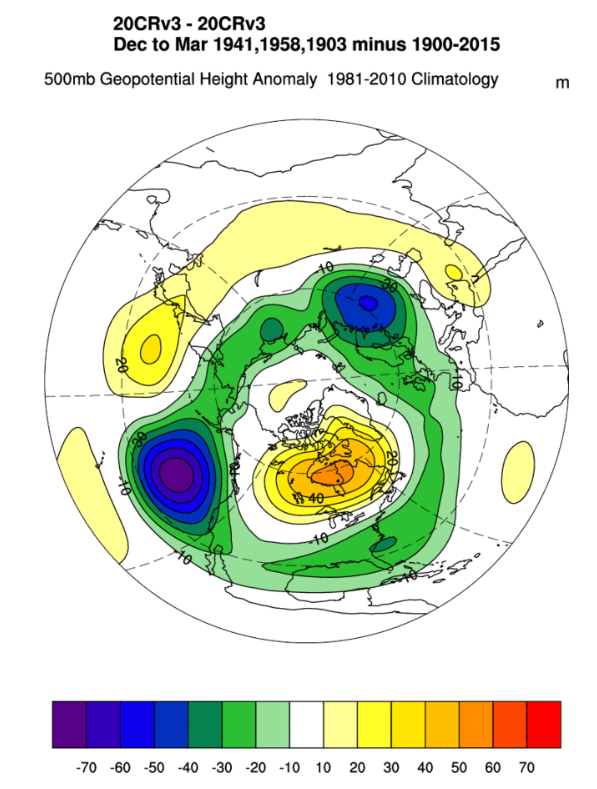
Top 3 -PDO winters during Strong El Ninos only (500mb for Dec-Mar):
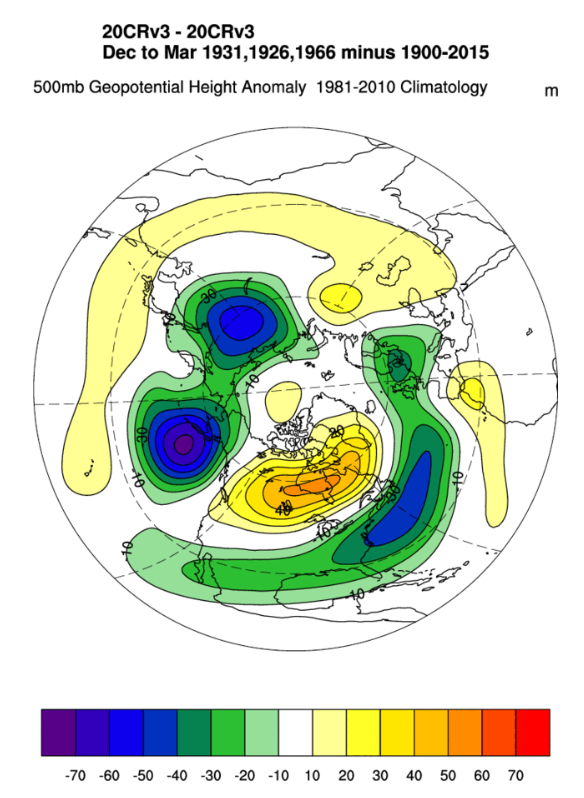
500mb pattern this year from Apr 10 to Oct 10:
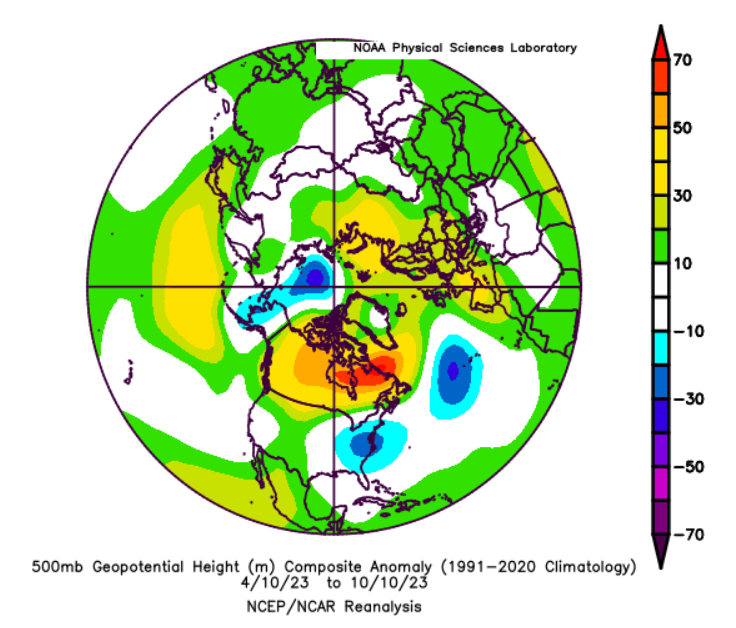
Key Points:
1. In my opinion, the combination of moderate and strong El Ninos forms a logical grouping when looking at past composites.
2. The fall season leading into the upcoming winter will feature one of the most negative PDOs on record for an El Nino
3. Regardless of PDO, the Mod/Str Nino composites feature elevated heights in Canada / Hudson Bay / Davis Straight with a split-flow regime and enhanced subtropical jet across the south
4. The +PDO Mod/Str Nino composite is warmer in December compared to the -PDO Mod/Str Nino composite
5. Reducing the composites to only Strong El Ninos maintains the general themes / ideas
6. The 500mb pattern from April to October this year shows elevated heights in Canada / Hudson Bay / Davis Straight. This could assist with carrying over to the winter pattern (atmospheric memory) which would fit with the Mod/Str Nino composite ideas.
-
8
-
6
-
-
13 minutes ago, brooklynwx99 said:
i mean, in terms of raw SSTs, this is indeed an EP Nino. those often become basin-wide sans years like 1997 and 1982. I prefer to use the term basin-wide to avoid confusion since we're not writing research papers here
regardless of raw SSTs, this Nino continues to not really behave like it should. not really sure how to feel about it, but it seems to be more optimistic than pessimistic given that a year like 2009 shares so many similarities
It will be hard to pinpoint below normal temperature anomalies for the full winter, anywhere really, given the magnitude of global warmth that we've been seeing...but I would expect to see wintry opportunities in the eastern 1/2 of U.S. at times, particularly in the Jan-Mar timeframe given that: 1) it is unlikely now that we see a super level Nino, and 2) indications are that the low frequency VP uplift isn't going to be well east. I think the times to watch for wintry weather in the east will be when the weakish MJO signal (VP pulses moving west to east) constructively interfere with the ongoing, low frequency, El Nino VP signal.
Here is a loop of SST Anomalies for October to March from the Oct release of the Copernicus C3S Model Ensemble
-
2
-
2
-
-
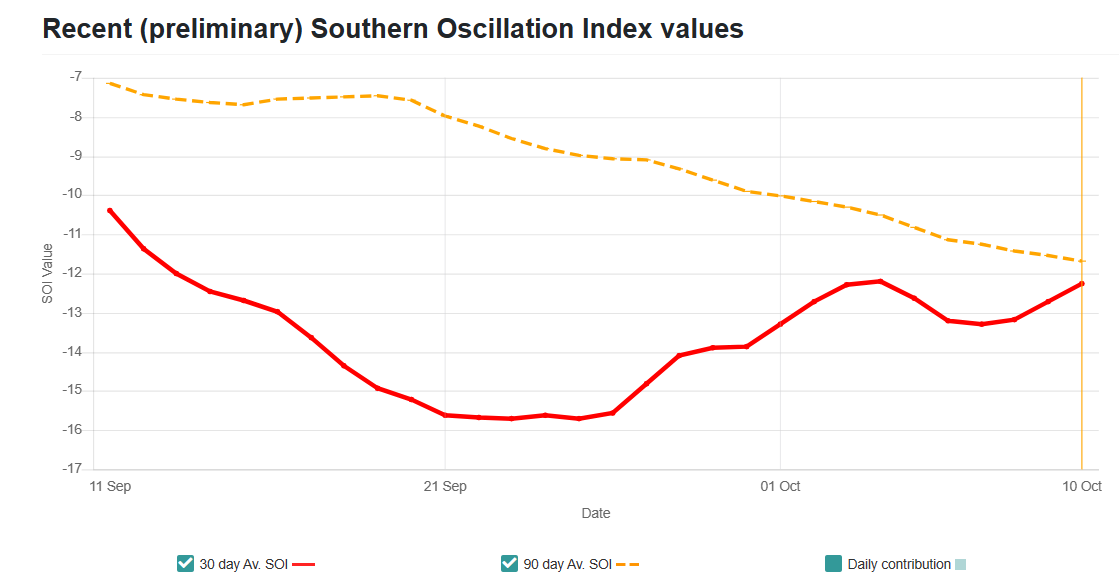
15 minutes ago, so_whats_happening said:
Latest TAO subsurface I shortened it as getting nearly 20 or more images in order was rough.
.thumb.gif.ece6ebf8faf1457a2649c6f61ba6caff.gif)
There's another weak downwelling kelvin wave moving east along 160-150W at the end of the loop. This has been the pattern all year...the El Nino keeps getting reinforced, albeit not strongly so, in spite of a lack of robust westerly wind bursts. The 90-day SOI is at its lowest point year to date at -11.68
-
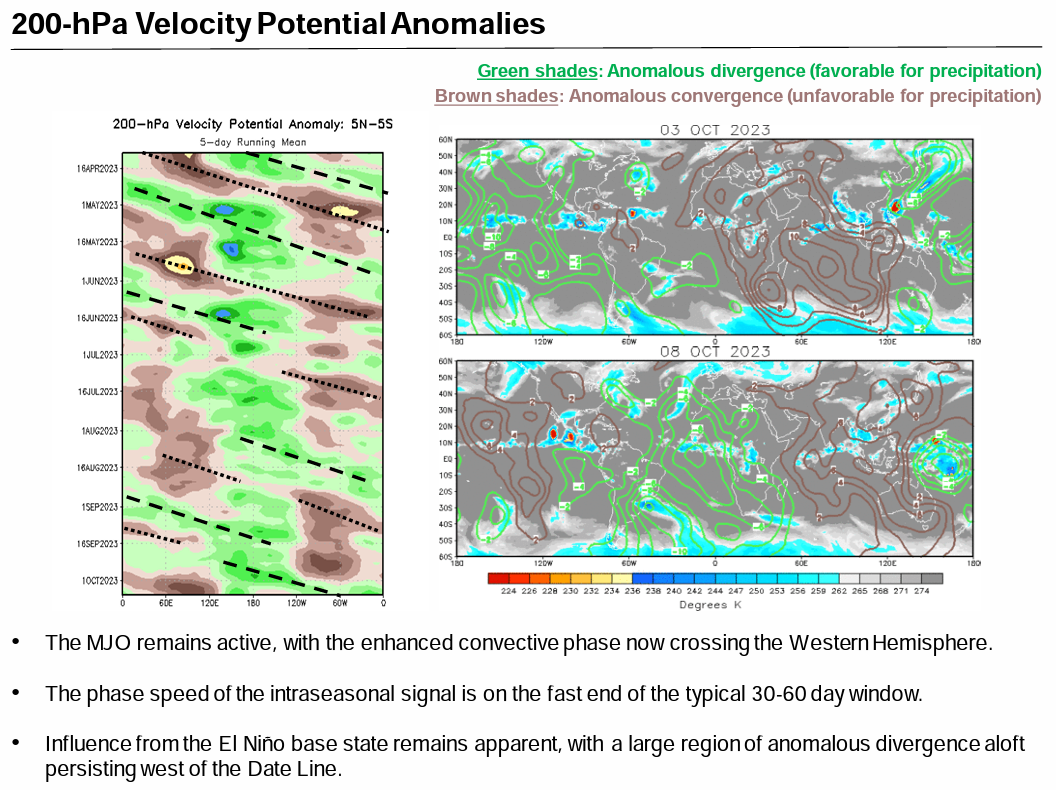
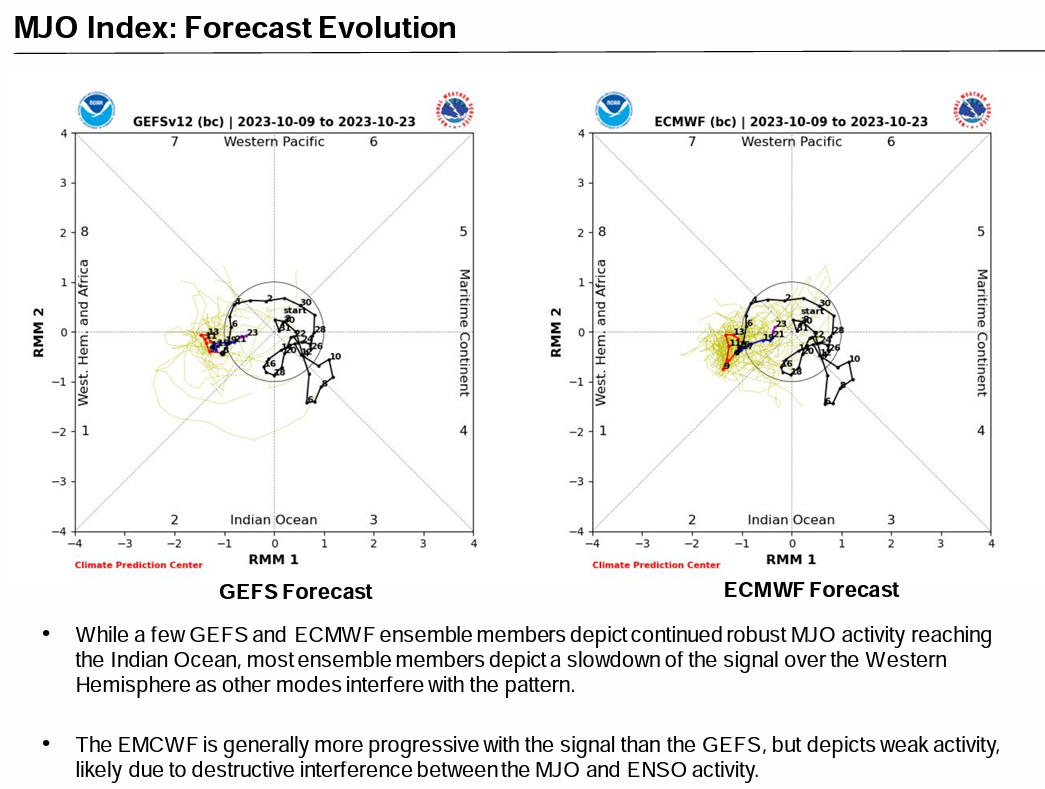
Thoughts from NOAA CPC's Weekly MJO Update on tropical forcing associated with the MJO and El Nino...


-
1
-
.gif.87e30aab0f8fe834f07dfe4495ce56d4.gif)
El Nino 2023-2024
in Weather Forecasting and Discussion
Posted
The Australian Bureau of Meteorology has a well-respected subsurface temperature product here. Can see the overall weakening over time, but El Nino in place