DarkSharkWX
-
Posts
695 -
Joined
-
Last visited
Content Type
Profiles
Blogs
Forums
American Weather
Media Demo
Store
Gallery
Everything posted by DarkSharkWX
-
50/50 low is weaker and less consolidated but the S/W is more amped this run
-
GEFS has stronger western ridging this run due to stronger trough in Pacific
-
Yeah we'll know in about 2-4 days when the 11th energy moves on shore. It will determine if we phase with the NS trough and then go on the 50/50 benchmark or not
-
yup CMC is gonna ride up coast and paste us
-
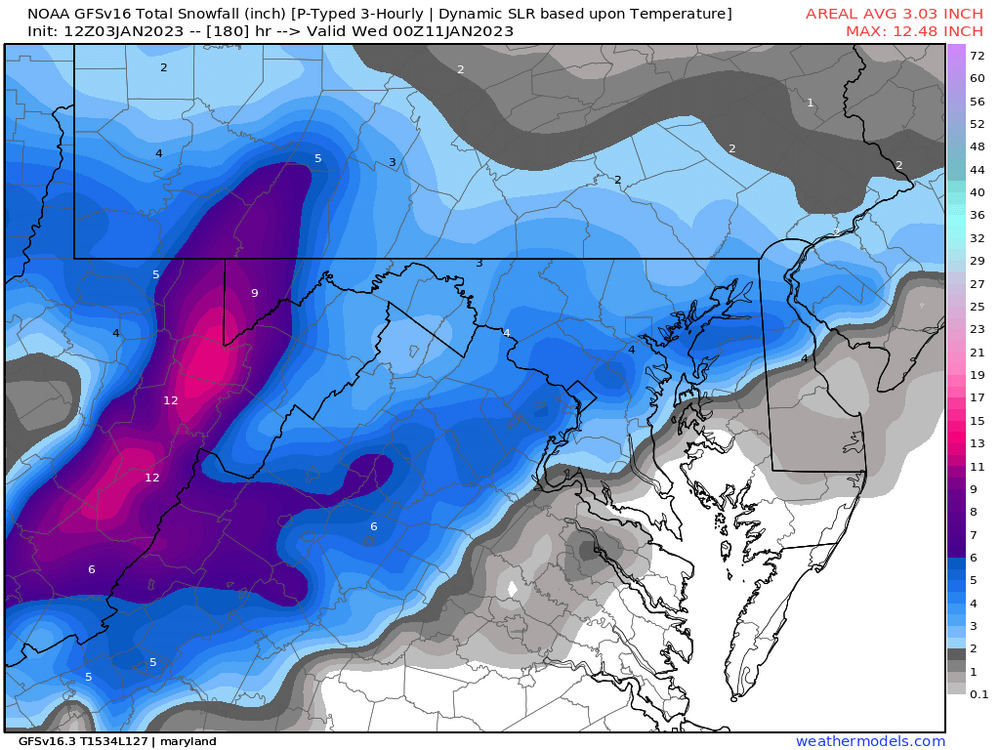
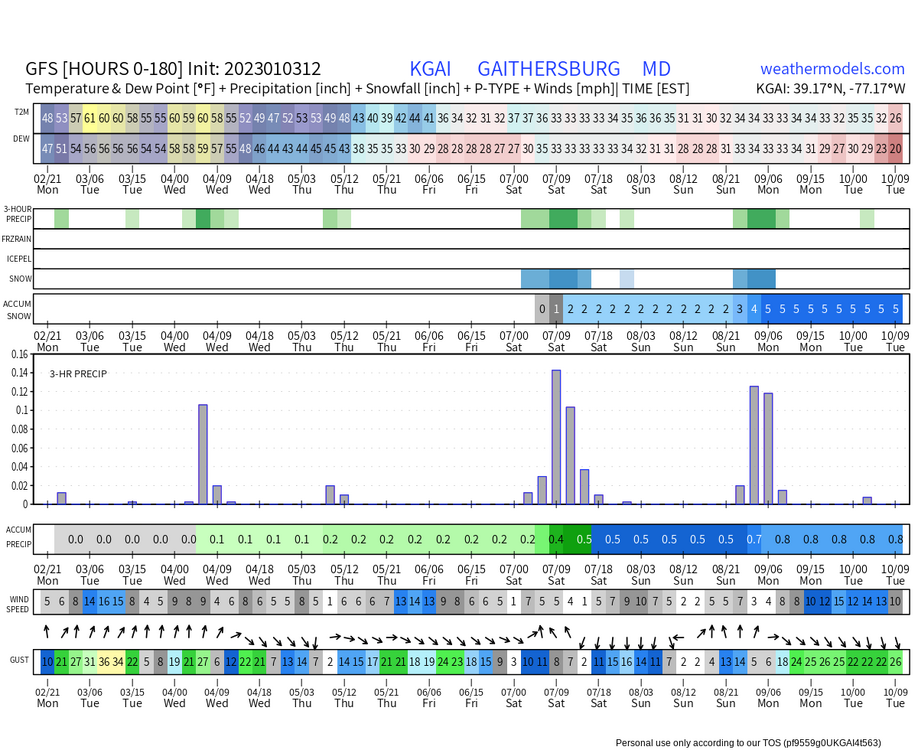
GFS/CMC have snow
-
Just did -
-
made a thread for the potential snow threat on jan 8th-9th
-
Not sure but the GFS op has been doing horribly so... And usually the ens follows op but the fact that it's holding out gives me a good feeling along with EPS/Euro which we know are better... We'll see tho
-
-
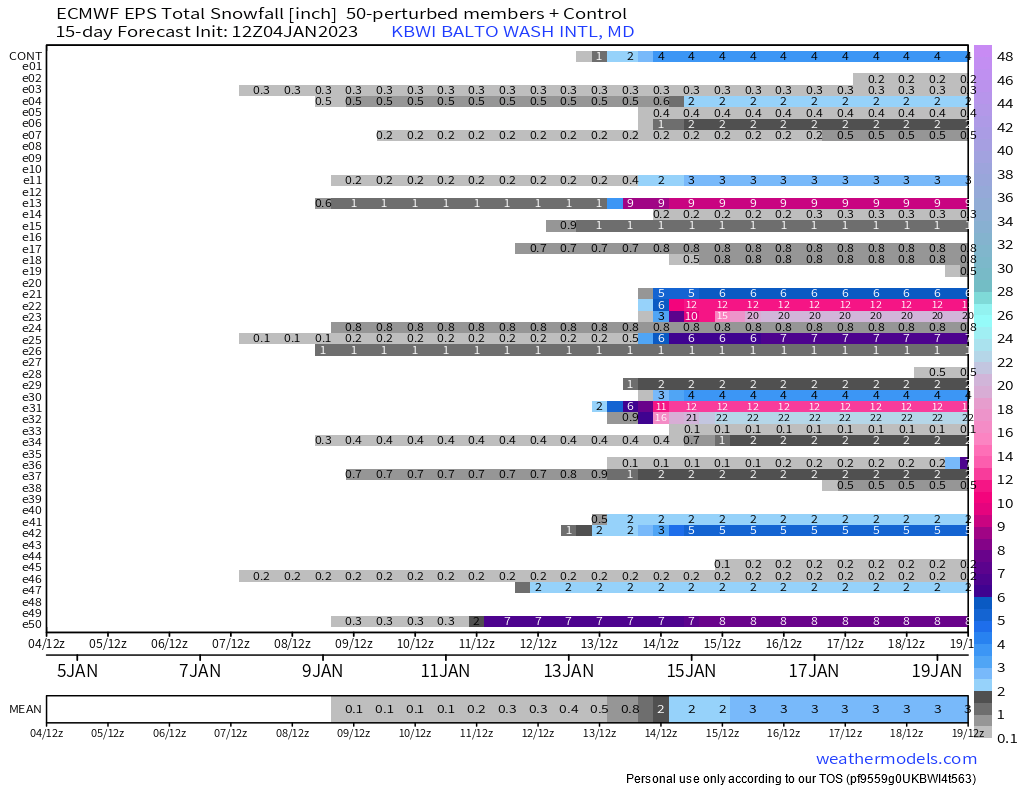
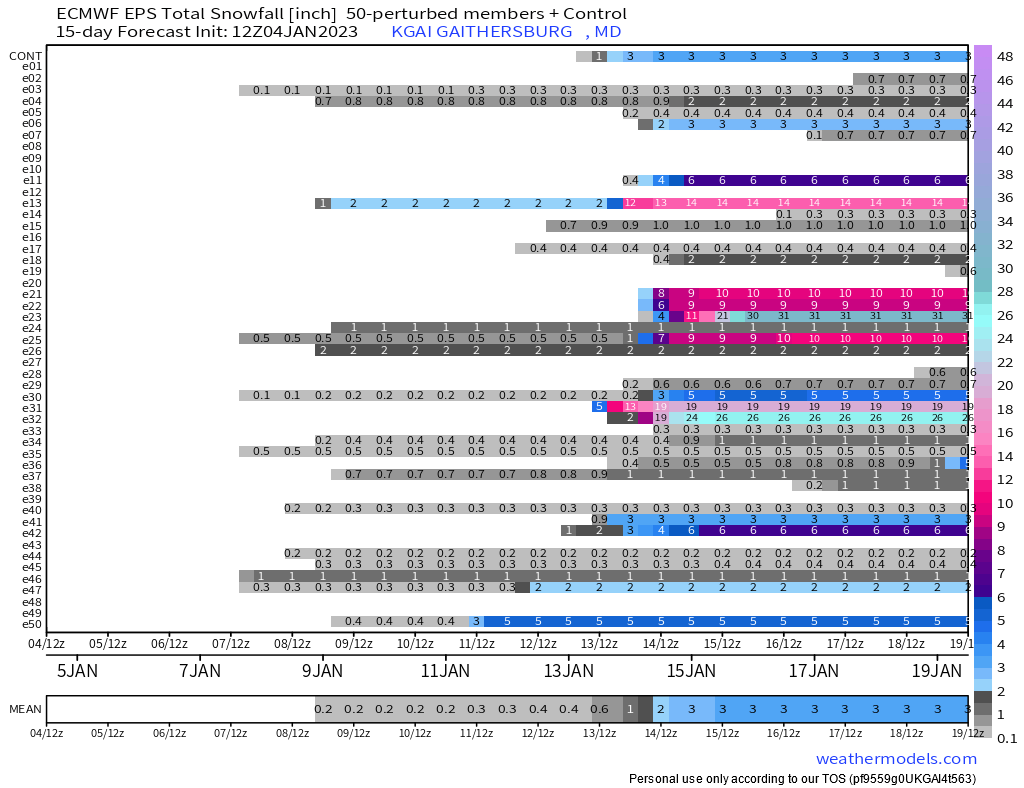
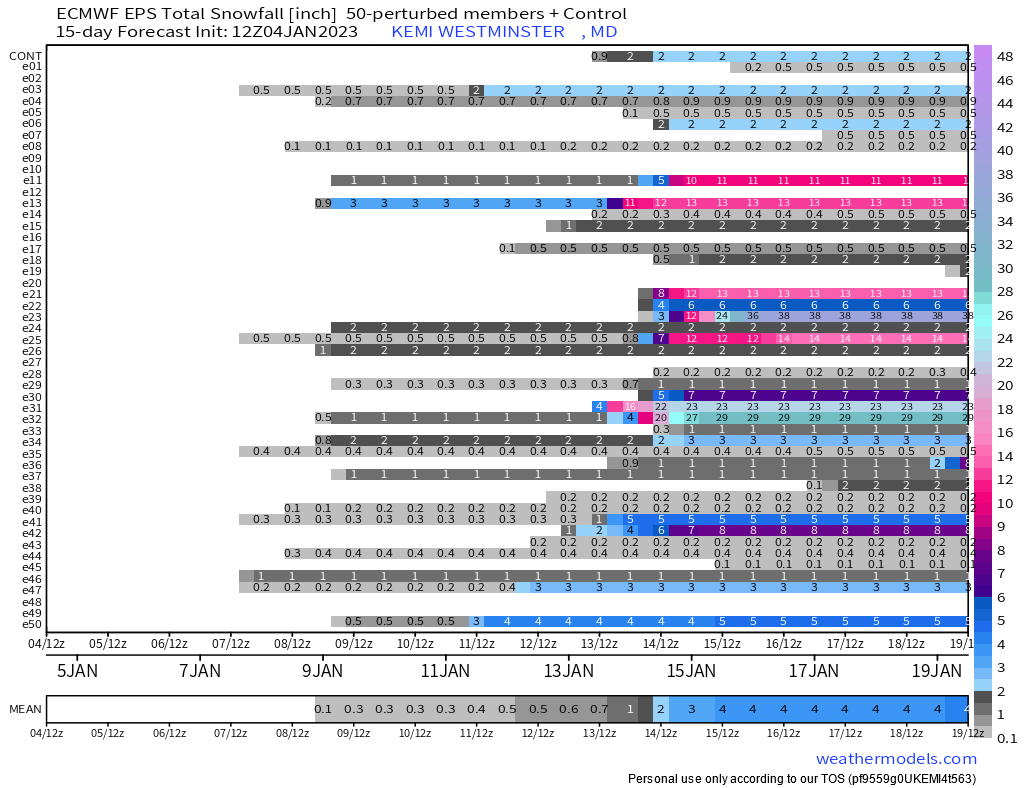
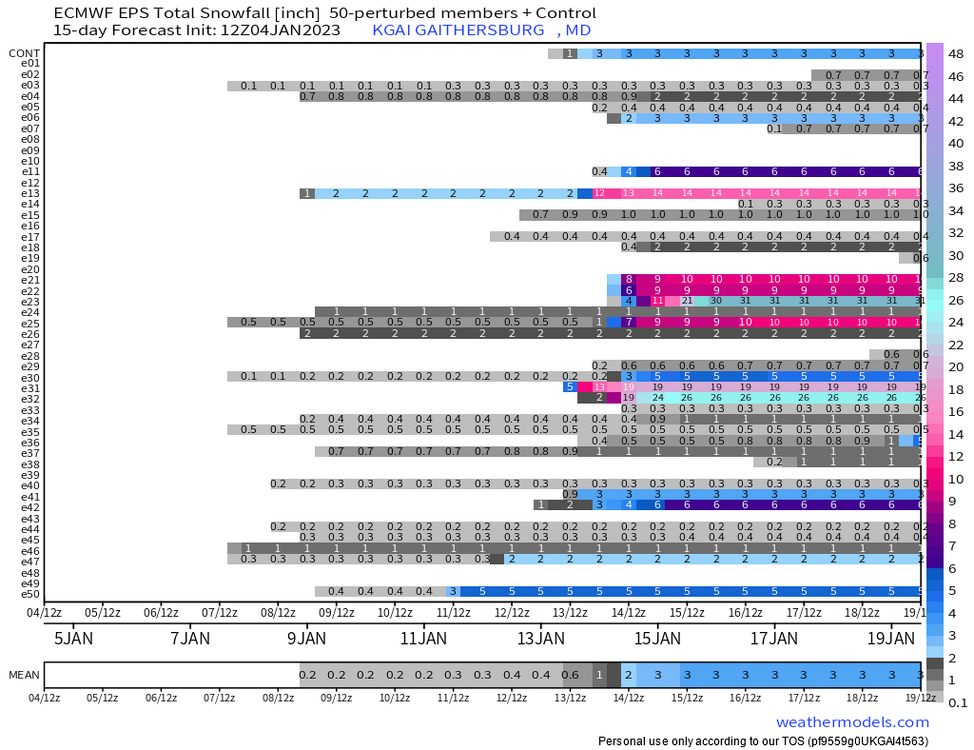
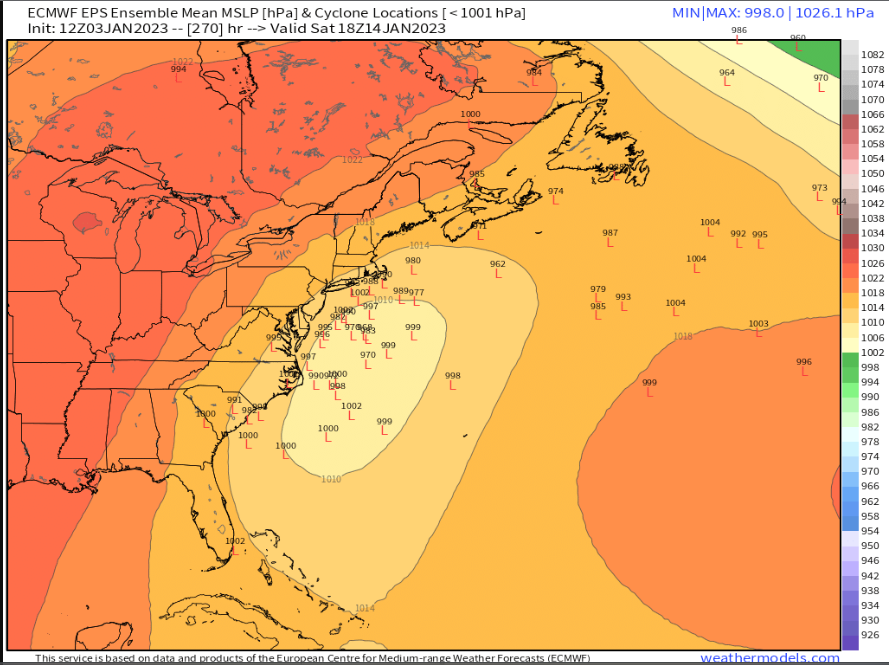
Wow, strong signal continues to stay on EPS with many members having a 50/50 low
-
Honestly good spot to be in rn. Def better than last run, and EPS will probably remain with a strong signal.
-
Here we go!
-
Def gonna be an interesting run
-
Some good hits on some of the individual members


-
Strong signal on EPS remains
-
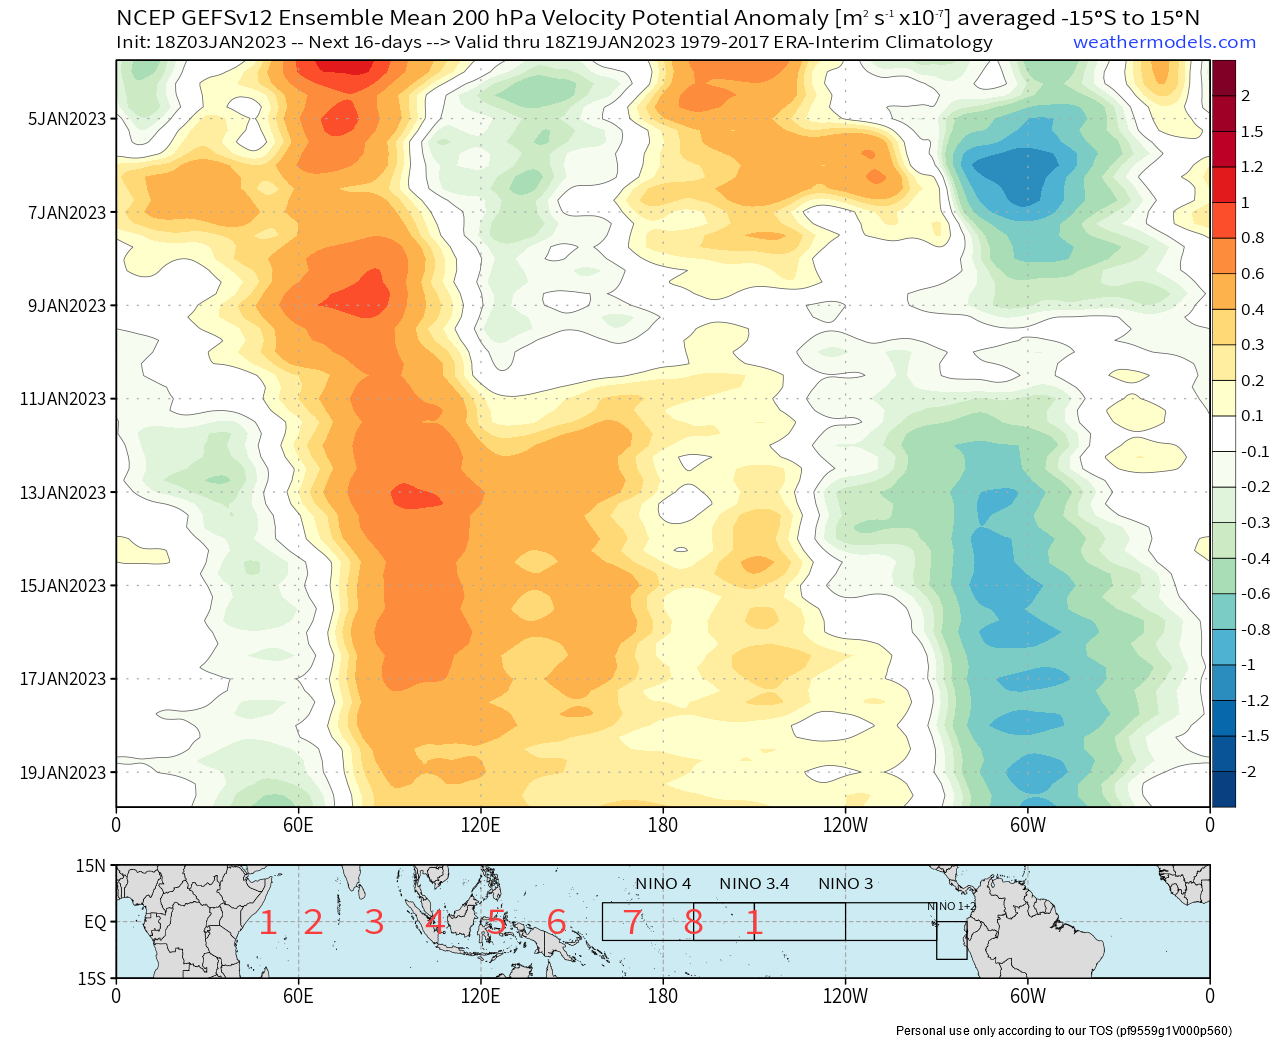
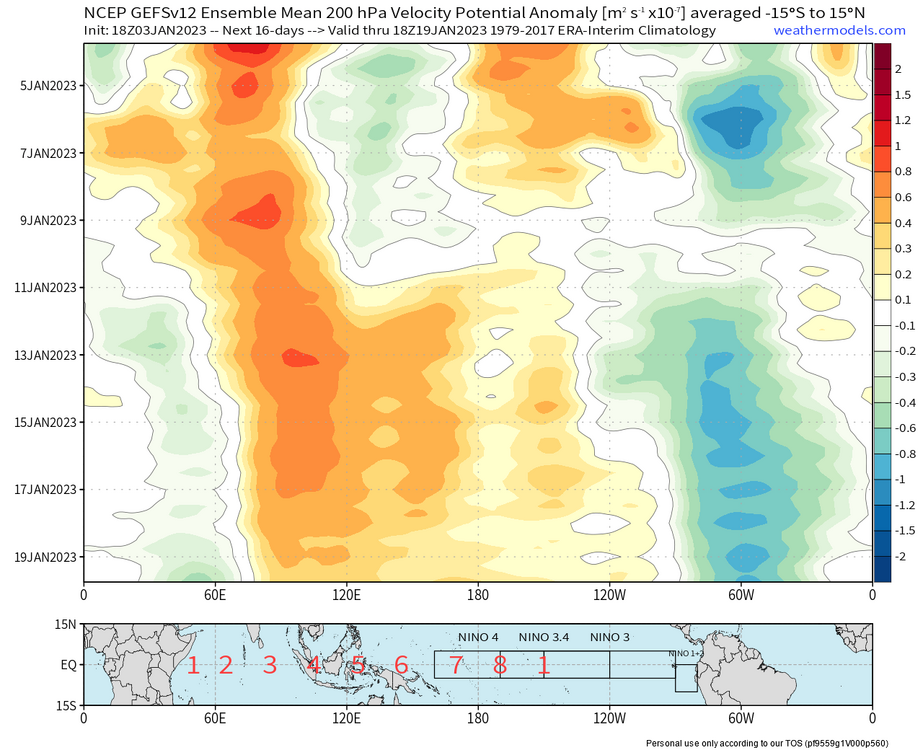
I'd gladly take my chances with this system. It has everything that we need for snowstorms in the MA, a strong banana Canadian high, a tall ridge over the Rockies that amplifies as the S/W moves through, and now a 50/50 low. As others have said earlier, MJO progression into favorable phases also supports this with convection in the IO shutting off and -VP anomalies over the Americas. Now we just have to watch and wait to see what happens. Gonna be an interesting week of tracking upcoming...
-
The overall pattern for 11th and 15th windows look good with east-based +PNA over central US building because of troughs in the Pacific and lots of Canadian ridging, which is also supported by NPJ being in a more favorable position(one worry is that guidance extends the jet again which would push it OTS though) and MJO progressing into phase 8. The main issue isn't the pattern but the airmass(cold air supply). Imo 15th event is best chance we've had so far this year based on upper-air pattern and the strong signal on the ensembles as well as the MJO supporting it. If we can get a strong banana high over Canada and the SLP takes a good track cold air wouldn't be as much of a worry.
-
yeah that would be classic for northeast/mid-atlantic looks like some members are gonna have it become a 50/50
-
Quite a strong signal for a coastal low on EPS considering it is more than 10 days out, imo best setup/chance we've had so far
-
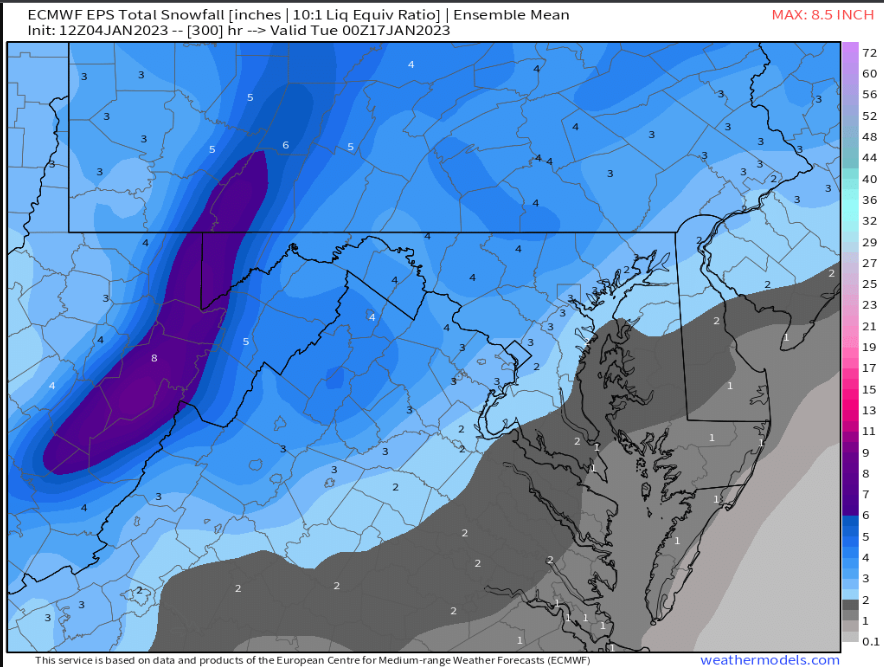
And here's your weenie maps
-
I'd much rather be tracking storms than long range patterns, finally something to track/look at lmao
-
https://twitter.com/mfdwx/status/1610273350563287040?t=JUjdaVpp4t8Ox1CNMR905w&s=19
-
yeah warmer SSTs mean more warm ocean influence but also more moisture. so that does mean whenever we do get a big storm, they are getting bigger in snowfall totals because of the increase moisture source(from GOM and atlantic ocean)
-
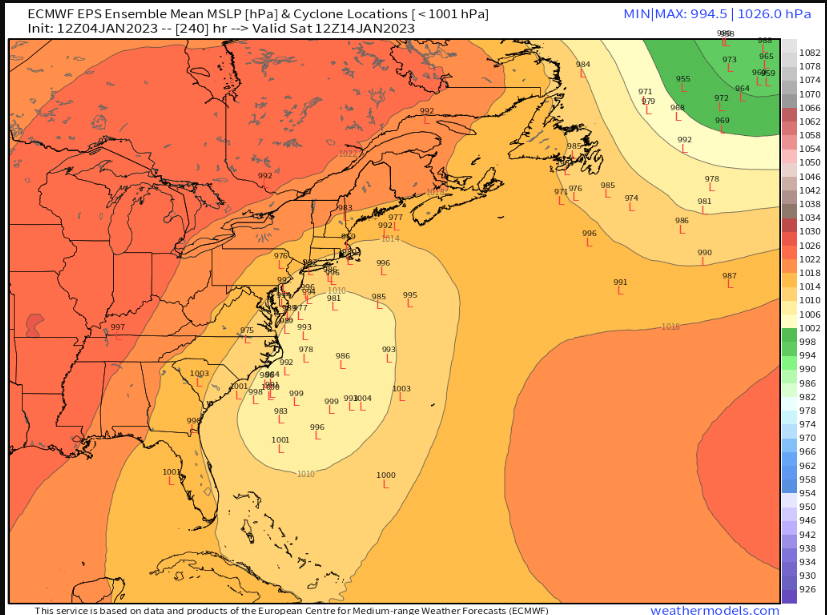
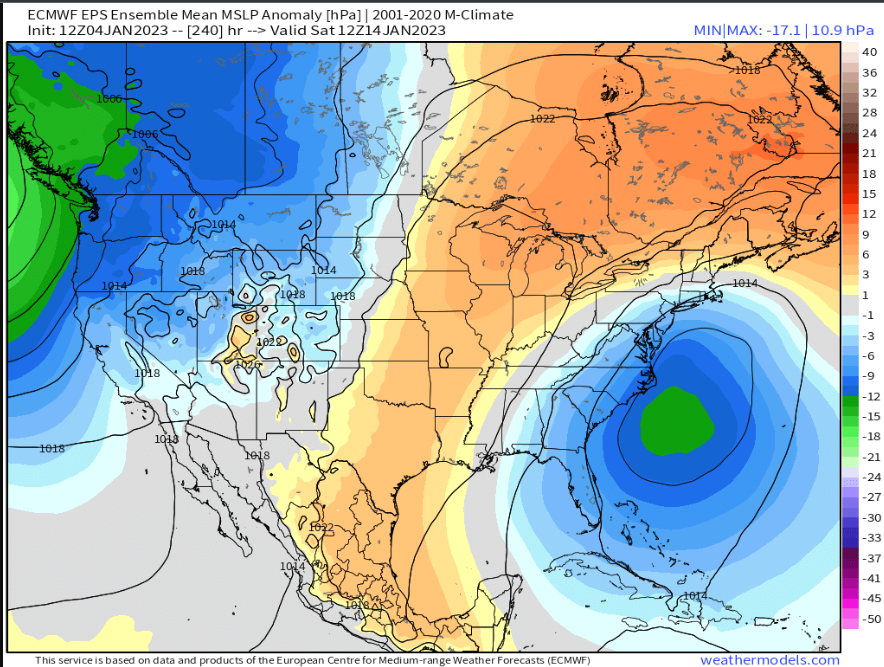
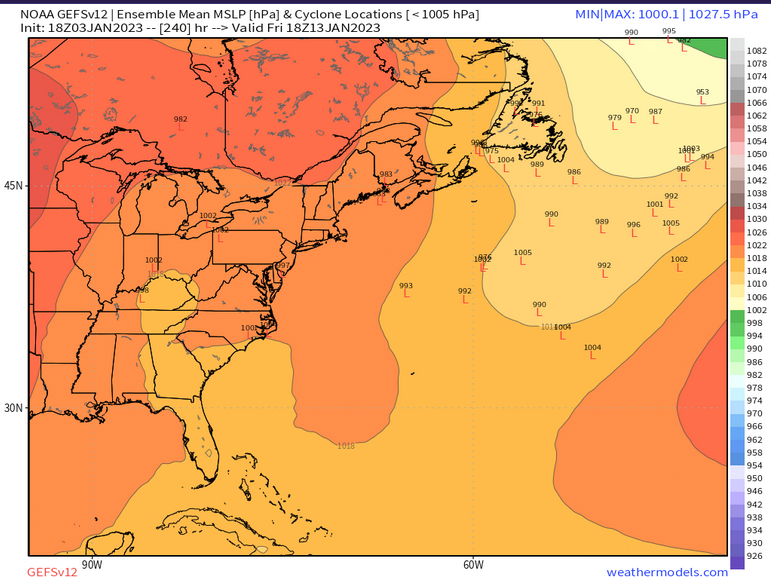
yeah would much rather it look suppressed/OTS now than having it hitting us right now, if we get the canadian high to trend stronger our cold air worries should lessen 500mb look is not bad at all, just the airmass thats the main worry atp, some members have a 50/50 low(on MSLP) but it doesnt show here also see some similarities with the Jan 2019(EPS attached below) with the energy sliding under the Canadian block, aleutian low and trough over GOA(obv this system is different, not implying this system will be like that storm or anything of that sort)
-
What year was your lowest?