

csnavywx
-
Posts
5,543 -
Joined
-
Last visited
Content Type
Profiles
Blogs
Forums
American Weather
Media Demo
Store
Gallery
Posts posted by csnavywx
-
-
Another insane autumn. Starting to see these open water areas stick around a lot longer into the fall now. It will be interesting to see how late the Chukchi stays open this year. That side has become a serious weak point for the pack during the summer melt as that region has transitioned well away from having any persistent ice cover.
-
After a meager +17k increase on Jaxa yesterday, 2018 has now claimed 2nd place behind only 2012 (+619k). That was fast.
-
1 hour ago, bluewave said:
Very close to record warm temperatures around the North Pole for the end of September.
http://sites.uci.edu/zlabe/arctic-temperatures/

Records are going to get steamrolled for the next week or so.
-
3 minutes ago, bdgwx said:
Last night's Euro run was +4.25 SD at 168 right over the pole.
We've seen some nutty height anomalies over the Arctic at times in the past few freezing seasons, but this takes the cake. It's like taking the entire North Pacific atmosphere/airmass and ramming it into the Arctic.
Seeing some hints of an extended chinook event off the Kuskowim-Alaska Ranges and later the Brooks Range too. Definitely going to throw an extended brake on re-freeze. Might even see some drops (as Friv alluded to earlier).
-
That EC run last night -- oof. +4SD ridge. Even the EPS is +3SD at a week out with widespread +10-15C anomalies across almost the entire basin. The FV3-GFS is much the same. OP deterministics are of course even more extreme. This would be a pretty hefty ridge by mid summer standards, much less late Sep/early Oct.
Yet another year with an extreme autumn setup.
-
 1
1
-
-
Full wipeout of the Beaufort is ongoing, per usual, along with all of the cycled MYI there. With the current clear conditions and forecast over the ESS, I doubt much of that ice survives past mid-August. It's already showing negative signs from just the past 2 days on Worldview. The big block will probably thin CAB ice as well, but there's some solid stuff left there, as mentioned earlier.
-
On 7/28/2018 at 12:59 AM, nzucker said:
Are we sure that isn't satellite error? It seems like an awfully big change from just a week or so ago, not sure if that's possible.
Worldview seems to corroborate the satellite data. Lots of soupy/ragged looking ice over there. Typically symptomatic of a reduction of floe size as it thins.
It looked relatively fine up until the 15th or so, but deteriorated quickly after that.
-
3 hours ago, FallsLake said:
Don't normally post here because much of the discussion is out of my knowledge level. But I do know that each week we pass (with cold, cool, average, or even not blazing temps) towards early September minimum is crucial. So just looking at the 6z GFS, it doesn't look that bad for surface temps. 850 temps do show pushes of much above normal temps but surface temps are at or just above freezing (more reasonable). So I think the big question is cloud cover; but again the farther into August we can get the lower the sun angel and the less affect of clear skies.
Don't be fooled by surface temps. They never deviate much from about 1C at this time of year. This is due to heat exchange between the ice and the overlying atmosphere. 850/925 temps and winds are important. Even if 850s were at 20C with the sun out at full blast, surface temps would not rise much due to heat absorption from the ice phase-changing to water.
It's the same principle as having ice in your drink. The temperature of the drink will not rise much until it is nearly all melted.
-
 1
1
-
-
SMB doesn't account for calving and discharge at the periphery, which is significant. Despite the cooler conditions, this surface melt season is still above the 1981-2010 average and with the oncoming melt in the next week or two, it will probably remain so for this season. The 2012 melt season was exceptional and doesn't (yet) represent the norm. When we get to the point where SMB can't crack positive (as it almost did that year), it'll represent the non-viability of the ice sheet in the long term and a permanent shift to widespread net ablation. I suspect that will happen consistently when we lose sea ice in the late summer.
-
Bluewave,
You posted this paper earlier and the post is gone:
https://www.nature.com/articles/ncomms14375
I meant to comment on it earlier but ran out of time that day.
It's definitely an interesting and concerning paper. I've read it a couple of times before. I'm not sure that's what's going on here, as it seems that most of the cooling was from diabatic heat loss, but the mechanisms mentioned in the paper are definitely a concern down the road. It looks like most of the ones that predict deep ocean convection collapse in the SPG target right around mid-century. The SPG collapse happens almost regardless of emissions path too (happens in 2.6 and 8.5). The fact that only the higher skill models do it and it happens regardless of emissions scenario does set off an alarm bell that they might be on to something. The authors obviously thought so as well.
It's interesting that the earlier paper you linked (from 2012) showed some SPG instability that the authors dismissed as a 'freak occurrence'. Perhaps not?
-
11 hours ago, bluewave said:
Just beginning to see the area loss rate slow. Looks very close to 2013 as of the most recent update. The CPOM September average extent forecast based on melt ponding was near 2013. The longer this reverse dipole persists, the more confidence there will be for a NSIDC September average extent at or a little above 5 million sq km.
The flip side to this is the fact that the record +AO still isn't enough to get a recovery to pre-2007 levels -- only enough to mostly cover for the higher winter temps. You may be right that when we look back, 2007 may have been the most important point in the entire sequence. I'm sure we'll get to some point where extent drops out rapidly towards zero in late Aug in the future, but the biggest change was probably the Beaufort gyre turning from a nursery for ice to a MYI graveyard. That change looks irreversible at this point.
-
3 hours ago, ORH_wxman said:
We've been speculating on here for some time...but I can't help but think the big change in SSTA pattern in the North Atlantic south of Greenland starting in late spring of 2013 is definitely linked to the different summers we've been seeing since then. Seems like too much of a coincidence...I'm not sure how much is chicken/egg....but we do know that feedback loops will develop with persistent SSTA patterns...so if there's isnt' a very large atmospheric force to overcome the status quo, then we keep seeing a reversion back to the +NAO/+AO type pattern. I thought this year might be a little different because we saw some impressive blocking up there in March and then into spring time we saw more bouts of good blocking. We hadn't seen any sustained blocking in the cold season like we saw in March since winter of '12-'13....so it was definitely a change. But it flipped a switch again once we got near June.
But that negative SSTA in the N ATL has been pretty persistent for 5 years now...maybe some brief interludes in 2016 I recall and late last summer. I remember back during the big dipole years of 2010-2012, it was bright red up in that region.
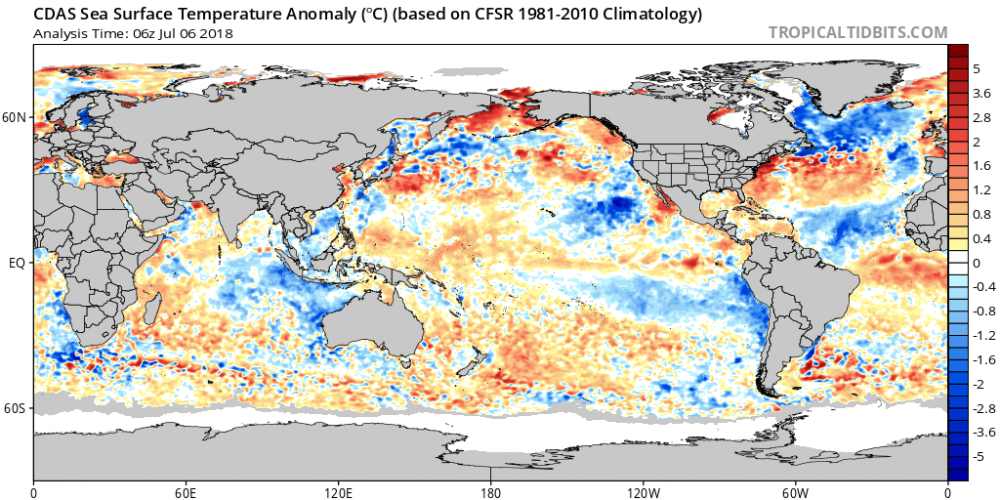
After digging further, it looks like 2013's SST pattern had more in common with 2009 (i.e. cooler interludes in an otherwise warm phase). The real shift appears to have taken place over the following winter:
https://link.springer.com/article/10.1007%2Fs00382-015-2819-3
http://iopscience.iop.org/article/10.1088/1748-9326/11/7/074004
Leads to this paper (both previous papers cited in this one):
https://www.nature.com/articles/s41598-017-11046-x
The particularly interesting part of that last paper (from 2017) is how deep the strong OHC anomalies extend (down past 1000m). As the paper mentions, it's going to take a lot to erase that:
QuoteThe forecast suggests that the cold anomaly will likely persist over the next 2 years with a probability of 0.8. The persistence of subpolar OHC anomalies, and the dominance of subpolar OHC anomalies on the AMO (Fig.
4a) is consistent with the expectation that OHC, rather than SST, carries the memory of the ocean. In the subpolar region, we further expect that subpolar anomalies are generated by irreversible (diabatic) processes and that once formed, take several years for the anomaly to advect or mix away.
-
Also of interest -- the CANSIPS, which showed a slow melt season (via MSLP anomalies) many months ago is showing the same pattern next season already -- with a strong -AO pattern in spring transitioning into another strong +AO summer. It has cold SPG/NATL temps staying in place as it did this year.
-
1
-
-
The EPS and GEFS out to 10 days show some hefty cold anomalies as well and a pole-centered TPV. This year could certainly make a run at 2013 or even 2009 at this point.
-
1
-
-
13 hours ago, ORH_wxman said:
Sea ice area is the highest value at the end of June since 2013. I'll have my prediction later for final extent and area once I crunch the numbers more...along with the histogram of possible area outcomes based on historical losses for each year since 1979.
But as a prelim post, the chances of an area record low are basically zero and top 3 lowest is close to that. We just didn't get enough early melt ponding.
EOSDIS Worldview supports this. The pack looks visually much closer to 2009/2013. There's more ponding than those two years, but less than every other year back to '07. With the upcoming TPV pattern setting in again, this year has a good shot of ending up around 5M, despite the low starting volume.
The HADGEM1 paper linked earlier is pretty interesting. They state that they think the SPG weakening is a freak occurrence in the model, but the higher skill-score models tend towards SPG convection collapse a lot more than the CMIP5 median. The result is a stronger version of what we're seeing now, which is a very strong cold SST anomaly south of Greenland. This year has been especially impressive, with -2 to -4C anomalies over the entire SPG region and surrounding areas. Interestingly, the CESM4 shows this stall in temperature in the summer through the late 2020s as well, followed by a relatively rapid increase thereafter.
In addition to some of the mechanisms listed in the paper(s) above., I think some of this is also related to increases in snow depth in the surrounding land areas, especially on the Siberian side. These past few much warmer winters have resulted in unusual amounts of snowfall, which have helped retard early season melt-out and peripheral ponding.
This is all fairly temporary of course. As long as external forcing continues to increase at the current rate (3-4ppm CO2e/yr), it will eventually overwhelm these other factors and cause the pack to collapse regardless. Still on target for the 2030s, imo, even with a stall through the 2020s.
-
1
-
-
Strong -AD at the moment with colder temps towards the CAA/Beaufort and blowtorch conditions on the Russian half of the basin. Ponding is getting widespread over there on the latest worldview imagery showing strong melting penetrating pretty deep into the snow-covered areas of the basin.
Dprog/dt is characteristically high for this time of the year, but a strong rex block near/over the CAA appears likely to develop soon in conjunction with the Laptev block. Depending on placement, there may or may not be some penetration of strong melt conditions into the heart of the central basin in the next week. The upside is the lack of strong export and relatively cold conditions for the Beaufort and Chukchi (which need a break given the extremely weak ice front in the Chukchi atm).
-
PDO is neutral this year and may go slightly negative, so I don't think that's going to be as big of an influence. That Atlantic SST pattern is really something else and points towards what bluewave is talking about. Although, that SST pattern is also favorable for periodic rex blocking over or just east of Greenland (towards Iceland) and an enhanced storm track south of Greenland overall (which we may incidentally see some of in the coming week). That also favors keeping troughing near the Kara/Barents area.
While this doesn't translate into a 2007/2012 or a mega-dipole type pattern it is warmer than the past few years, contingent on how the Pacific behaves. We'll have to see what kind of ponding the upcoming event on the Pacific side will generate as we're entering the critical period for that area.
-
Yes, a winter like the last two plus a 2012 or 2007-style melt season would get us pretty close to ice-free conditions by the end of Aug.
Need a jump start to the melt season to get it going and we just might get that this year given the forecast over the next two weeks.
-
This May is shaping up to be much different than anything in the in the last several years. Going to get some early snowmelt and melt pond formation if the D4-10 EPS and GEFS and wk. 1-2 CFS are right. Last year, snowmelt didn't start in earnest in the CAB until early July, which left that sector pretty well protected.
-
KNHK at 33, Leonardtown at 32. Your thermometer might be a tad high, considering KNHK's sensor is very close to the water.
-
1
-
-
CC on radar shows pretty steady progress of the snow/sleet line. Should clear the western shores here in the next 60-90 minutes and progress across the bay. Some shallow convection showing up in echo tops already.
-
3
-
-
Are you getting accretion from that freezing drizzle in Easton? I've noticed the obs have fallen to freezing with some wind there.
-
1
-
-
To be fair, there's still some uncertainty there (and thus bust potential). It's a fragile setup, though it's getting harder to ignore the chorus of a low tucked in 50mi e of WAL and decent convectively-enhanced banding tomorrow. Only additional problem I see on further analysis is the potential for a later changeover closer to the eastern shore. That warm nose will be resilient for a while until heights crash and lift can act robustly on that layer.
-
2
-
-
After further review of this morning's satellite, radar and guidance, it's time to bump those totals way up. I'll re-post here in a few, but 6+ looks to be on the table for SoMD and the Ern Shore for sure. There were some hints yesterday about the possibility of the track trending closer and a clean transfer. That seems to be the preferred outcome this morning. In particular, there's now agreement that the H5 and H7 lows will develop just southwest and track just south of the area, with southeasterly and easterly winds at those levels, unlike yesterday, which showed messy and weak flow at that level.
-
4
-

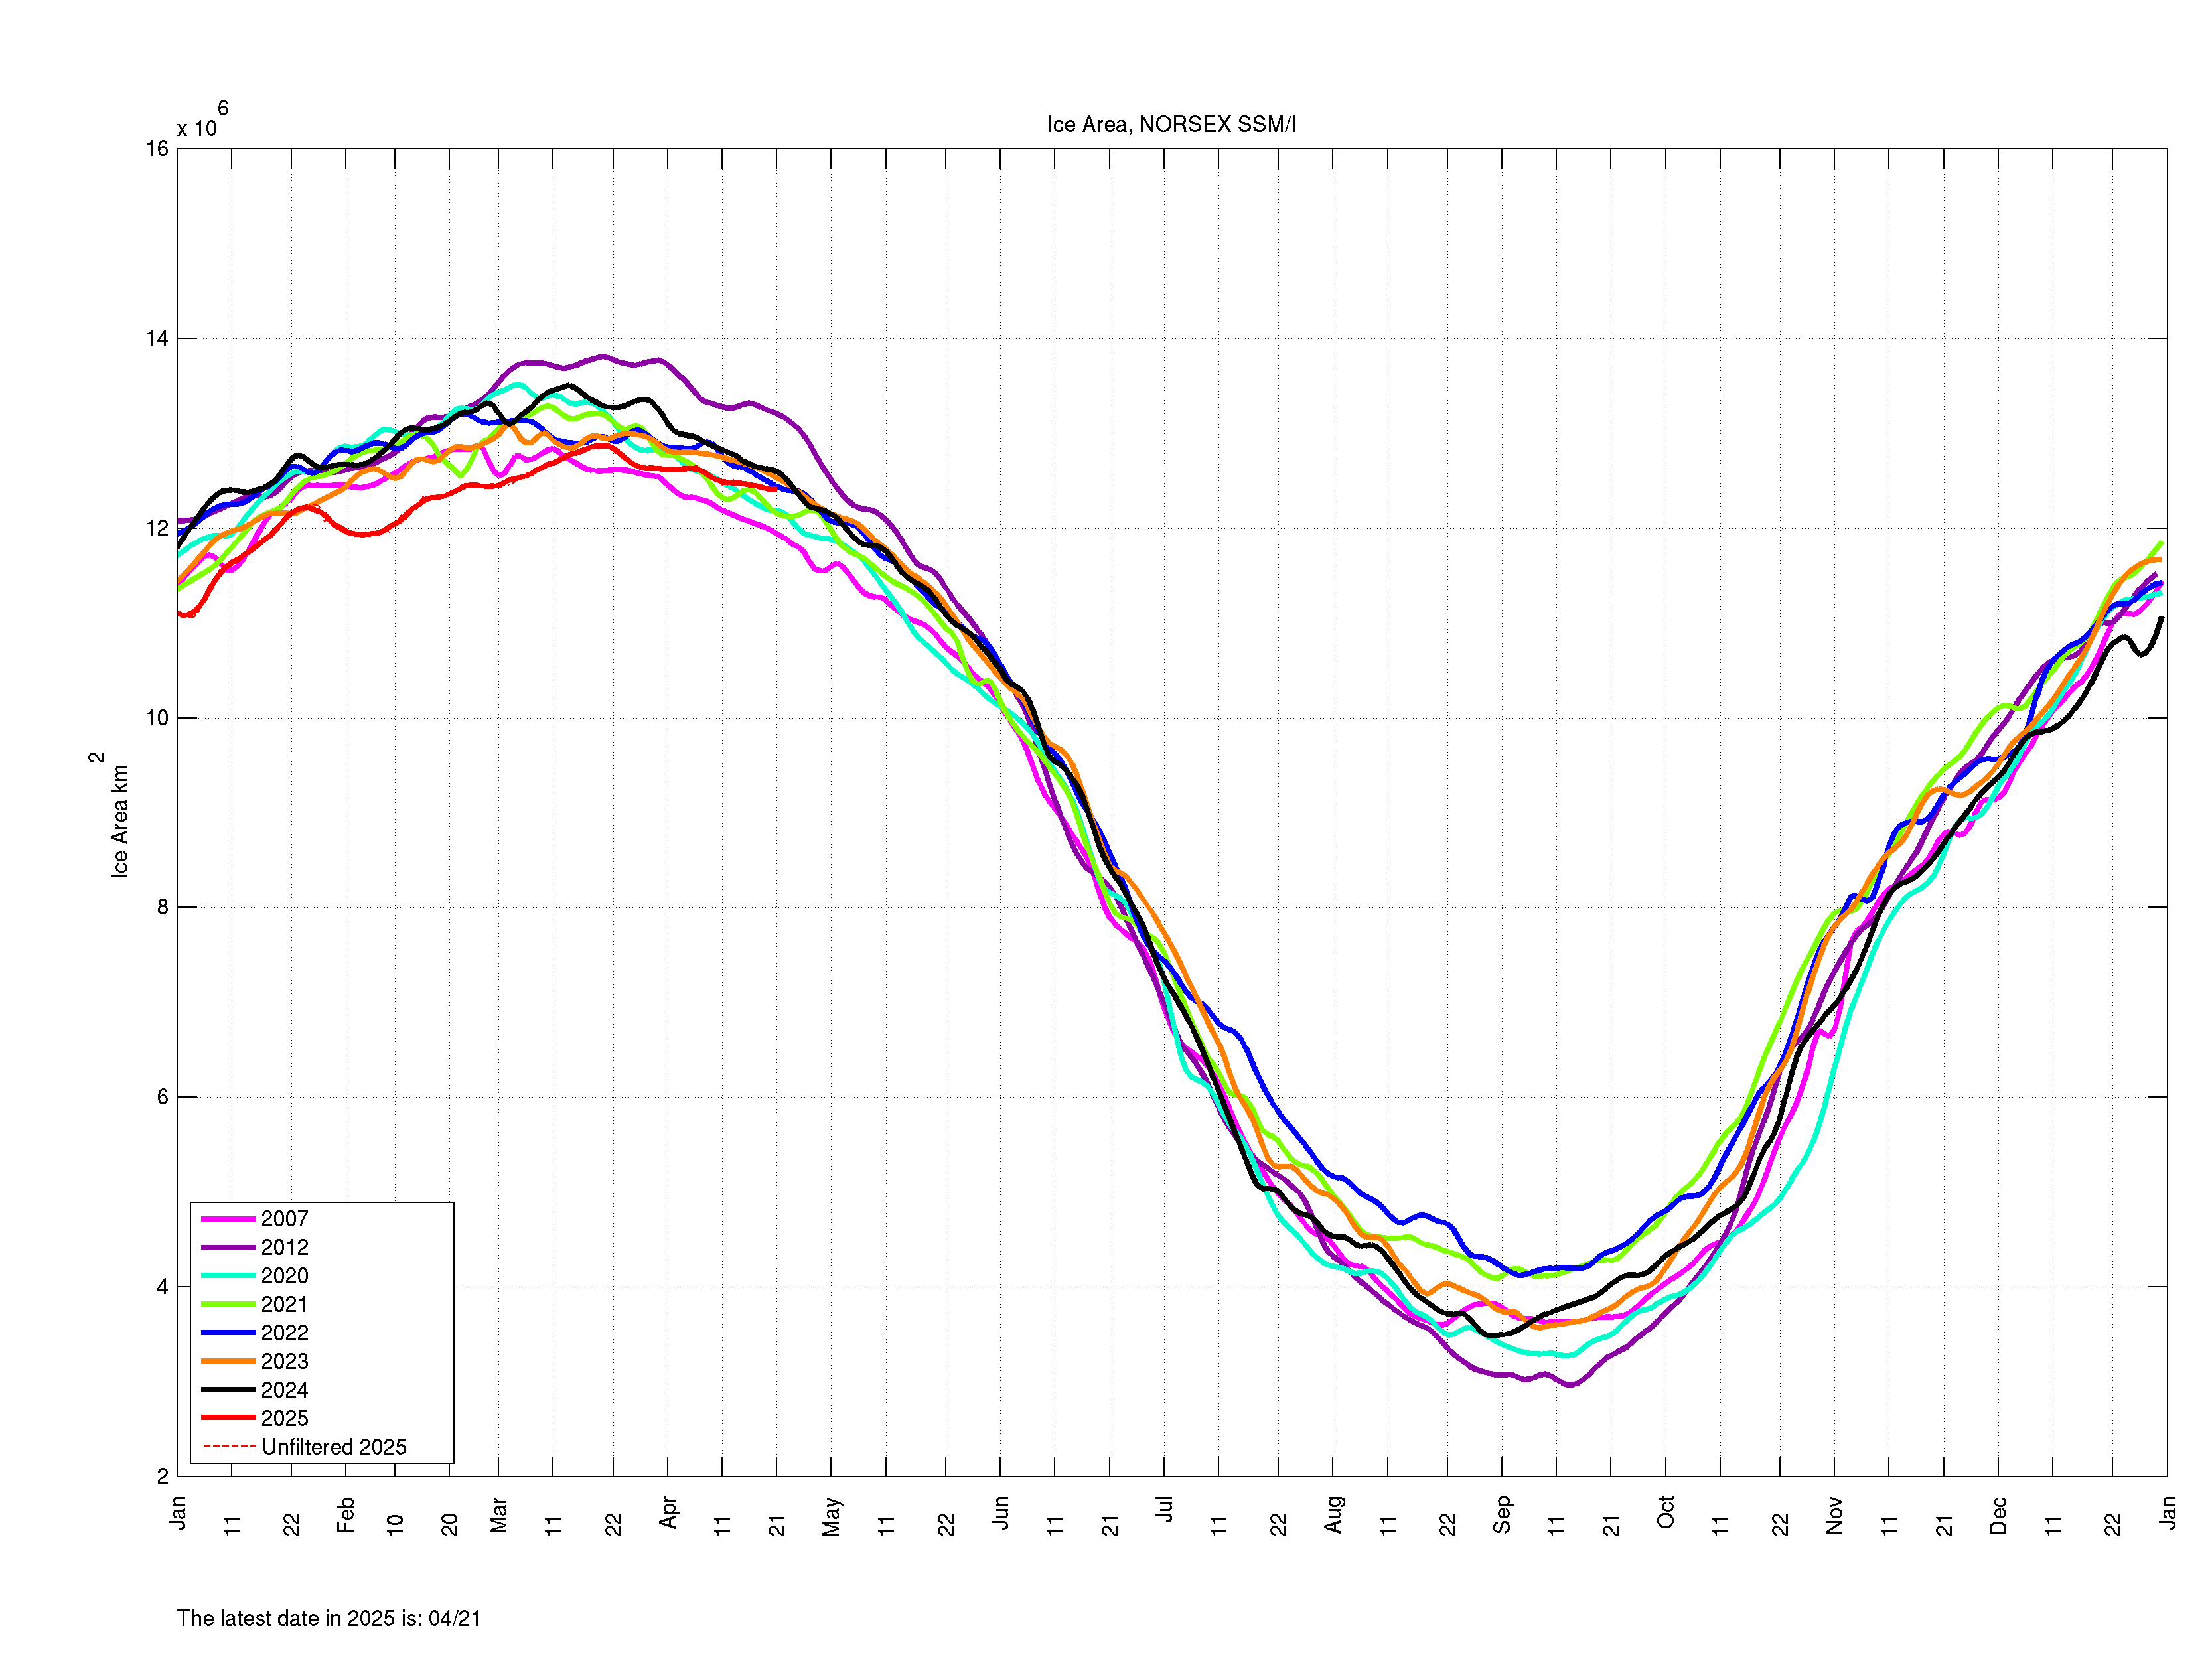
Arctic Sea Ice Extent, Area, and Volume
in Climate Change
Posted
The Antarctic season has been remarkably bad and is now dead last in both extent and by a large margin in area. It's also in considerably worse shape (concentration wise) than even 2016.