ORH_wxman
-
Posts
93,092 -
Joined
-
Last visited
Content Type
Profiles
Blogs
Forums
American Weather
Media Demo
Store
Gallery
Everything posted by ORH_wxman
-
It will be interesting to see if this product stays below 2012....I suspect it will not, but we'll find out in about 2-3 weeks. NSIDC area is now favored to finish 3rd lowest...we're only 90k lower than 2016 now and 2016 loses about 400k in the next week. So this year needs to kick-start again on area loss to stay pace. Extent is still favored to finish 2nd lowest behind 2012 on NSIDC, Ubremen, and Jaxa.
-
2019 ENSO
ORH_wxman replied to AfewUniversesBelowNormal's topic in Weather Forecasting and Discussion
Yep...there was plenty cold over the CONUS, just not for most of the posters in here....pretty classic gradient with SE ridge in the east actually.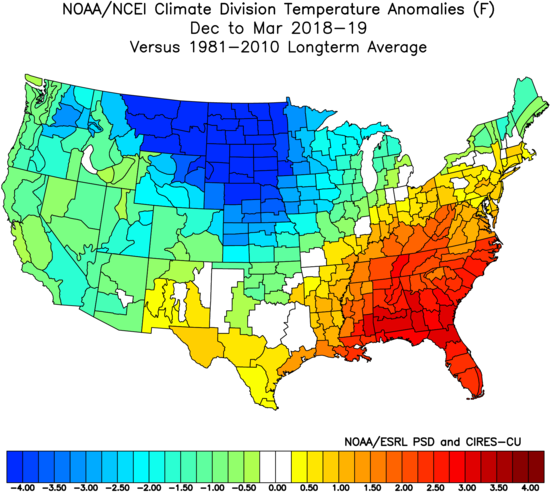
-
Well, it sounds like a subjective analysis then by you on other people's posting behavior. Not sure I can really help other than the below explanation: If you go back through the beginning of this thread and previous Arctic sea ice threads, you'll note that IMS hasn't been used. It's been consistently NSIDC and JAXA...sometimes U bremen and previously Cryosphere Today (now defunct..but they used NSIDC data). I don't know a ton about IMS but my little experience with it from sheer recollection back to the 2009-2013 days is that it seems to lag the other datasets significantly. It will "catch up" to them eventually if it looks like it is deviating on a trend line. That is my guess on what happens this year as well. We won't have to wait long to find out.
-
Here's some sources....the record we discuss isn't supposed to be about what it means longer term. Most of us know the longer term trend is down. But records are interesting to all of us in the weather community. Why do we sit around and track the thermometer at 101F on a hot summer day when the record is 102F? Does it really feel much different from 99F? Of course not, we're just tracking whether the record gets broken or not. FWIW, we've discussed when we think the first total melt out (definition below 1 million sq km of extent) will be in here: https://www.americanwx.com/bb/topic/40881-when-we-will-see-an-ice-free-arctic/ https://www.americanwx.com/bb/topic/46677-when-will-the-2012-arctic-ice-extent-minimum-record-be-broken/?page=3 It does not appear we will set a new record this year based on JAXA, ubremen, and NSIDC. We'll see about the IMS plot you reference but is suspect that will flatten out at some point. https://docs.google.com/viewer?a=v&pid=sites&srcid=ZGVmYXVsdGRvbWFpbnxhcmN0aXNjaGVwaW5ndWlufGd4OjU1OGIwZWI0NGI2ZDI5YTM https://seaice.uni-bremen.de/sea-ice-concentration/ https://ads.nipr.ac.jp/vishop.ver1/vishop-extent.html
-
Area and extent loss have slowed to a crawl the last couple days. We're now behind 2012 by about 300k on extent and 200k on area.
-
That tool on NSIDC uses the 5 day running mean instead of daily values.
-
IMS is a deferent source than JAXA or NSIDC and it looks like that graph doesn't have any data beyond late July.
-
2016 looks like it had a lot more easy pickings after 8/10 for losses than this year. If parry stait melts out then that could add some to 2019 but 2016 looked easier:

-
Why do we think 2019 will act more like 2016 than 2012 after August 10th?
-
We've fallen 350k behind 2012 on area despite extent still being very close. We're probably going to need a big compaction pattern to keep extent in the running through the end of this month.
-
2012 has expanded it's area lead to 210k....the best chance for 2019 is if the Laptev can retreat further than 2012. That's the weak spot when comparing year over year.
-
Extent definitely has a better chance to beating 2012 than area. We're 170K behind in area now and 2012 doesn't slow down any time soon. We'll need some breathtaking losses to keep pace. If we have enough compression of the pack though, extent could still challenge even if area does not.
-
On extent or area? I think 2007 both extent and area are very good chances to be surpassed by 2019...2016 has a good chance on extent but not as good for area. Prob like a 50/50 chance or less to pass 2016 area.
-
I agree with the low chance of beating 2012 at this point. I wanted to see a pretty good sized lead heading into late July/early August. I might go higher than 3% on extent but not by a lot. Maybe 10-20%. For area I probably wouldn't go higher though as we slightly trail 2012 in area.
-
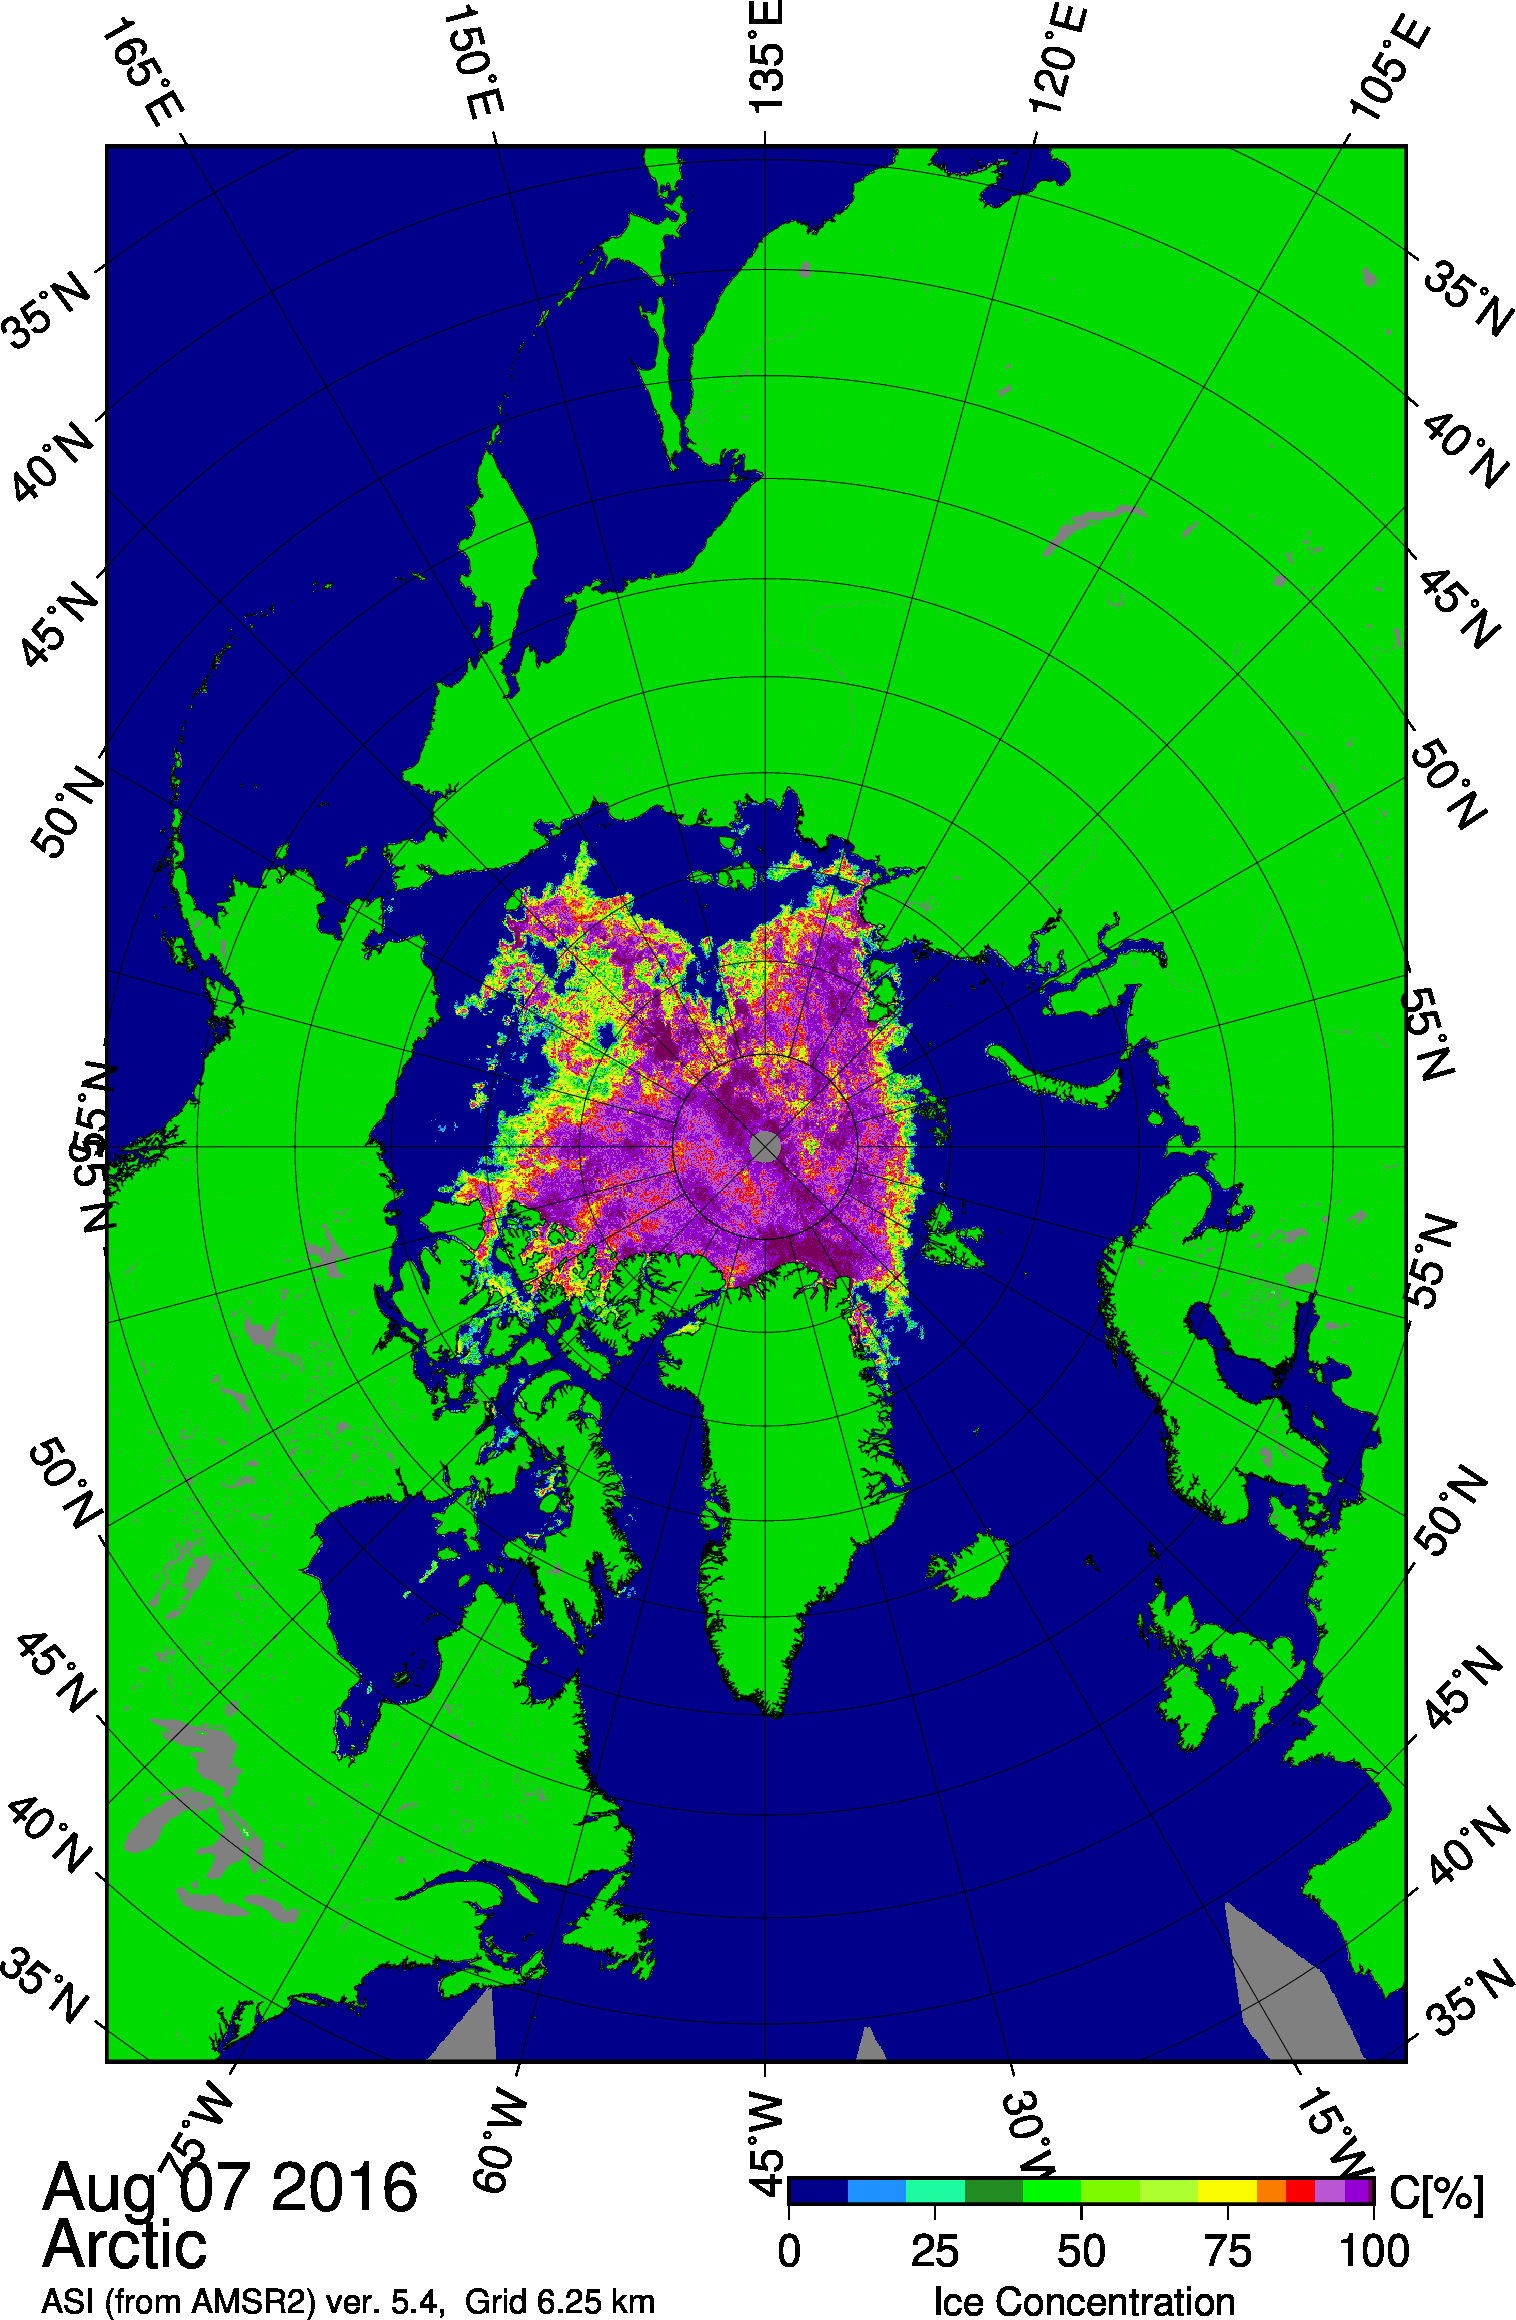
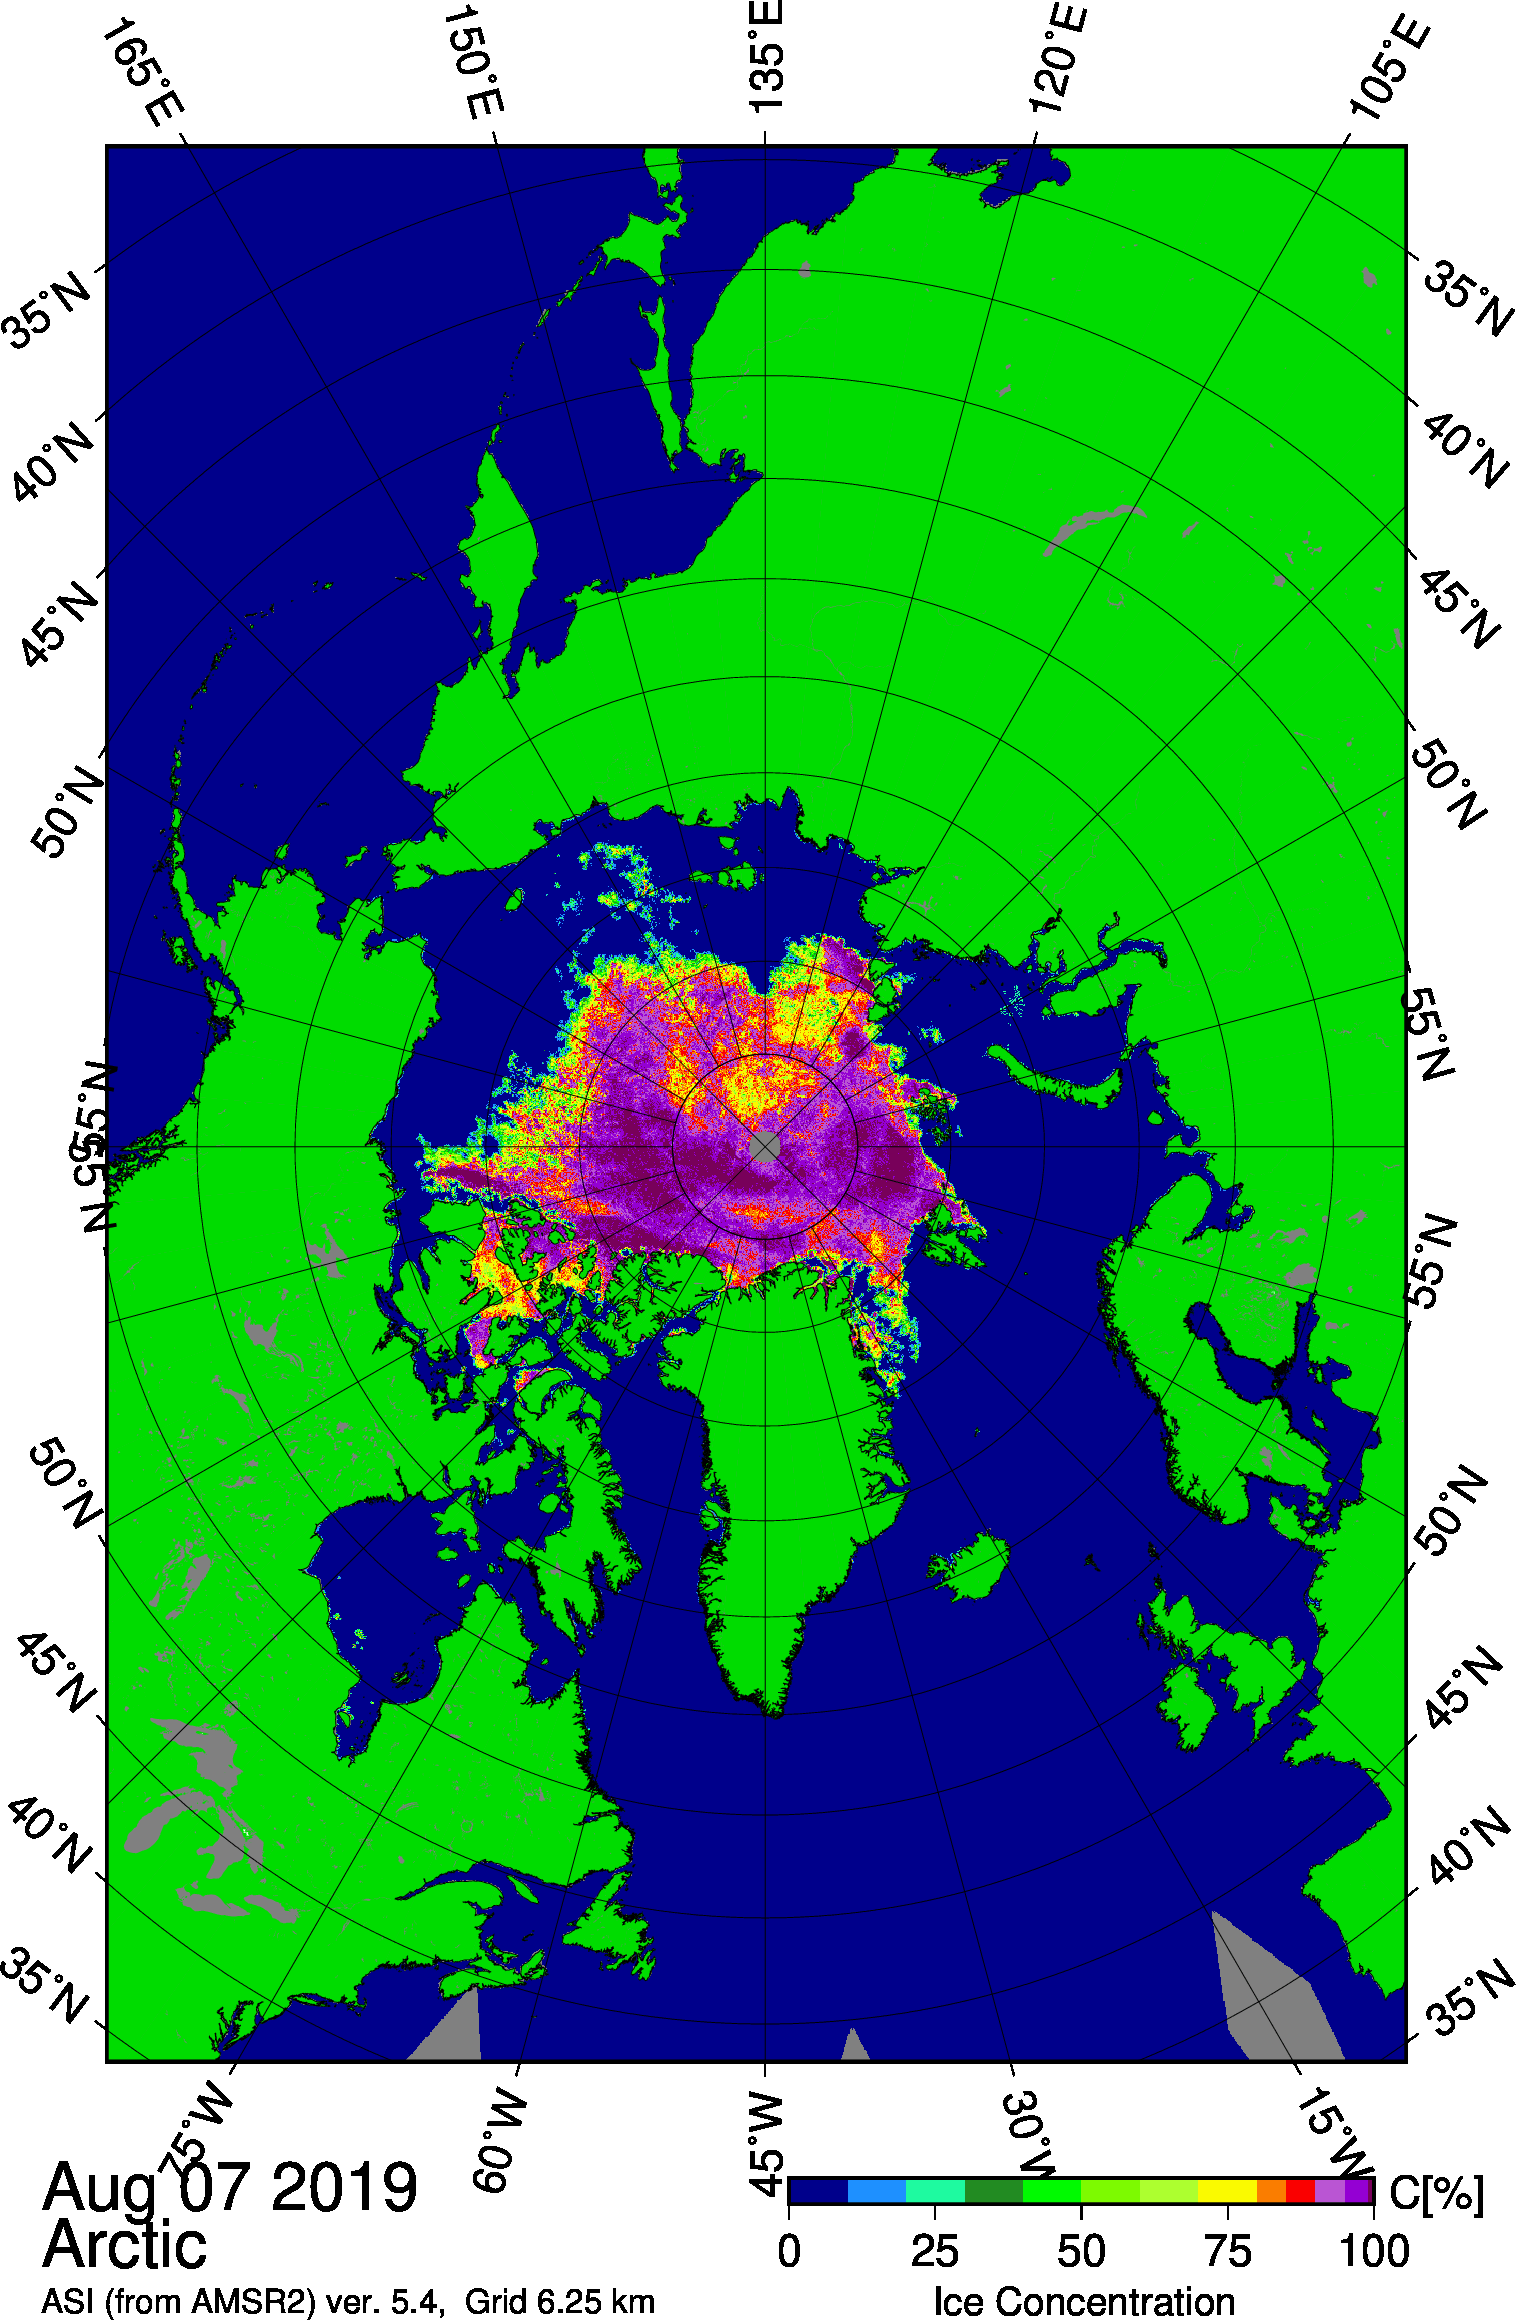
I mentioned before that Atlantic and CAA may prevent us from getting a new record. Much more ice there this year than 2012. But we still have a chance if ESS/Laptev can melt back far enough. We're tied for area right now. 2012 has some epic losses in early August though which is why I'm still a bit skeptical in addition to just looking at the individual regional concentration maps.
-
Still a chance, but pretty low odds IMHO. We'll need some very warm August weather. Atlantic and CAA are a problem further out in time. We'll need the ESS/Laptev sectors to melt toward the pole further than 2012 did to have a chance because the ATL and CAA are going to finish higher than 2012.
-
Yes, most likely....we've already seen some slowing the last few days. I'm not sure this year will be able to keep pace with 2012 going forward with that pattern. But we'll see.
-
Here's an animation comparing 2019 to 2012 on this date. I think the key to getting a new record is clearly going to be the Laptev/ESS side of the ice. The CAA are Atlantic side of the CAB are running way behind 2012 and those are going to be problems in sustaining the big losses. Click to animate....
-
I don't hope for catastrophic warming. But a record low extent makes it a more interesting season to track. I don't think there is some massive catastrophe that happens either if we break a record min. It didn't happen in 2012. We actually ended up rebounding in a big way the following season. Anyways, 2019 is off to a strong start in July so if we can build a couple hundred thousand lead on 2012, then we may have a chance. 2012's losses are so breathtaking later in the month and early August that we'll need to build up some more momentum. June didn't quite do the trick but if early July is hostile enough, maybe it can make up for it.
-
He's not wrong that there were probably some pretty low ice extents in the late 1930s or 1940s akin to perhaps the late 1990s or early 2000s but that definitely doesn't matter in the larger picture. The best data starts in 1979 so that is the natural starting point for most ice related graphs. It's not some conspiracy.
-
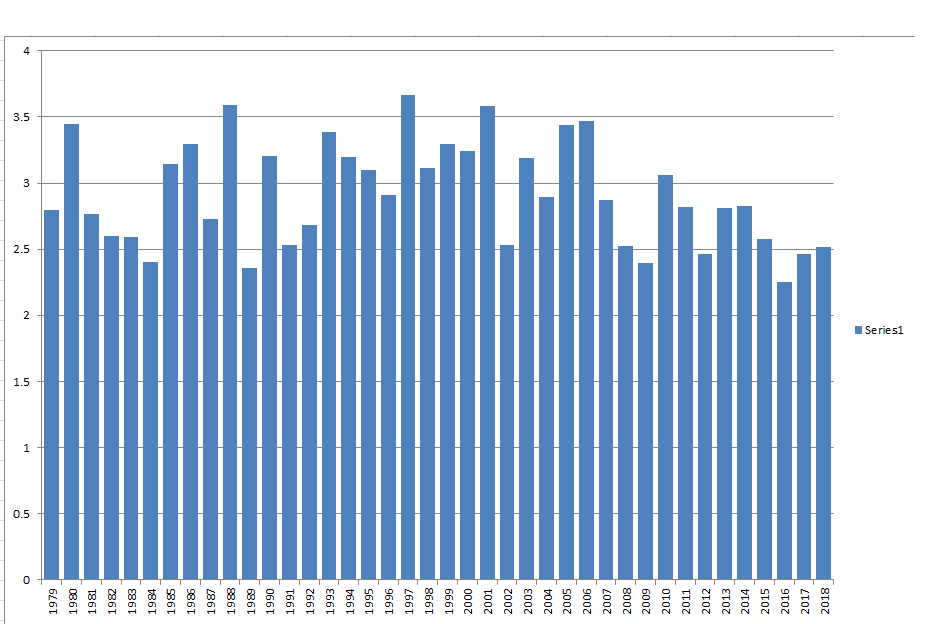
Final June NSIDC-adjusted area numbers are in, and we're currently 2nd lowest on record behind 2012 though 2007 and 2010 were very close to 2019 as well. What this means is that this year has an excellent chance to finish in the top 3 lowest extent/areas on record. Here are the top 5 lowest: 2012 (6.53 million sq km) 2019 (6.76 million) 2010 (6.77 million) 2007 (6.81 million) 2016 (6.94 million) Does this year have enough of a good start to set a new record? Most likely not. The numbers do not support it. That doesn't mean 0 chance though like more recent years. But we will have to set a new record for area loss between now and the minimum to get there...however, we don't have to set it by much....only about 40k. If we melt 40k more area than 2016 from here on out, we'll set a new minimum area record. The average 2007-2018 loss from July 1st onward was 4.13 million sq km. That would leave 2019 at 2.63 million sq km of ice at the minimum for area. The 2012 record sits at 2.22 million sq km of ice which means in order to set a new recrod, we need to lose 4.56 million sq km of ice area. 2016 is the current record of ice area loss from this point forward losing 4.52 million sq km. So as stated above, we will need to beat this by about 40k or more to pass 2012 at the minimum. That is going to be about 2 standard deviations or even a little more for losses. So I'd put the chances of setting a new record at about 5%. Again, this is for area only. Not extent. Extent is a little tougher since things like compaction can occur that affect extent a lot more than it affects area. Still, it will be hard to set the extent record as well. We might have a slightly greater than 5% chance at setting the extent record since 2012 wasn't extremely compacted. Getting back to area, below is a histogram of what would happen to 2019 if we followed all area losses from previous years....so for example, if we followed 2018 area losses from this point forward, we would finish with an area minimum of just over 2.50 million sqkm: So given the information above, I am going to predict a minimum area of 2.60 million sq km +/- 200k (2.4-2.8 for a range). I will set a minimum NSIDC extent of 3.8 million sq km +/- 200k (3.6-4.0 as a range). Neither of these ranges include the 2012 record...I don't believe we will quite make it. But this year at least has an outside shot unlike previous recent years, so at least there is a reason to track closely.
-
2010 (not listed on the graph) was actually the leader right now....but then it stalled starting tomorrow. But I think this year def has a better chance than 2010 since the weather forecast remains favorable for big ice losses over the next week.
-
I think "ice-free" has been defined as less than a million sq km of ice extent. I'm not sure if blue ocean event is the same thing but I'd assume it is. 100% ice free will never happen in this century because there will always be some residual ice clinging to northern Greenland or chunks of ice breaking off the Greenland glaciers.
-
The chance of a blue ocean event this year is 0%.
-
2019 is still in the running, but will need a strong finish to June: 2016: +70k 2012: -190k 2010: -300k 2007: +5k You can see how 2010 was actually running ahead of 2012 here for melting, but it then stalled near the end of the month and it continued into early July....putting an end to any chance of a nuclear finish like 2012 had. The guidance this year has a very impressive dipole to finish the month of June...so we might have a legit shot here. The big question will be if we can turn that into a big blocking high over the CAB or if it retreats more to the Asian side and becomes a reverse dipole, which would probably put an end to our chances at a record....the guidance is kind of split on that idea for the longer term. This melt season might finally have some drama after the colder early summers we've seen in recent years.