

ORH_wxman
-
Posts
93,098 -
Joined
-
Last visited
Content Type
Profiles
Blogs
Forums
American Weather
Media Demo
Store
Gallery
Everything posted by ORH_wxman
-
The rapid regression of PIOMAS seems to suggest that it might have been a little low in May versus reality. Hard to say for sure. We'll see what it does in the next couple weeks.
-
The area losses look like they are mostly coming from Hudson Bay and perhaps the Kara. The Kara is more meaningful, but Hudson bay can deceive us sometimes in both directions...the main basin looks pretty high concentration to me right now. Of course, we don't have SSMI/S area data right now...that's really the most important one for predictive purposes because unlike AMSR2 data, it is sensitive to melt ponding.
-
That's kind of weird. I know the winters there have gotten quite a bit colder in the past decade or two vs the 1990s (we've seen the whole autumn snow cover feedback on the Siberian high)...but it was the opposite in the warm season. I wonder why it would start cooling.
-
Yeah it looks like the only time a drop that high occurred in the record was between 1957 and 1958.
-
Out of curiosity, I plotted the May average temperature for the Siberian region....and it definitely is more of a 1990s profile (and 1980s/1970s for that matter)...so the flukish reversion to a cold May explained the big snow cover anomaly there.
-
I'd say looking at the data that you have to go back to 1996 to get snow cover this widespread on the Siberian coast into mid June. Thanks for the link...I assume you are talking about the level of "blueish" tint to the ice pack between years? I haven't really used this product before, but it's pretty cool. I've mostly used the false color products from AMSR/AMSR2 over the years with the area data from SSMI/S of course since it's a continuous dataset.
-
Do you have a link to the daily plots? Are those the ones from jaxa?
-
It looks like the high snow cover anomaly on the land in Siberia is maybe having an impact on the melt on that side of the ice pack too....maybe this is just "if there's high snow cover on land there then there's probably also high snow cover on the ice there" type argument too...but I'd think the wind off the land there would be much colder coming off a deeper/anomalous snow cover than when it's bare ground and more melted than usual which has been the norm for the past decade...I think this was the first positive May snow cover anomaly since 2004 and the highest since 1996.
-
We need to get bigger area drops soon to stay competitive with the lower years.
-
Of course there will be ice left in September. May was far too cold to entertain going something like 2.5 million sq km lower than 2012's extent minimum even with the volume starting as low as it did. If the weather's bad enough in June/July/August though, we could still beat 2012.
-
Looking at the differences between 2016 and 2017 on Cryosat2, we can try and find areas that might be more or less likely to melt out. I think there's a good chance that we have a more intact arm of ice that extends into the ESS this year vs last year. In contrast the ice is thinner in the Laptev this year, so the melt could go further poleward on that side. Keep in mind this is from April as cryosat2 stops taking measurements as meltponding starts in May.
-
It has to get going pretty quick if 2012 wants to be in the discussion. We'll want to see a pretty widespread warm pattern sustain over more than just the Chukchi/Beaufort...preferably over the Eurasian side too to get the melt ponding feedback going.
-
The lowest concentrations in 2016 at this point was showing up mostly in the Atlantic/Eurasian sector...and it's been really cold this year so far there, so it's probably not showing much melt ponding yet. We'll see how much that matters in the next few weeks...the warmth in the Beaufort/Chukchi could help 2017 play catchup a bit.
-
Euro ensembles want to establish a pretty good dipole pattern for the next 4-7 days...it would keep warm air flowing into the Pacific side of the arctic. That has been the warmest region so far this month...the Eurasian/Atlantic side has been in the deep freeze. But the thinnest ice is from Beaufort to Chukchi and that's where the warmth has been so we'll have to see if that ends up jump-starting things soon. We have some catching up to do in the Beaufort....you can also see how slow the Atlantic sector is this year with the cold spring.
-
You can't be serious about geoengineering. The arctic basin is still a huge area even if it's smaller than the U.S. A more important development is the cold weather that has been over most of the basin this month...particularly the Asian/Eurasian side as that side is typically the first to experience melt ponds and the cold weather is delaying the start of melt pond season there. That could put a dent in chances at a new record this year despite the record low volume entering this season. The chukchi is a bit above normal though, and that is the thinnest ice, so we'll see if that offsets it some, but the cold is forecast to remain quite stubborn for at least another week over the ESS/Laptev/Kara.
-
Looks like 850 temps reached -46C up in that region, that is pretty ridiculous even for there.
-
2016-2017 has been quite unique in showing no negative feedback to low volume during the summer. If you look at all the other low volume years, you see a pretty solid recovery in anomaly after the summer months. We'll see if there's any more recovery in March or April...if there isn't, then this year would be the first legit threat to 2012's min since it happened.
-
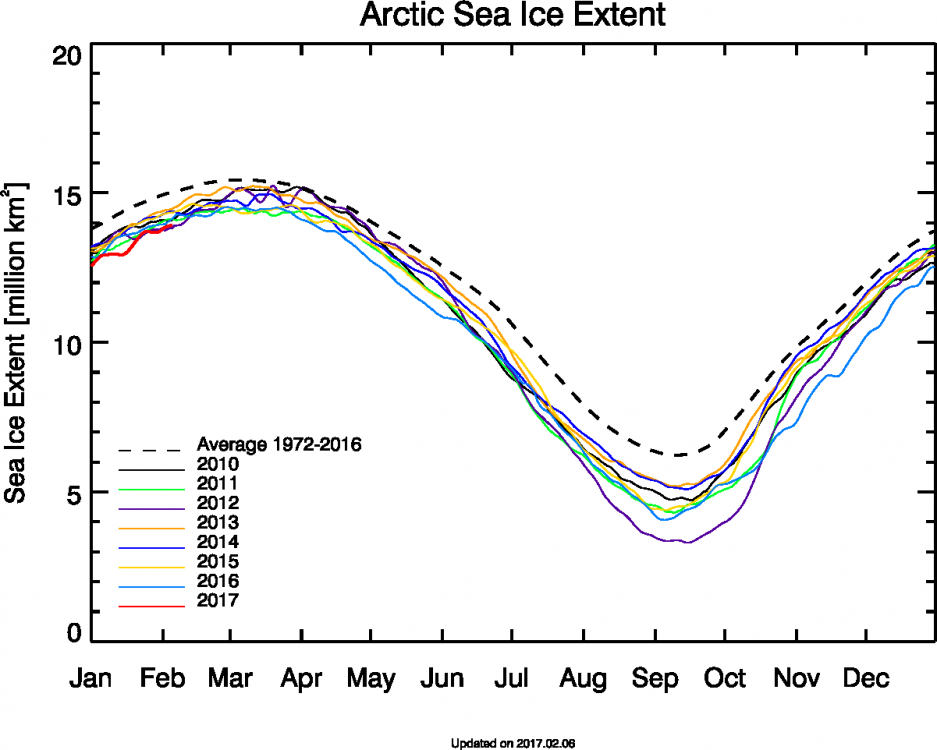
Too early to make any calls about max extent:
-
I do not agree with the graph that shows very little variability in the sea ice in the 1930s-1950s period. I had already made a post on this further back in the thread, but there is literature that supports higher variability in the sea ice during that time...there's compelling evidence that we had minimums similar to the 1980s and at least early 1990s for many of those years. We will never know for sure though...we have poor data in the Beaufort region from that period. That said, I disagree with blizzard1024 that the warmth now is similar to the 1940s...we've surpassed it recently...it was more similar to the warmth about 15 years ago in the arctic. There may be some localized regions (particularly in the North Atlantic sectors) where the 1940s had similar warmth to today, but not the arctic region as a whole.
-
He has started posting them in the New England forum too occasionally...might have to delete his account.
-
Yeah, in all my reading, I've never come across any big correlations for ENSO to sea ice. There's been some regional effects at times as you noted. There was a paper I also read a while back that linked increased subsurface flow from the Bering sea into the Chukchi during El Nino events which may produce lower sea ice in that region...but the overall effect on the arctic as a whole is pretty weak.
-
He's right, here is very little evidence of these "tipping points" that cause "runaway" melting. This is probably even more true for southern ice. In the Arctic, where ice is thicker, a big volume loss event like 2007 can cause a step-down, but that isn't possible in Antarctic sea ice since most of the ice there melts out every year. And even as the Arctic has gone to a higher percentage of first year ice since 2007, we've seen very little correlation from year to year of values. The Tietsche et al 2011 paper went into depth on this issue when there was a lot of speculation about ice free arctics by 2014 or 2015 due to "runaway melting" after the 2007 min. The paper concluded that you wouldn't see this due to negative feedback in the form of volume regeneration in winter months. This is exactly what we have seen and why those early ice free predictions busted and haven't really come close. They said you needed to blunt the volume regeneration in the form of much much warmer winter temps...and we actually saw a glimpse of this last winter. It was so warm that it probably helped in not allowing some first year ice to survive the past summer that might have normally done so...so we had a pretty low minimum despite the summer weather not being all that hostile. So once we get winter temps regularly surpassing last winter, then there is more physical mechanism for ice free Arctic at the min. The southern sea ice is less well understood and is pretty sensitive to surface wind. The huge Weddell sea polynya was actually a regular feature in the 1970s and has reappeared smaller a few times in the 1980s too. But this recent occurance is the biggest since then. Gordon et al 2007 hypothesizes that the southern annular mode contributed to it in the past. http://journals.ametsoc.org/doi/abs/10.1175/JCLI4046.1
-
We have garbage data from the North American side in the mid-20th century....ironically the best data on the Asian side of the pole for sea ice back then. The Mahoney et al paper is probably the most robust in the literature for sea ice records...but of course it only covers about 3/4th of the arctic region that would lose ice when we're comparing to the 1980s/1990s...we don't have good Beaufort Sea ice data: Then of course you can go on temperatures....the late 1930s through the early 1950s had temperatures very comparable to the 1980s...and at least into the early 1990s. We'll never know for certain because we don't have a full dataset. But I think there is absolutely some compelling evidence that sea ice had years comparable to the 1980s/1990s back in the mid-20th century.
-
Nikolai, cut the sh** if you want your visit to last more than a few days.
-
Fastest rebound/gain on record in September and then the slowest Oct on record...really bizarre autumn so far.
