

ORH_wxman
-
Posts
93,092 -
Joined
-
Last visited
Content Type
Profiles
Blogs
Forums
American Weather
Media Demo
Store
Gallery
Everything posted by ORH_wxman
-
Energy “crashing into the west coast” can go both ways. It can keep a system from cutting too and they can also temporarily amp up the ridge downstream of it…it all depends how the trough hitting the west coast is behaving. If it is n the process of digging, then it will help amp the ridge ahead of it, if it’s in the process of weakening, then it will act more like a kicker. A lot of big dogs had energy hitting the west coast…Jan 2016, Feb 2013, Boxing Day 2010, Feb 2001, Dec 1992….those are just the ones I know. But there are likely others too. We don’t know if it will help or hurt yet. It’s one of those nuances that isn’t really known at this type of lead time.
-
Didn’t get much of any snow in SNE until Xmas to New Years that December. We had about an inch early Xmas morning and then a larger warning event Dec 26-27 and then a solid 6-10 incher Dec 29th. The immediate coast got shafted until basically February.
-
Yeah Ray and I’ll note that GEFS looked better than EPS on that front. We’ll see if EPS trends more toward GEFS like it often has this season in the pacific but no guarantees. But if EPS is basically going to kill any kelvin waves, then it’s also probably going to get a lot more volatile in its forecasts with large spread given the lack of primary forcing there. Who knows. But I’d rather have the active El Niño look at least if we’re going to have marginal airmasses. It makes it more interesting to track. You don’t have a meat grinder SE ridge.
-
I’m also not convinced we see that Canadian chinook look all month…there’s some notable forcing moving toward the dateline on some of the charts I was looking at on Ventrice’s site. You’d think that will produce some buckling in the N PAC and raise heights over AK as we move toward mid-month. Im not expecting a Siberian express, but I could see some better looking airmasses start showing up.
-
@CoastalWx Improvemts in GEFS late in the run? Looked like higher heights working into AK. I’m hoping guidance will start reacting more to the tropical forcing as we get closer. Seems like we do get into a more favorable look sometime mid-month.
-
Euro not gonna be enough this run for 1/9 (still has an area of confluence shunting this south) but that was a significant improvement from 00z so something to keep an eye on.
-
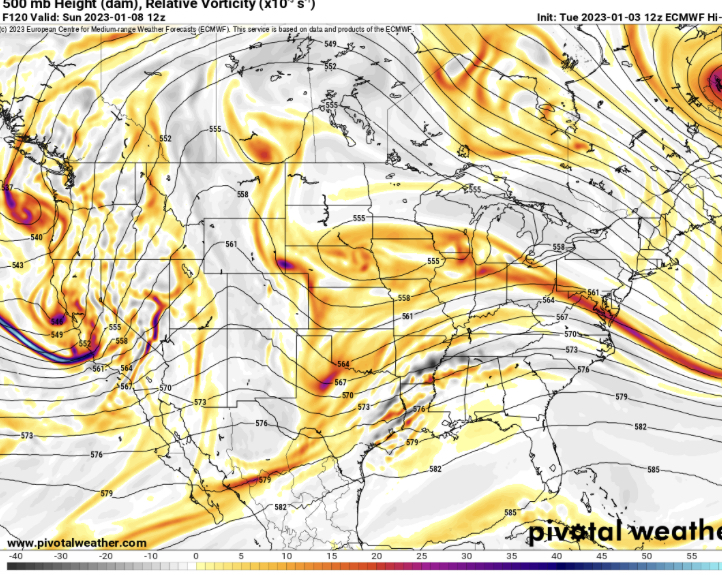
Euro looking quite a bit more intriguing through 120h than previous runs for 1/9. Kind of a classic split flow look here
-
You’ll avoid the latter for now. No true arctic air in site.
-
Yeah I think 1/9 is mostly an interior deal if it happens. Airmass isn’t super fresh but it’s not total puke either. So we’ll see if this one keeps trending better.
-
Yeah can’t rule that out. Pretty marginal though both on temps and QPF. But ULL swinging through should always be watched.
-
Fwiw, Ukie came in better for 1/8-9 as well. Seems like all guidance at 12z saw something they liked for that threat. Previously it was well squashed south but today it’s a lot more amplified.
-
2-4 feet for 1/12-13….can always adjust higher if we need to when we get closer.
-
GGEM actually has a hit too on 1/9. But yeah, I wouldn’t invest much yet in that one. It’s def not one of those large teleconnector on signals.
-
Gonna have to watch 1/9 a little closer? Both Icon and GFS somewhat interesting so far at 12z.
-
I don’t think it’s ever happened away from the coast there. Looking at BDL, which isn’t exactly a snow magnet, their lowest is 14.7 in 1936-37 and then 14.9 in 1988-89. BDR has done it a handful of times but their lowest is 8.2” so I’d find it difficult for your location to have ever been sub-10” at least in the years we have records. I’m sure if you go back far enough prior to official records maybe there was a near snowless winter.
-
1/12 and maybe 1/14-15 are prob the two periods to watch after this weekend. There’s a very low prob that 1/8 could try and bring something but the flow looks a bit too flat to get that system far enough north.
-
Yeah I’m just going to start aggressively moving the whining posts to the panic room thread. There’s actually some events to track now and even though many don’t care about an inland icing threat or marginal snow threat, some still do so the whiners/don’t carers can exit this thread or we will do it for them.
-
NAM is basically ZR north of pike over elevated interior by 12z Thursday. By overnight Thursday night, it cold tucks into eastern areas. Gotta watch that if there is light precip going on.
-
It mostly sucks where he is unless there’s good Atlantic blocking. But it can work for us. If it snows, nobody is going to remember any of the pattern talk. Snowfall is the end-all regardless of what the pattern shows.
-
There’s no QPF really for a real ice storm. It does look like there could be a prolonged period of freezing drizzle though so things could certainly get pretty slippery.
-
I’m not sure I’ve ever seen the whining reach this level. Not in 2013, not in 2015 and not in the horrific Jan/Feb/Mar 2020 stretch. It’s gotten embarrassing.
-
Yeah I’m fine with realism. Always saying it looks good or always saying it looks bad just eliminates any credibility.
-
Well deserved too.
-
This is the silver lining of the last few years. Some of these younger snow-entitled spoiled brats who never saw more than a couple cruddy years in a row can feel the sting a little bit.
-
Interesting look at the end with all that energy still west. Gonna have to watching for icing over interior too prior to that. Has the freezing drizzle look for like 24-36 hours after Thursday morning.


